Research Article
Development of a Real-Time, Large Area, High Spatial
Resolution Particle Tracker Based on Scintillating Fibers
D. Lo Presti,
1,2D. L. Bonanno,
1F. Longhitano,
2C. Pugliatti,
1,2S. Aiello,
2G. A. P. Cirrone,
3V. Giordano,
2E. Leonora,
2N. Randazzo,
2S. Reito,
2F. Romano,
3G. V. Russo,
1,2M. Russo,
1,2V. Sipala,
4,5C. Stancampiano,
2and C. Ventura
21Department of Physics and Astronomy, University of Catania, 95123 Catania, Italy 2Istituto Nazionale di Fisica Nucleare (INFN), 95123 Catania, Italy
3Laboratori Nazionali del Sud (LNS), 95123 Catania, Italy 4University of Sassari, 07100 Sassari, Italy
5Istituto Nazionale di Fisica Nucleare (INFN), Sezione di Cagliari, 09042 Monserrato, Italy
Correspondence should be addressed to D. Lo Presti; [email protected]
Received 3 May 2013; Revised 28 November 2013; Accepted 22 December 2013; Published 9 March 2014 Academic Editor: Chao-Qiang Geng
Copyright © 2014 D. Lo Presti et al. This is an open access article distributed under the Creative Commons Attribution License, which permits unrestricted use, distribution, and reproduction in any medium, provided the original work is properly cited. The
publication of this article was funded by SCOAP3.
The design of a detector for tracking charged particles is presented together with the characterization techniques developed to extract the main design specifications. The goals for the final detector are to achieve real-time imaging performances, a large detection area, and a high spatial resolution, particularly suitable for medical imaging applications. This paper describes the
prototype of the tracker plane, which has a 20× 20 cm2sensitive area consisting of two crossed ribbons of 500𝜇m square scintillating
fibers. The information about the hit position extracted real-time tracker in an innovative way, using a reduced number of the read-out channels to obtain a very large detection area but with moderate costs and complexity. The performances of the tracker have
been investigated using𝛽 sources, cosmic rays, and a 62 MeV proton beam.
1. Introduction
Cutting edge research in the treatment of tumors has been oriented towards hadrontherapy, one of the most effective external radiotherapy techniques, which uses charged par-ticle beams (protons and carbon ions) with energy up to 400 AMeV. Such beams make it possible to accurately release the dose required to control a cancerous mass, leaving at the same time the surrounding healthy tissue almost untouched. The maximum advantage from using charged particle beams is reached when there is precise information regarding the stopping power of the particles used for the radiotherapy treatments. The direct use of this information, rather than that from X-ray tomography, leads to a more accurate evaluation of the distribution of the dose and can be used to verify the positioning of the patient.
Therefore, the availability of very accurate imaging sys-tems is of fundamental importance [1]. Our task is to design and build an imaging system for charged particles based on
the consolidated principle of residual range measurement [2] taking, at the same time, advantage of new detection techniques. The aim is to use this system to achieve large detection areas (up to 30× 30 cm2) suitable for almost all medical physics applications, high spatial resolution (up to 150 microns) and time resolution (up to 2 ns). With this in mind, we have developed a prototype of an𝑋-𝑌 tracker plane, the OFFSET detector, mainly funded by the Istituto Nazionale di Fisica Nucleare (INFN), which has been accurately tested with radioactive sources, cosmic rays, and the 62 MeV proton beam available at the Laboratori Nazionali del Sud (LNS) CATANA proton therapy facility.
2. OFFSET
The OFFSET 𝑋-𝑌 detector consists of two planes of scin-tillating fibers (Sci-Fi) orthogonal to each other. The 20× 20 cm2 sensitive area of the prototype was built employing
Volume 2014, Article ID 692908, 13 pages http://dx.doi.org/10.1155/2014/692908
500𝜇m square multicladding BCF-12 [3] Sci-Fi manufac-tured by Saint-Gobain. In these fibers, the energy released by a crossing particle produces an isotropic emission of light. Only a part of this light is channeled into the fiber [4], which at this point acts as a guide. This light flows in both directions along the fiber. The factory can deliver the fibers as a preglued, aligned, 400 fiber ribbons. We have arranged two ribbons into orthogonal layers, one above the other, kept in position by the pressure of two square aluminum frames, delimiting the sensitive area of the detector, as shown in
Figure 1. In a classical read-out scenario, every Sci-Fi must be optically coupled to a light sensor, each read, from a channel of the front-end electronics. In the case of the 20× 20 cm2prototype there are 400 + 400 channels, meaning that a suitable read-out system not only would be complex but aslo would certainly suffer from high dead times.
2.1. Channel Reduction System. The OFFSET tracker uses a
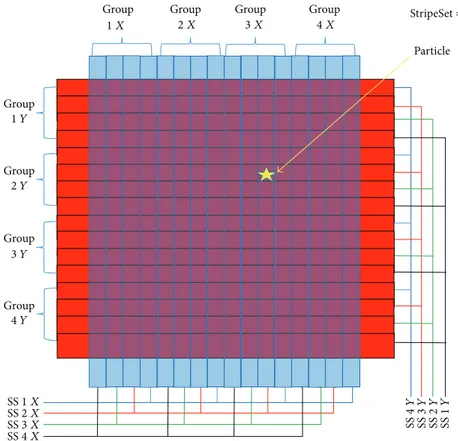
system, for the reduction of the read-out channels, suitable for many imaging conditions. It detects one particle at a time. This architecture reduces the number of the read-out chan-nels for a linear segmented detector and it is a modern version of previous applications [5,6]. The operating principle of the channel reduction can be explained as follows. Let us consider a strip detector. Each strip is read from both ends but the meaning of the two signals is interpreted differently as a result of different groupings. At one end, the strips are read together in groups of𝑛 contiguous strips, while at the other end the first strips of each group are grouped in StripSet (SS) 1, the second strips of each group in SS 2, and so on. A particle crossing one strip generates two signals at both ends.
Then we have a signal from the𝑖th group and another from the𝑗th StripSet that uniquely identify the Striphit, hit by the particle according to
Striphit = (𝑖 − 1) ∗ 𝑛 + 𝑗. (1)
The𝑋-𝑌 strip detector shown inFigure 2, consisting of 16 strips for each plane, is an example of a two-dimensional strip detector, where the channel reduction system is applied. In a classical read-out scenario of a two-dimensional strip detector, there would be 16 read-out channels for the 𝑋 direction and 16 for the𝑌 direction, making 32 channels. In the example the position of the impact point, marked with a star, is 𝑥 = 11 and 𝑦 = 6. Figure 2 also shows the proposed read-out reduction system that allows the total number of channels to be reduced to only 16. Using a simple mathematical treatment the optimized number of channels appears to be equal to4√𝑁, where 𝑁 is the total number of strips per layer,𝑋 or 𝑌. It is very interesting that, when 𝑁 is large, the reduction factor becomes significant, especially in real-time applications.
The bound coincidence between the ends of each strip, not present in a simple strip read-out system, allows spurious signals (noise, crosstalk, dark current, etc.) to be automati-cally filtered. It should be noted that, to reconstruct the point where the particle crosses the detector (event), it is necessary for it to release energy in both planes. The application of a read-out channel reduction system consists in a suitable grouping and coupling of the Sci-Fi to larger standard (clear)
Figure 1: The OFFSET tracker without the cover. The 20× 20 cm2
sensitive area, delimited by the square frame, is visible.
optical fibers. Each group of𝑛 Sci-Fi is coupled to a suitable clear fiber that is faced to a light sensor. The read-out channel reduction factor depends only on the relationship between the cross-sections of the Sci-Fi and of the clear fibers.Figure 3
shows (a) the scheme of the optical coupling and (b) pictures of the Sci-Fi and clear fibers prepared for coupling.
In the OFFSET tracker, the application of the read-out channel reduction system led to 160 channels, exactly one-fifth of those necessary without channel reduction.
2.2. Photosensor. A single multianode photomultiplier
(PSPM) is used as a light sensor instead of having separate light sensors for each clear fiber. We have chosen the 16× 16 pixels H9500 PSPM Hamamatsu photomultiplier [7]. It needs only one high voltage power supply and provides an additional signal, called the dynode, which is connected to all the last dynodes of each PSPM channel.
In the detector, 10 Sci-Fi are coupled to a single clear fiber. The light from the scintillating fibers propagates through the clear ones to the distance required, which in the case of the OFFSET tracker is about one meter, to reach the PSPM photocathode pixels. The coupling is made by routing and fixing the Sci-Fi and the clear fibers mechanically with optical gel. The size of the clear fibers is constrained by the pixel size of the selected photomultiplier, about 2.8× 2.8 mm2, which limits the scale of reduction of the detector channels. Using photomultipliers with a larger pixel area or smaller Sci-Fi, the channel reduction could increase significantly.
2.3. Front-End Electronics. The front-end electronics is
sim-ple and very fast. The PSPM is socketed onto the front-end board. The anodic resistance for all channels was chosen as a compromise between the amplitude and the timing char-acteristics of the anodic voltage signal [8]. A fast comparator that feeds a monostable reads each of the 160 PSPM anodic signals. The threshold chosen for the comparators is about 1/3 of the mean amplitude of a single photoelectron.
2.4. Data Acquisition. The front-end electronics information
is acquired by simple digital acquisition electronics for subsequent preanalysis, filtering, and fast storage into a PC. Logic signals from the front-end board are fed into a data acquisition module, a real-time FPGA PXI-7813R [9], via four
Group Group Group Group Group Group Group Group Particle 1 X 2 X 3 X 4 X 1 Y 2 Y 3 Y 4 Y SS4 X SS3 X SS2 X SS1 X SS 4Y SS 3Y SS 2Y SS 1Y StripeSet= SS
Figure 2: An example of the application of the channel reduction system.
Section view
Side view
500 𝜇m Sci-Fi
(a)
(b)
(a) (b)
Figure 4: (a) The OFFSET tracker without the cover and (b) the complete OFFSET tracker.
output connectors fitting the data acquisition interface cable requirements. This module has 160 digital inputs/outputs and performs sampling up to 40 MHz and supports real-time analysis and DMA transfer to mass storage. Given this sampling frequency, the comparator output has been stretched up to 100 ns by the monostable in the front-end board in order to have at least three samples for each event. This choice limits the maximum rate to no more than 10 M particle/sec. Using a higher performance read-out module, it would be possible to attain up to 100 M particle/sec, which is the maximum rate allowed by the photomultiplier output signal characteristics. A real-time module, the PXIe-8102, is interfaced to the PXI-7813R through the PXI bus. A solid-state hard disk is used to store data. The PXIe-1062Q crate hosts the PXI-7813R, the real-time module, and the hard disk and has gigabit Ethernet communication to the acquisition PC. The identification of a pattern of at least four coincident high logic signals determines the trigger condition of the system. We have developed the firmware and the software for the OFFSET tracker data acquisition, analysis, display, and control, using the LabView software platform. National Instruments manufacture the electronic devices mentioned in this section.
2.5. The Overall Detector. Figure 4shows two pictures of the
final detector. In (a), without the cover, the sensitive 20× 20 cm2area made of Sci-Fi and the routed clear fibers, which guide the scintillation light to the PSPM, are visible. In (b), with the cover, the front-end board is visible. The overall size of the detector, including the mechanical structure, is 70× 100 cm2.
3. The Scintillating Fiber
A measurement campaign was performed on selected Sci-Fi for the OFFSET detector [10]. The fibers used are the 500𝜇m size, square multi-cladding BCF-12 produced by SG [3].
3.1. Light Generation and Transmission Properties in Sci-Fi.
The Sci-Fi have been characterized to measure the atten-uation length of the light over the distance travelled from
the production point to the end of the fiber that is optically coupled to a photosensor. The manufacturer supplies a range of catalog specifications for all types of Sci-Fi with a diameter of one millimeter. It is not possible to extrapolate the specifications for different Sci-Fi diameters or cross-sections with a different shape. In particular, the submillimeter Sci-Fi have a dopant concentration higher than the concentration of the thicker fibers, which is responsible for a larger production of scintillation light. The higher dopant concentration is used to increase the light yield of the Sci-Fi but also influences their light attenuation performances. The manufacturer does not give the dopant concentration and, furthermore, this can slightly change from one stock of fibers to another. This is the main reason why the Sci-Fi needs a precise characterization before any application. The system used by SG to measure the attenuation length, for example, is to record the actual output of a bialkali photomultiplier, optically coupled to a Sci-Fi, in response to a90Sr𝛽 source placed at varying distances along the fiber, from one to three meters, to the photomultiplier.
The attenuation length of an optical fiber is defined as the distance at which the intensity of light travelling along the fiber is reduced to1/𝑒 of its initial intensity. From scientific literature [11,12], the attenuation length function is the sum of two exponential terms, and, in this case, we can define two attenuation lengths acting in two distinct intervals of the distance travelled by the light along the fiber. Furthermore, the attenuation length is a function of the wavelength.
In this work we will consider only the integral attenuation length, convolution of the response of the Sci-Fi, and the quantum efficiency of the selected photomultiplier (PMT).
It should be noted that by definition the input light is generally considered as travelling along the fiber axis direction. In the case of scintillation light, this condition is not fulfilled because the light is produced isotropically inside the fiber and, therefore, only a fraction of the scintillation light is channeled into the fiber after a characteristic distance. There-fore, in our case the transmission properties for scintillation light and injected light are quite different.
3.2. Attenuation Length. In the first survey, the attenuation
length function was extrapolated by projecting a pulsed laser beam of about 400 nm wavelength coaxially at one end of
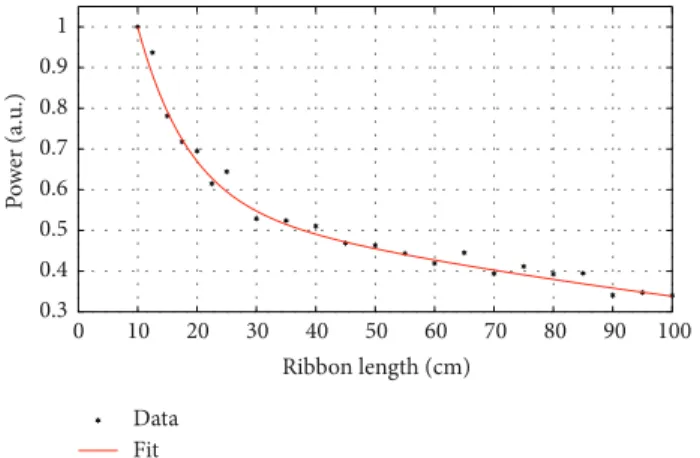
0 10 20 30 40 50 60 70 80 90 100 0.3 0.4 0.5 0.6 0.7 0.8 0.9 1 Ribbon length (cm) P o w er (a.u .) Data Fit
Figure 5: Plot of the data and the best fit relative to attenuation length measurement by coaxial laser injection.
Table 1: Extrapolated parameters: cut fiber.
Parameters Values
𝑎 1,417
𝑐 0,6107
𝜆1 8,52 cm
𝜆2 173,55 cm
a ribbon of 8 Sci-Fi, using a bolometer to measure the amount of light collected at the other end. This measurement was made starting with a one-meter long Sci-Fi ribbon and repeated, shortening the length of the ribbon by cutting it each time, while trying to preserve the same conditions.
In this way, each measurement is the average of the results on the individual Sci-Fi, both in terms of the parameter dispersion of fibers and of the repeatability and uniformity of the ribbon-cutting and lapping procedure.
In dark conditions, the background level was recorded before turning on the laser beam to take each new measure-ment. A 10 MHz laser pulse frequency was chosen to fit the input dynamic range of the bolometer. The Sci-Fi ribbon was gradually shortened down to 10 cm.Figure 5shows the power measured by the bolometer, normalized to its maximum value, for each fiber length.
Fitting the data by double exponential function in (2), we obtained the parameters reported inTable 1:
𝑦 (𝑥) = 𝑎𝑒−𝑥/𝜆1+ 𝑐𝑒−𝑥/𝜆2 . (2)
3.3. Optical Coupling. A preliminary step is to determine
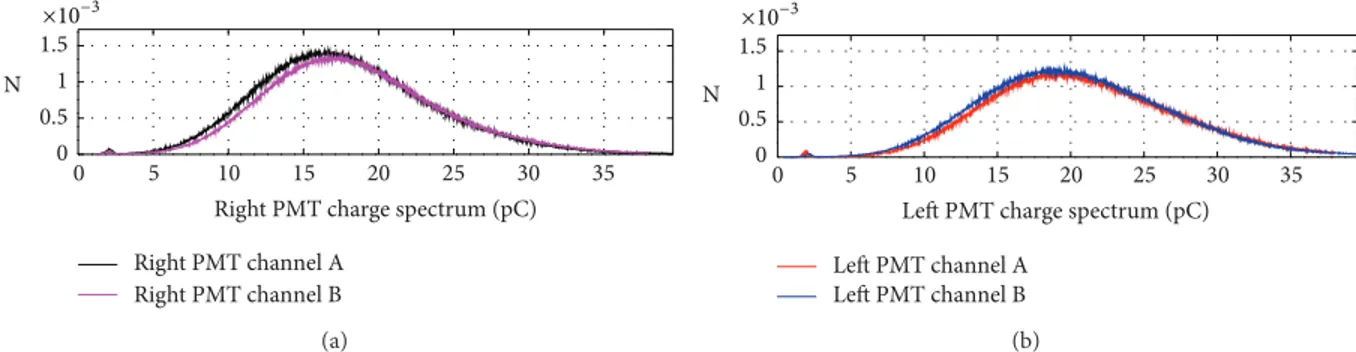
the asymmetry between the two channels, called Left and Right, mainly related to the different optical coupling or different quality of the ribbon-cutting procedure. It was carried out with an intense UV laser beam (wavelength 385 nm) illuminating the center of the ribbon and recording the average relationship between the charge measured by the two chains, PMTs and data acquisition electronics. The PMTs and the electronic chains were accurately characterized before the measurement. The two Thorn-EMI 9816B PMTs were set to about the same gain (≈2,4 × 10⁷). After absorption, UV laser light produced scintillating light in the Sci-Fi.
The measurement was repeated by reversing only the channels of the acquisition system to eliminate offset and any differences in gain and sensitivity of the two channels.
Figure 6shows the charge spectra obtained with laser light for the Right (A) and the Left side (B).
Each of the figures shows the results obtained by reversing the A and B electronics and acquisition channels. In effect, the results, which take into account the differences of the various parameters, are essentially the same, showing a deviation of less than 2%. The laser light is injected perpendicularly into the center of the ribbon and, therefore, the light is attenuated along the fibers by the same amount in each direction. It follows that the relationship between the centroids of the spectra of the Left and Right PMTs is the ratio between the different attenuations due to the optical coupling between the PMT and fiber ribbon, taking into account the differences between the PMT and electronic channels.
3.4. Measurement with UV Light. A widely used method for
the characterization of the Sci-Fi is to move a particle source along the fiber and to measure the light at its ends.
We designed a different measuring apparatus in which the scintillation was produced by incident particles perpendicu-lar to the Sci-Fi ribbon, thus ensuring a constant amount of isotropic light, regardless of the entry point of the particle in the scintillator. We used a UV laser beam controlled by a pulse generator which, passing through a collimator, hits a ribbon consisting of four 500𝜇m square Sci-Fi in a very small area, that is, only 3 mm.Figure 7shows the experimental setup, schematic view, and picture. Two PMTs are optically coupled to the opposite edges of a Sci-Fi ribbon. The light source is mounted on a slide.
The block diagram of the data acquisition system employed for the measurement is shown in Figure 8. The electronic chains for the two PMTs are the same as for cosmic ray measurement.
The acquisition of the input signal is controlled by a trigger signal whose duration is the time window of measure-ment (GATE). This signal, leaving the connections unit, is present only if the pulses from the PMTs coincide with the sync-out signal of the laser. The combination of attenuator and amplifier modules at the output of the PMTs is used to fit their signal charge with the input dynamic range of the two QDCs.
3.5. Comparison of the Results. These two measurements are
not actually comparable for reasons relating to the mecha-nism of light production. In the first case, light is injected at one end of the fiber ribbon and read at the opposite end, after the cut and lap procedure. In the second case the scintillation light is produced by a UV laser beam positioned perpendic-ularly with respect to the fiber with almost constant intensity. The different mechanisms of production and propagation of light in the two cases explain the different results regarding the attenuation length measurement.Figure 9shows a plot of the two derived attenuation length functions.
The fit parameters for the two measurements are summa-rized inTable 2. The parameters refer to (2).
0 5 10 15 20 25 30 35 0
0.5 1 1.5
Right PMT charge spectrum (pC) Right PMT channel A Right PMT channel B ×10−3 N (a) Left PMT channel A N Left PMT channel B 0 5 10 15 20 25 30 35 0 0.5 1 1.5
Left PMT charge spectrum (pC)
×10−3
(b)
Figure 6: Charge spectra for the Right PMT (a) and for the Left PMT (b) obtained by injecting the UV laser into the center of the fiber ribbon and reversing the electronic chains.
UV laser collimated
Left PMT Right PMT
Sci-Fi ribbon
Figure 7: Schematic view and picture of the experimental setup. Table 2: Summary of the fit parameters.
Technique Parameters Values
Cut and lap
𝑎 1,346 𝑐 0,58 𝜆1 8,5 cm 𝜆2 1,74 m UV laser 𝑎 1 𝑐 0,65 𝜆1 8,52 cm 𝜆2 1,05 m
3.6. GEANT4 Simulations on the Fibers Response to Proton Beams. The simulation software was adapted to meet the case
of protons that pass through the fiber ribbon perpendicularly. This result was provided thanks to GEANT4 simulations. Note that in the case of the proton beam the simulated trace length is not very different and it plays an important role in the efficiency of the scintillating fiber. The spectrum of energy deposited on fibers by 62 MeV protons is shown inFigure 10. Notice that the average energy released in these conditions by the particles is∼546 keV.
A similar simulation was carried out with 250 MeV protons considering the specific requirements for the detec-tor. In this case, the average energy released, according to the simulation, is 408 keV and therefore lower than for the 62 MeV protons. Given that consideration, the paper continues assuming the context of the 250 MeV protons as the condition in which the scintillation light is lower.
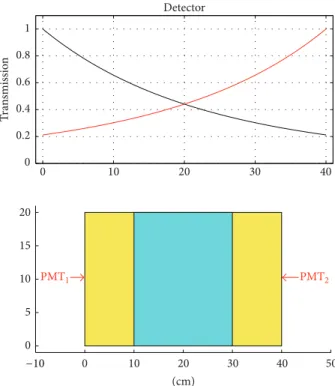
Using fiber ribbons of the type previously considered to build the detector, not all of the tape forms part of the sensitive area. Indeed, a part of the tape is used for optical coupling. The simulation takes it into account generating protons only on the sensitive area, as shown in blue in
Figure 11. In any case, when the attenuation of the scintillation light from the scintillating fibers is calculated, the entire length of the tape must be considered, including both the yellow and the blue areas as shown inFigure 11.
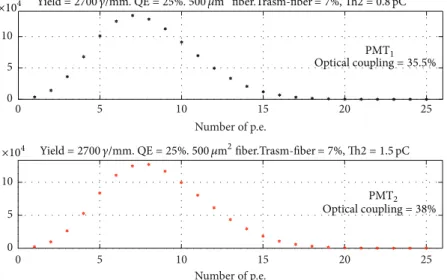
The expected output spectra from the two photomultipli-ers are shown inFigure 12. As can be observed, there are no highlighted single or double photoelectron peaks.
The distribution of photoelectrons detected by the two photomultipliers for the protons is plotted in Figure 13, which shows that the responses of the two photomultipliers cannot be superimposed. The peak of the distribution of the photomultiplier called PMT1has moved further to the left, indicating that less photoelectrons are detected. This effect is mainly due to the different distances at which the sensitive photomultipliers have been placed to simulate the needs of real techniques, as shown inFigure 15. The small differences between the two spectra are due to the different gains and optical couplings between the two channels.
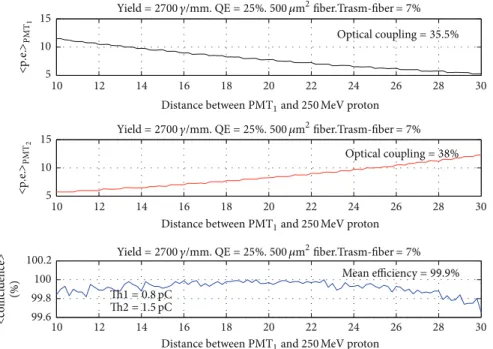
Figure 14 shows the average number of photoelectrons detected by the two PMTs as a function of the proton impact position on the fiber measured, starting from PMT1.
Figure 14also shows the number of simulated PMT signals in coincidence for a given threshold and an average detection efficiency of 99.9%.
The results are, therefore, that, in the case of 250 MeV protons, the detection efficiency increases just for the events relating to the sensitive area and the central ribbon. As in the previous case regarding muons, events related to the extreme zones of the belt are more likely to produce noncoincidence between the two photomultipliers and then to be lost in the acquisition phase. In these conditions, however, the average efficiency occurs almost constantly throughout the ribbon.
If we consider a detector consisting of two superimposed planes of fibers oriented perpendicularly to each other, it can be deduced that the detection efficiency is the total square of the one previously mentioned. Since this is 99.9%, this suggests that the efficiency of the detector remains completely unchanged.
PMT left
Laser sync-out
AMPL 200x Channel A ORTEC 420
Fan-in fan-out Fan-in fan-out
Delay QDC C PMT right Attenuator right Delay QDC D CFD CH2 Scaler Attenuator left AMPL 200x Channel B ORTEC 420 CFD CH3 Coincidence unit Dual timer CFD CH1
Figure 8: Block diagram of the data acquisition system.
0 10 20 30 40 50 60 70 80 90 100 0 0.1 0.2 0.3 0.4 0.5 0.6 0.7 0.8 0.9 1 N o rm alized t ra n smissio n (a.u .) UV laser fit Cut and lap fit
x (cm)
Figure 9: Plot of the two normalized attenuation length functions. In blue, the attenuation length for the cut and lap quality control, with coaxial light injection. In red, the attenuation length function obtained by UV laser.
Energy deposit (MeV)
0 0.2 0.4 0.6 0.8 1 1.2 1.4 1.6 1.8 2 En tr ies 0 50 100 150 200 250 300 Entries 2000 Mean 0.5463 RMS 0.06307 Energy deposit
BCF-12 fiber (blue) 500 micron-protons 62 MeV @ 0 cm
Figure 10: GEANT4 simulation of protons, which pass through the fiber ribbon perpendicularly. Spectrum of energy released by 62 MeV protons on the BCF-12 fibers.
0 10 20 30 40 0 0.2 0.4 0.6 0.8 1 T ra n smissio n Detector 0 10 20 30 40 50 0 5 10 15 20 (cm) PMT1 PMT2 −10
Figure 11: Transmission and sensitive area in the detector 20×
20 cm2.
It is evident that it is possible to design a detector with the services requested in advance/to advance specifications. It should however be noted that, given the fact that the OFFSET detector is subject to loss of scintillation light due to the optical couplings, multianode super bialkali photomultipliers with high quantum efficiency could be employed to ensure good detection efficiency margins. A simulation using a photomultiplier with a QE equal to 35% is shown inFigure 15. It should be remembered that these results were obtained for 250 MeV protons. This is an unfavorable condition with respect to the 62 MeV protons.
0 20 40 60 80 100 (pC) 0 20 40 60 80 100 (pC) 0 1 2 3 4 5 0 2 4 6 1 p.e. 2 p.e. 3 p.e. Threshold PMT1 PMT2
Simulation. ADC:0.1696 pC/ch; offset = 11 pC Simulation. ADC:0.1818 pC/ch; offset = 4 pC
1 p.e. 2 p.e. 3 p.e. Threshold GainC= 9.5. GainPMT1= 2.32∗107. FWHMPMT1= 90% GainD= 9.44. GainPMT2= 2.46∗107. FWHMPMT2= 75% 33.83 𝜇C; 1 p.e. = 3.94 pC
1009001 events. Total charge
1009001 events. Total charge
29.79 𝜇C; 1 p.e. = 3.72 pC
Yield= 2700 𝛾/mm. QE = 25%. 500 𝜇m2fiber.Trasm-fiber= 7%, Th2 = 0.8 pC
Yield= 2700 𝛾/mm. QE = 25%. 500 𝜇m2fiber.Trasm-fiber= 7%, Th2 = 1.5 pC
Optical coupling= 35.5%
Optical coupling= 38%
Figure 12: Spectra simulated of the output to the two photomultipliers.
0 5 10 15 20 25 0 5 10 Number of p.e. PMT1 PMT2 ×104 0 5 10 15 20 25 0 5 10 Number of p.e. ×104 Yield= 2700 𝛾/mm. QE = 25%. 500 𝜇m2fiber.Trasm-fiber= 7%, Th2 = 0.8 pC Yield= 2700 𝛾/mm. QE = 25%. 500 𝜇m2fiber.Trasm-fiber= 7%, Th2 = 1.5 pC Optical coupling= 35.5% Optical coupling= 38%
Figure 13: Spectra of the expected output from the two photomultipliers in a number of photoelectrons.
In conclusion, the different production mechanisms of the scintillation light determine different integral attenuation length functions. Two exponential law components may be distinguished: one short and one long.
4. OFFSET Tests
The design of the OFFSET tracker started with simulation studies in order to evaluate the detector architecture on
the basis of its response to different stimuli: cosmic rays,𝛽 sources, and proton beams at different energies. Nevertheless, the GEANT4 simulations [13] of submillimeter Sci-Fi were not decisive, due to a lack of sufficient factory information. However, the scientific literature [12, 14] provides some essential reference points for the design of the detector. The best way is to directly measure the selected Sci-Fi coupled to the selected photo-sensor in order to find, for example, the maximum size limits that the detector can reach. The OFFSET tracker is well below these limits. The OFFSET
10 12 14 16 18 20 22 24 26 28 30 10 12 14 16 18 20 22 24 26 28 30 10 12 14 16 18 20 22 24 26 28 30 5 10 15 5 10 15 99.6 99.8 100 100.2 <co incidence> (%) Mean efficiency= 99.9% < p. e.> PMT 1 < p. e.> PMT 2 Th1 = 0.8 pC Th2 = 1.5 pC Yield= 2700 𝛾/mm. QE = 25%. 500 𝜇m2fiber.Trasm-fiber= 7% Yield= 2700 𝛾/mm. QE = 25%. 500 𝜇m2fiber.Trasm-fiber= 7% Yield= 2700 𝛾/mm. QE = 25%. 500 𝜇m2fiber.Trasm-fiber= 7%
Distance between PMT1and250 MeV proton
Distance between PMT1and250 MeV proton
Distance between PMT1and250 MeV proton
Optical coupling= 35.5%
Optical coupling= 38%
Figure 14: Photoelectrons produced as a function of the impact position for the two PMTs and detection efficiency.
0 10 20 0 10 20 10 12 14 16 18 20 22 24 26 28 30 99,98 100 10 12 14 16 18 20 22 24 26 28 30 10 12 14 16 18 20 22 24 26 28 30 (%) Mean efficiency= 100% < p. e.> PMT 1 < p. e.> PMT 2 Th1 = 0.8 pC Th2 = 1.5 pC <co incidence> Yield= 2700 𝛾/mm. QE = 25%. 500 𝜇m2fiber.Trasm-fiber= 7% Yield= 2700 𝛾/mm. QE = 25%. 500 𝜇m2fiber.Trasm-fiber= 7% Yield= 2700 𝛾/mm. QE = 25%. 500 𝜇m2fiber.Trasm-fiber= 7%
Distance between PMT1and250 MeV proton
Distance between PMT1and250 MeV proton
Distance between PMT1and250 MeV proton
Optical coupling= 35.5%
Optical coupling= 38%
Figure 15: Simulation similar toFigure 14adopting photomultipliers with a QE of 35%.
detector was tested using𝛽 sources, cosmic rays, and proton beams.
4.1. Tests Using 𝛽 Sources and Cosmic Rays. We have
pre-liminarily tested the OFFSET detector using two different sources: 𝛽 sources and cosmic rays. The use of 𝛽 sources is very useful because it allows an image to be produced in the worst possible conditions, that is, with low linear energy transfer particles, and also to bench-test the detector without the limitations of an accelerator room. Figure 16 shows a
real-time image of a 90 Sr 𝛽 source with a 2 cm diameter. Some lines are clearly missing. These lines correspond to the tenth fiber of each Sci-Fi group and indicate a worse optical coupling than in the other groups, due to the Sci-Fi routing procedure. An important test is the detection of cosmic rays because they are minimum ionizing particles (MIP) and they represent a diffused source of low energy transfer particles. It should be noted that the 250 MeV proton beam used for medical imaging is equivalent to about 2 MIP. The image provides additional information: first, the level of uniformity
50 60 70 80 90 100 110 120 130 140 150 60 70 80 90 100 110 120 130 140 150 160 0 500 1000 1500 2000 2500 3000 X [fibers] Y [fib er s]
Figure 16: Real-time image of a 3 KBq 90Sr𝛽 source acquired by the OFFSET tracker. Axis units are in fibers number. The exposure time,
needed to reach the three millions of events prefixed for the image, is of about 30 minutes.
Figure 17: Image, due to the cosmic rays, acquired by the OFFSET tracker.
in the detector response and second, the level of efficiency of the detector.Figure 17shows the image of the cosmic rays acquired in 47 hours, relative to the entire active area of the detector. Three groups of Sci-Fi, ten Sci-Fi each, are absent in the image. This is due to the failure of their front-end channels. Some vertical and horizontal lines are missing for the same reason as given in the case of the test using𝛽 sources.
4.2. Test with 62 MeV Protons. The prototype of the tracker
plane has also been tested with a 62 MeV proton beam in the CATANA [15] facility at the LNS.
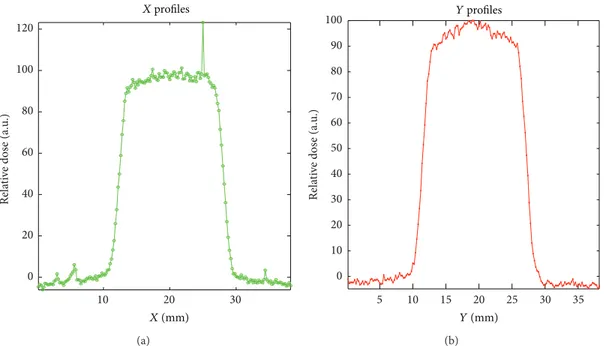
Before measuring, the CATANA staff performed a beam profile characterization along the𝑋 and 𝑌 directions employ-ing calibrated diodes. The result is shown in Figure 18. In order to perform a precise calibration of the detector, a
gafchromic EBT [16] film was fixed to the portion of the sensitive area crossed by the proton beam. Using the beam profile characterization, we have calibrated the gafchromic film.Figure 19shows a sketch and a picture of the experimen-tal setup.
The comparison between the standard beam profile and the measurements with OFFSET allowed the imaging perfor-mances of the tracker to be extracted. A long run, up to about 1.6 Gy, was performed using all beam spots and then an eye-shaped collimator. The calibrated gafchromic EBT film was digitized with a scanner and the final dose distribution was used to calibrate the region of the sensitive area of the tracker intersected by the beam. The calibration was performed by summing, for each pixel, all the images acquired, based on the reasonable assumption that any nonuniformity in the pixel response in the sensitive area was time invariant. The same calibration matrix produced using the beam spot was used to correct the eye-shaped image and the results are shown in
Figure 20. In this image, it is possible to see where the dashed circle representing the calibration area of interest ends and how it influences the eye-shaped collimator image.
Another long run, up to about 1.2 Gy, was performed using a 1.5 cm diameter-hole calibrated collimator. During this run, an image of the beam was recorded in real time every minute. In this case, there are no missing fiber groups, such as in the previous acquisition (Figures16,17, and20) thanks to the repair of the front-end board. The lack of uniformity is mainly due to the different optical couplings between the fibers and the PSPM and the non-uniformity of the PSPM photo cathode gain.
Figure 21shows the results of the test. Starting from the gafchromic EBT film image and the raw sum of all the images acquired with the hole collimator, a calibration matrix was obtained. Once calculated, the calibration matrix was then applied to each image acquired.
10 20 30 0 20 40 60 80 100 120 Rela ti ve dos e (a.u .) X profiles X (mm) (a) 5 10 15 20 25 30 35 0 10 20 30 40 50 60 70 80 90 100 Rela ti ve dos e (a.u .) Y profiles Y (mm) (b)
Figure 18: Beam profile characterization acquired with calibrated diodes.
Beam pipe
Gafchromic EBT film
Offset
(a) (b)
Figure 19: Drawing (a) and picture (b) of the experimental setup inside the CATANA hadrontherapy facility.
(a) 0 10 20 30 40 50 60 70 80 0 10 20 30 40 50 60 70 80 1 0.9 0.8 0.7 0.6 0.5 0.4 0.3 0.2 0.1 0 (b)
0 10 20 30 40 50 60 70 80 90 0 10 20 30 40 50 60 70 80 90 100 X [fibers] Y [fib er s] 1 0.9 0.8 0.7 0.6 0.5 0.4 0.3 0.2 0.1 0 (a) 0 10 20 30 40 50 60 70 80 90 100 0 20 40 60 80 100 X [fibers] Y [fib er s] 1 0.9 0.8 0.7 0.6 0.5 0.4 0.3 0.2 0.1 0 (b) 0 10 20 30 40 50 60 70 80 90 0 10 20 30 40 50 60 70 80 90 100 X [fibers] Y [fib er s] 1 0.9 0.8 0.7 0.6 0.5 0.4 0.3 0.2 0.1 0 (c)
Figure 21: (a) The gafchromic EBT film image, (b) the raw sum of all the images with OFFSET, and (c) the corresponding image, calibrated.
Axes are in fiber units (500𝜇m).
0 10 20 30 40 50 60 70 80 90 100 Fibers 1 0.8 0.6 0.4 0.2 0 0 10 20 30 40 50 60 70 80 90 100 Fibers YZ se ct io n-no rm alized 1 0.8 0.6 0.4 0.2 0 no rm alized XZ se ct io
n-Figure 22: Beam profiles monitored during time by the OFFSET tracker.
After calibration, each one-minute frame was analyzed in order to perform a beam profile characterization, monitoring the beam profile during time.Figure 22shows this result.
4.3. Efficiency. In order to determine the detection efficiency
of the prototype, a constant fraction discriminator measured the rate 𝑟CFD (about 70 kparticle/sec) of the particles that
crossed the sensitive area of the detector, mainly due to the light produced in the scintillating fibers. The measurement was made using the dynode signal of the PSPM connected to the input of a SensL CFD [17]. The PSPM dark rate of about 100 Hz is negligible. The𝑟CFD was compared with the rate
measured with a plastic scintillator read by a bialkali photo-multiplier, placed after the OFFSET tracker downstream of the beam. Correcting the dead area of the detector (mainly due to the cladding), the two measured rates were about the same (the ratio of the rates is about 0.9 and the dead area due to the cladding about 10%). Therefore,𝑟CFDwas taken as the
reference value for the detector efficiency calculation. Then we measured the rate𝑟Trof tracks recorded by the detector read-out using the trigger condition described in
Section 2.4. Some events are missing due to the lack of some vertical and horizontal lines. We have estimated the rate𝑟Teof
tracks in these lines to be the average of the neighbour pixels. In this way, the total rate𝑟Ttof tracks can be evaluated as the
sum𝑟Tt +𝑟Te. Then the detection efficiency of the sensitive
area𝜂𝐷is expressed by the ratio𝑟Tt/𝑟CFD, which results to be
80.5%.
As already mentioned the sensitive area of the detector is reduced by the multicladding of the fiber, which is naturally not taken into account by𝑟CFD. In an𝑋-𝑌 square detector
with length𝐿 that uses square fibers of thickness 𝑟𝑓with a multicladding that is𝑡𝑐thick, the active area can be calculated as
𝑆𝑎 = (1 − 2𝑡𝑐
𝑡𝑓)
2
𝐿2. (3)
Then the geometric efficiency is 𝜂𝐺= (1 − 2𝑡𝑐
𝑡𝑓)
2
. (4)
The employed fibers have𝑡𝑐/𝑡𝑓= 0.06, and then𝜂𝐺can be evaluated as about 77%. Then the total detection efficiency𝜂𝑇 of the OFFSET tracker is
𝜂𝑇= 𝜂𝐷× 𝜂𝐺. (5) With all the detector channels working, we would expect 0.8× 0.77 that is 62% efficiency.
5. Conclusion and Outlook
The paper presents a characterization technique for selected scintillating fibers to extract the main design specifications. The first prototype of the OFFSET tracker was designed and tested with𝛽 sources, cosmic rays, and a proton beam. The system is easily and reproducibly assembled. In addition, it has the great advantage of a system to reduce the read-out channels applied to a large area and high spatial resolution detector, employing submillimeter Sci-Fi. A complete char-acterization was carried out and the results were presented. A new version of the detector is now under construction in order to reduce its overall size, improve its imaging performances, and extend the sensitive area to 30× 30 cm2. The obtained results demonstrate the validity of the designed read-out technique, which has been patented by the INFN [18].
Conflict of Interests
The authors declare that there is no conflict of interests regar-ding the publication of this paper.
References
[1] G. A. P. Cirrone, G. Candiano, G. Cuttone et al., “The Italian project for a proton imaging device,” Nuclear Instruments and
Methods in Physics Research A, vol. 576, no. 1, pp. 194–197, 2007.
[2] D. A. Watts, U. Amaldi, A. Go et al., “A proton range telescope for quality assurance in hadrotherapy,” in Proceedings of the
Nuclear Science Symposium Conference Record (NSS/MIC ’09),
pp. 4163–4166, Orlando, Fla, USA, October 2009.
[3] Saint Gobain Crystals—Scintillating optical fibers brochure,
http://www.nhlbi.nih.gov/meetings/workshops/cardiorenal-hf-hd.htm.
[4] D. Lo Presti, G. V. Russo, E. Leonora et al., “Characterization technique of sub-millimeter scintillating fibers,” in Proceedings
of the IEEE Nuclear Science Symposium and Medical Imaging Conference (NSS/MIC ’11), pp. 2104–2108, Valencia, Spain,
October 2011.
[5] T. Bressani, M. Caria, S. Serci et al., “Performance of an econ-omic time-of-flight scintillator hodoscope,” Nuclear
Instru-ments and Methods in Physics Research, vol. 221, no. 2, pp. 355–
362, 1984.
[6] M. Caria, P. Macciotta, S. Marcello, G. Puddu, S. Serci, and T. Bressani, “On the limits of the performances of time-of-flight scintillator hodoscopes saving the number of photomultipliers,”
IEEE Transactions on Nuclear Science, vol. 32, no. 1, pp. 609–611,
1985.
[7] Hamamatsu web page, http://www.hamamatsu.com/us/en/
index.html.
[8] D. Lo Presti, L. Caponetto, and N. Randazzo, “Low power multi-dynamics front-end architecture for the optical module of a neutrino underwater telescope,” Nuclear Instruments and
Meth-ods in Physics Research A, vol. 602, no. 1, pp. 126–128, 2009.
[9] National Instruments web page,http://www.ti.com/.
[10] D. Lo Presti, “A 3-D large area imaging system with very high performances,” in Proceedings of the 10th International
Con-ference on Large Scale Applications and Radiation Hardness of Semiconductor Detectors, Florence, Italy, July 2011.
[11] A. Antonelli, M. Antonelli, G. Barbiellini et al., “Measurements of light yield, attenuation length and time response of long samples of “blue” scintillating fibers,” Nuclear Instruments and
Methods in Physics Research A, vol. 370, no. 2-3, pp. 367–371,
1996.
[12] Z. Papandreou, B. D. Leverington, and G. J. Lolos, “Spectral res-ponse of scintillating fibers,” Nuclear Instruments and Methods
in Physics Research A, vol. 596, no. 3, pp. 338–346, 2008.
[13] S. Riggi, P. La Rocca, E. Leonora et al., “Geant4 simulation of plastic scintillator strips with embedded optical fibers for a pro-totype of tomographic system,” Nuclear Instruments and
Meth-ods in Physics Research A, vol. 624, no. 3, pp. 583–590, 2010.
[14] G. Drexlin, V. Eberhard, D. Hunkel, and B. Zeitnitz, “Spectral attenuation length of scintillating fibers,” Nuclear Instruments
and Methods in Physics Research A, vol. 360, no. 1-2, pp. 245–
247, 1995.
[15] G. A. P. Cirrone, G. Cuttone, P. A. Lojacono et al., “A 62-MeV proton beam for the treatment of ocular melanoma at laboratori nazionali del sud-INFN,” IEEE Transactions on Nuclear Science, vol. 51, no. 3, pp. 860–865, 2004.
[16] EBT gafchromic film,http://www.harpell.ca/manufacturer/isp/
gafchromic-ebt.
[17] SensL website,http://sensl.com/.
[18] D. Lo Presti, Patent cod. RM2012A000273 by Istituto Nazionale di Fisica Nucleare.
Submit your manuscripts at
http://www.hindawi.com
Hindawi Publishing Corporation
http://www.hindawi.com Volume 2014
High Energy PhysicsAdvances in
The Scientific
World Journal
Hindawi Publishing Corporation
http://www.hindawi.com Volume 2014
Hindawi Publishing Corporation
http://www.hindawi.com Volume 2014
Fluids
Journal ofJournal of Atomic and Molecular Physics
Hindawi Publishing Corporation
http://www.hindawi.com Volume 2014
Hindawi Publishing Corporation
http://www.hindawi.com Volume 2014
Advances in
Condensed Matter Physics
Optics
International Journal of
Hindawi Publishing Corporation
http://www.hindawi.com Volume 2014
Hindawi Publishing Corporation
http://www.hindawi.com Volume 2014
Advances in
Astronomy
International Journal of
Hindawi Publishing Corporation
http://www.hindawi.com Volume 2014
Superconductivity Hindawi Publishing Corporation
http://www.hindawi.com Volume 2014 Statistical Mechanics
International Journal of
Hindawi Publishing Corporation
http://www.hindawi.com Volume 2014
Gravity
Journal ofHindawi Publishing Corporation
http://www.hindawi.com Volume 2014
Astrophysics
Journal ofHindawi Publishing Corporation
http://www.hindawi.com Volume 2014
Physics
Research International
Hindawi Publishing Corporation
http://www.hindawi.com Volume 2014
Solid State PhysicsJournal of Computational Methods in Physics
Journal of
Hindawi Publishing Corporation
http://www.hindawi.com Volume 2014
Hindawi Publishing Corporation
http://www.hindawi.com Volume 2014
Soft Matter
Journal ofHindawi Publishing Corporation http://www.hindawi.com
Aerodynamics
Journal ofVolume 2014
Hindawi Publishing Corporation
http://www.hindawi.com Volume 2014
Hindawi Publishing Corporation
http://www.hindawi.com Volume 2014
Journal of
Biophysics
Hindawi Publishing Corporation
http://www.hindawi.com Volume 2014