Research Article
Seismic Retrofit of a Multispan Prestressed Concrete Girder
Bridge with Friction Pendulum Devices
Alberto Maria Avossa
,
1Danilo Di Giacinto,
1Pasquale Malangone,
1and Fabio Rizzo
2 1Department of Engineering, University of Campania “Luigi Vanvitelli”, Aversa, Caserta, Italy2Department of Architecture, University of Chieti-Pescara “G. d’Annunzio”, Pescara, Italy
Correspondence should be addressed to Alberto Maria Avossa; [email protected] Received 23 December 2017; Accepted 4 February 2018; Published 14 March 2018
Academic Editor: Ivo Cali`o
Copyright © 2018 Alberto Maria Avossa et al. This is an open access article distributed under the Creative Commons Attribution License, which permits unrestricted use, distribution, and reproduction in any medium, provided the original work is properly cited.
The paper deals with the proposal and application of a procedure for the seismic retrofit of an existing multispan prestressed concrete girder bridge defined explicitly for the use of friction pendulum devices as an isolation system placed between piers top and deck. First, the outcomes of the seismic risk assessment of the existing bridge, performed using an incremental noniterative Nonlinear Static Procedure, based on the Capacity Spectrum Method as well as the Inelastic Demand Response Spectra, are described and discussed. Then, a specific multilevel design process, based on a proper application of the hierarchy of strength considerations and the Direct Displacement-Based Design approach, is adopted to dimension the FPD devices. Furthermore, to assess the impact of the FPD nonlinear behaviour on the bridge seismic response, a device model that reproduces the variation of the normal force and friction coefficient, the bidirectional coupling, and the large deformation effects during nonlinear dynamic analyses was used. Finally, the paper examines the effects of the FPD modelling parameters on the behaviour of the retrofitted bridge and assesses its seismic response with the results pointing out the efficiency of the adopted seismic retrofit solution.
1. Introduction
It is well known that a great portion of the Italian road system has already been built and a remarkable number of existing bridges, currently in exercise on the national road network, were designed and realized without any sort of earthquake resistant criteria. It is, therefore, expected that many of these bridges are highly vulnerable to the seismic actions or can withstand the effects of an earthquake with a lower intensity than the design levels required by some seismic code provisions [1, 2]. The current efforts being made to protect bridges against earthquakes should, therefore, be focused on minimizing the lateral forces to be carried by the piers. Consequently, seismic isolation could be considered one of the most promising alternatives as a retrofit strategy to improve the seismic performance of existing bridges. In the seismic isolation approach, the superstructure mass is uncoupled from the seismic ground motions using special types of bearings (isolators) which are placed both below the
superstructure and on top of the substructure piers and abut-ments. During a strong earthquake, the isolators add lateral flexibility to the bridge, shifting the vibrational periods of the structures to avoid resonance with the excitations. This allows the superstructure to oscillate at a lower frequency than the piers, thus resulting in large relative displacements across the isolator interface. Those large displacements can be con-trolled either by incorporating damping elements in the bear-ing or by addbear-ing supplemental dampers. Isolation systems are basically typified into rubber bearings and sliding bearings. Although rubber bearings have been extensively used in base isolation systems, sliding bearings with curved sliding sur-faces (friction pendulum device, FPD) have recently found some applications, with several studies having investigated their effectiveness in protecting bridges from damage caused by strong earthquakes. Constantinou et al. [3], Kartoum et al. [4], and Tsopelas et al. [5] conducted experimental studies on bridges isolated by sliding bearings with displacement control devices to real earthquake ground motion applied Volume 2018, Article ID 5679480, 22 pages
independently in longitudinal and transverse directions. The results of this study demonstrated a substantial improvement in the ability of the isolated bridge to provide for seismic excitation under elastic conditions. Wang et al. [6] developed a systematic method for the nonlinear dynamic analysis of bridges with sliding isolation. Dicleli and Mansour [7] have studied the economic and structural efficiency of the friction pendulum device (FPD) application for retrofitting typical seismically vulnerable bridges in the State of Illinois. Moreover, the effects of ground motion characteristics on the dynamic response and performance of seismically isolated bridges have been evaluated by some authors [8–11].
Along with research on new technology, new design methodologies have also been developed to fulfill the requirements of the performance-based earthquake engi-neering [12]. Performance levels have been described in terms of displacements since damage is better correlated to displacements rather than forces. Consequently, new design approaches, based on displacements, have been imple-mented. One of these consists in the Direct Displacement-Based Design (DDBD), proposed by Priestley [13]. The primary goal of DDBD is to design a structure which will exhibit a target displacement profile when subjected to earthquakes consistent with a given reference response spectrum. An early Displacement-Based Design approach for the design of bridge with seismic isolation can also be found in [14, 15]. An extension of the Displacement-Based Design procedure for bridges simply supported on hysteretic isolation bearings has been proposed by Jara and Casas [16]. Moreover, a Displacement-Based Design (DBD) procedure for continuous decks and multispan simply supported deck bridges equipped with different seismic isolation systems has been proposed by Cardone et al. [17] and Pietra et al. [18].
Within this context, the authors have already proposed a procedure for the seismic retrofit of an existing multispan prestressed concrete road bridge, based on the use of High Damping Rubber Bearing (HDRB) devices as an isolating system placed between pier top and deck [19]. Moreover, the authors presented some preliminary results regarding a sim-ilar approach based on the use of friction pendulum device (FPD) for the seismic retrofit of the same case study bridge [20]. In this paper, the authors propose a more comprehensive and updated version of this procedure, defined explicitly for the use of friction pendulum devices (FPD) as an isolating system. Furthermore, the application of the procedure aims to assess and discuss the impact of the FPD device parameters on the seismic retrofitted bridge performance.
As in the previous paper [19], the procedure is firstly based on the preliminary seismic risk assessment of the bridge in existing state carried out using an incremental noni-terative approach inspired by the Capacity Spectrum Method and Inelastic Demand Response Spectra proposed by Fajfar [21]. This approach, following the PBEE criteria, allows directly correlating the seismic performance levels to the dif-ferent intensities of seismic action. Regarding this first part of the procedure, using the same case study of an existing multispan prestressed concrete road bridge, whose structural scheme is also representative of a fairly widespread typology
for the construction of road bridges, more specific details are here provided.
Then, the bridge seismic retrofit according to the new seismic actions required by the current Italian Code [2] was achieved by means of a seismic protection strategy based on the use of friction pendulum device (FPD) as an isolating system placed between the top of the substructure elements and the deck. With this aim, a rational approach to the design of curved-surface friction isolators for the seismic rehabilita-tion of the bridge was proposed and applied. This approach is inspired by the hierarchy of strength considerations as well as the Direct Displacement-Based Design (DDBD) method [14]. Consequently, to assess the impact of the FPD device on the seismic bridge performance, structural models are needed to capture the behaviour of these highly nonlinear elements [22]. Therefore, a model for the FPD that can represent the variation of the normal force, a friction coefficient and rate
parameter, bidirectional coupling, and𝑃-Δ effect during the
nonlinear dynamic analyses was used.
Finally, the seismic response of the retrofitted bridge was evaluated by means of nonlinear response history analysis (NRHA). The structural analyses were developed using a new 3D finite element model of the bridge with a consis-tent damping matrix definition and describing the friction behaviour of the isolators with a viscoplastic model by Con-stantinou et al. [23]. The outcomes point out the feasibility and efficiency of the retrofit solution adopted and the effect of the FPD modelling parameters on the seismic response of the retrofitted bridge is discussed.
2. Bridge Geometry and Mechanical Properties
The case study consists of an existing multispan prestressed concrete girder bridge, as already described in other papers of the authors in [19, 20] and here again presented for completeness. The bridge superstructure consists of three spans and two independent decks, respectively, composed of three prestressed concrete girders, with a V shape, joined by transverse beams as well as a 25 cm thick upper concrete continuous slab. The substructure columns directly support the deck girders, by means of different bearings types: fixed(F), unidirectional (UL/UT in 𝑋/𝑌 directions, resp.), and
multidirectional (M). The other structural elements of the bridge, such as the pier and abutment columns and the pile foundation with pile cap, were made of reinforced concrete,
with steel reinforcement of yield strength 𝑓𝑦 higher than
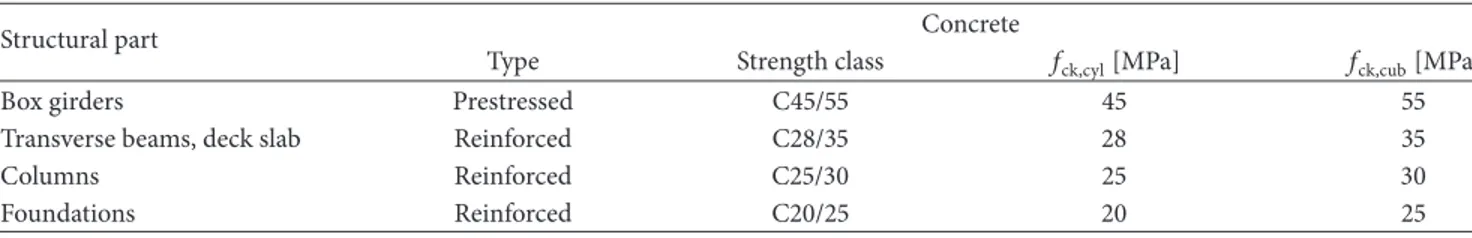
430 MPa (defined as FeB44k in previous Italian Code DM96 [24] and corresponding to ASTM A36 Standard [25]). All the types of concrete used for the bridge structural elements are presented in Table 1.
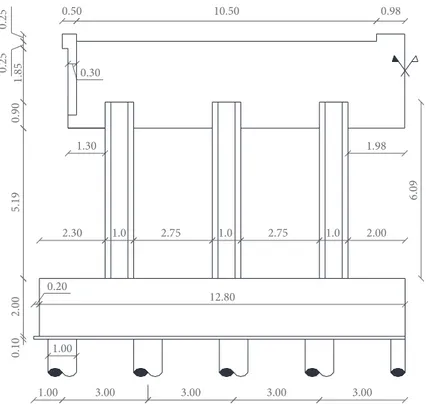
The geometrical layout of the bridge structural elements, as obtained by the original drawings is represented in Figures 1, 2, 3, and 4, where the plan view of the deck, the lateral views of the overall bridge structure, piers and abutments, and the cross section of the prestressed concrete girder bridge are shown. Observing the layout of the support bearings is possible to identify the lateral load path (Figure 5). In particular, the three columns of the abutment, to whose top the fixed bearing (F) and the two unidirectional transverse
Table 1: Class of concrete used for each structural part.
Structural part Concrete
Type Strength class 𝑓ck,cyl[MPa] 𝑓ck,cub[MPa]
Box girders Prestressed C45/55 45 55
Transverse beams, deck slab Reinforced C28/35 28 35
Columns Reinforced C25/30 25 30
Foundations Reinforced C20/25 20 25
34.20 25.00
L = 84.50
Figure 1: Lateral view of the overall bridge structure.
bearings (UT) are located, withstand the lateral loads along
the longitudinal𝑋 direction. On the other hand, along with
the transverse 𝑌 direction, the bridge behaves as a frame
loaded out of the plane. This is due to the unidirectional longitudinal bearings located at the top of all the central columns.
3. Seismic Risk Assessment
3.1. Material Properties. The seismic risk assessment of the
existing bridge and the evaluation of their potential structural weaknesses are required before considering any sort of seis-mic retrofit intervention. Consequently, the seisseis-mic vulnera-bility assessment of the case study bridge structure was devel-oped according to the current Italian Code provisions [2].
Regarding the material properties to be used in the seismic vulnerability assessment, given the high level of uncertainties, a higher safety level must be taken into account applying a Reduction Factor (RF = 1, 0.83, 0.74) to the mean value of the material properties. This factor is quantified as a function of the Knowledge Levels (KL3, KL2, and KL1), respectively, identified depending on the number of tests and inspections performed on the structure. In particular, for the existing bridges, the Italian Code requires that a high safety level has to be pursued, whereby the KL3 accurate knowledge has to be achieved. In this case, the geometry and the struc-tural details are known from the original outline construction drawings. The information on the mechanical properties of
the construction materials is known from original test reports carried out during the building stages. Consequently, the maximum level of knowledge which corresponds to a RF value equal to 1 can be considered. Finally, according to original calculation report, a type C soil, which refers to deep deposits of dense or medium dense sand, gravel, or stiff clay, with shear wave velocity ranged between 180 and 360 m/sec, was assumed.
3.2. Structural Model. The structural capacity of the existing
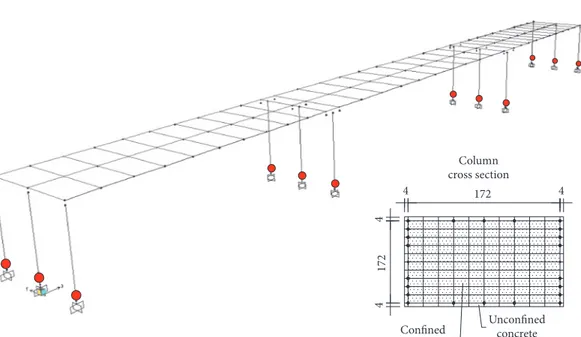
bridge was performed using pushover analysis developed on 3D elastic beam-column frame elements with lumped plastic hinges fiber model implemented in SAP2000. In Figure 6, the 3D view of the structural model and the column base cross-section discretization are shown.
Regarding the superstructure, the prestressed V shape girders were modelled using three beam elements joined by shell elements outlining the upper concrete slab of the deck. The substructure columns of piers and abutments were modelled by beam-column elements, with lumped plastic hinges placed at base cross section of the columns.
The inelastic behaviour of these lumped plastic hinges, featured by a fiber discretization of the corresponding cross section (Fiber PMM), was defined starting from the materials stress-strain relationship (Figure 6). The stress-strain model, originally proposed by Mander et al. [26] as modified by Saatcioglu and Razvi [27], was used for the concrete, with a
1.00 2.75 1.00 2.75 1.00 9.10 0.20 3.75 3.75 1.00 1.00 1.00 0.10 1.80 6.83 0.50 0.50 10.50 0.50 1.80
Figure 2: Lateral view of the pier columns with cross-section of the deck.
1.00 1.00 3.00 3.00 3.00 3.00 0.10 2.00 5.19 0.90 1.85 0.25 0.25 0.50 10.50 0.98 1.30 1.98 2.30 2.75 2.00 12.80 0.20 0.30 6.09 1.0 2.75 1.0 1.0
17.10 24.00 0.80 3.40 0.80 1.60 1.80 1.60 12.00 12.00 0.80 4.00 0.80 3.15 3.75 3.75 2.25 2.25 3.75 3.75 3.05 0.80 3.00 3.00 3.00 3.00 3.00 3.00 3.00 3.00 0.80 1.45 9.10 1.45 1.45 9.10 1.45
Figure 4: Plan view of deck, columns cross-section, and foundations.
Multidirectional bearing (M) Fixed bearing (F)
Unidirectional longitudinal bearing (UL) Unidirectional transverse bearing (UT) UT Y X UT F UL M M UL M M UL M M UL M M UL M M
Figure 5: Plan layout of the bearings.
Unconfined concrete 172 4 4 172 4 4 Confined concrete Column cross section
to 20.68 MPa and to 2 ⋅ 10−3 for the unconfined case and
equal to 25.31 MPa and to3.96⋅10−3for the confined one. The
reinforcement steel bars were modelled with an elastoplastic relationship, characterized by an ultimate strain equal to 4% as suggested by Italian Code [2] for the existing structures.
Moreover, the plastic hinges length 𝐿𝑃 was conservatively
assumed equal to 0.1 times the distance𝐿𝑆 that is the ratio
between the bending moment and the shear of the cross-section at the column base, equal to the column height for a cantilever scheme. The inertial properties of the bridge deck were taken into account through the lumped mass method starting from the discretization of each box girder and span deck. No reduction factor was applied to the cross-section properties of the superstructure and substructure elements due to the anticipated cracking. In fact, the cracking in the box girder, due to the prestressing loads, is prevented, while the effect of the cracking in the column is implicitly taken into account through the inelastic response of the lumped plastic hinges with a fiber discretization of the cross section. The high stiffness of the foundation-soil complex allowed considering the base supports as fixed constraints since the footing flexibility contributes less than 20% to the pier displacement [28].
3.3. Structural Capacity Evaluation. The capacity curve,
which represents the relation between the base shear V and
the lateral displacement 𝛿TOP of the control node (usually
placed at deck midspan in the case of bridge), was carried out by means of the nonlinear static (pushover) analysis. The pushover analysis was performed in two principal directions
(longitudinal 𝑋 and transverse 𝑌). A time-independent
lateral force profile, corresponding to the fundamental mode, was adopted [29] since the participating mass ratio asso-ciated with the first mode in both principal directions is close to 90%. In particular, the first modal shape along the longitudinal and transverse directions are characterized by a period value equal to 0.687 s and 0.403 s, respectively, with corresponding values of the participating mass ratios equal to 90.2% and 92.1%. Further details of the dynamical properties of the existing bridges for the other degrees of freedom are reported in [19].
The capacity curve (CC) represents the key issue in the assessment of the structural capacity expressed in terms of global lateral displacement associated with a given Limit State. In particular, the Italian Code [2] suggests that, for existing bridges, the seismic risk assessment has to be fulfilled only for the two Ultimate Limit States: Life Safety (LS) and Collapse Prevention (CP). Consequently, starting from the
definition of the yield curvature𝜑𝑦and ultimate curvature𝜑𝑢,
evaluated by idealizing the moment-curvature relationship of the cross section at column base, the ultimate chord rotation
capacity𝜃𝑢(𝑃) for a different level of axial force 𝑃 can be
evaluated as the sum of the yield rotation𝜃𝑦(𝑃) and the plastic
rotation capacity𝜃𝑝𝑢(𝑃) expressed as follows:
𝜃𝑦(𝑃) = 𝜑𝑦(𝑃) ⋅ 𝐿𝑆
3 ,
𝜃𝑝𝑢(𝑃) = [𝜑𝑢(𝑃) − 𝜑𝑦(𝑃)] ⋅ 𝐿𝑃⋅ (1 −0.5𝐿𝑃
𝐿𝑆 ) .
(1)
The bridge structural capacity to the CP Limit State, in terms of global lateral displacement, as marked with the dark square on the capacity curve of Figure 7(a), corresponds to the attainment of the shear capacity or bending capacity in the columns. In particular, aiming to the definition of their chord rotation capacity, the target value of ultimate
curvature 𝜃𝑢 was detected as the minimum between the
values corresponding to the achievement of (a) the maximum allowable strain for the materials; (b) the bending moment equal to the 85% of its maximum value. The chord rotation capacity associated with the CP Limit State is
𝜃CP=
𝜃𝑢(𝑃)
𝛾𝑒𝑙 , (2)
where𝛾𝑒𝑙is a safety factor equal to 1.5, while the chord
rota-tion capacity𝜃LSassociated to the LS Limit State was assumed
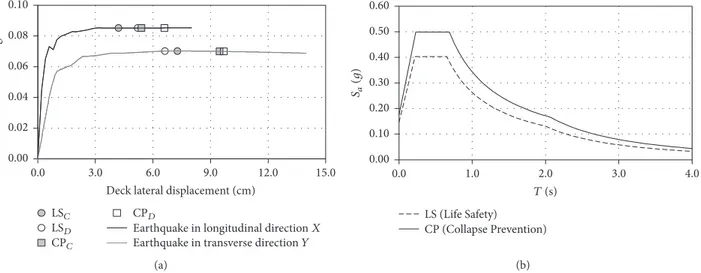
to be equal to 0.75 times the value calculated for the CP Limit State. In Figure 7(a), the capacity curves of the existing bridge developed for the two principal directions are shown. The symmetric spatial distribution of stiffness and strength in both the longitudinal and transverse direction permitted to perform a single pushover analysis for each direction.
3.4. Seismic Performance Assessment. The values of the peak
ground acceleration (PGA𝐶LS; PGA𝐶CP) representing the
capacity of the structure for each Limit State were obtained through an incremental noniterative procedure based on the comparison between the structural capacity and the seis-mic demand, in acceleration-displacement response spectra (ADRS) format. The comparison was carried out using the Capacity Spectrum Method, based on the inelastic demand spectra, originally proposed by Fajfar [21] and then imple-mented in the procedure reported in Annex B of EC8 as well as in the Italian Code. Starting from the pushover curve, the Capacity Spectrum in ADRS format is obtained by means of the following equations:
𝑆𝑎= 𝑉
𝛼1⋅ 𝑊𝑏;
𝑆𝑑= 𝛿TOP
Γ1⋅ 𝛿𝐷,
(3)
where𝑊𝑏is the seismic weight of the bridge,𝛼1is the mass
ratio,Γ1is the participation factor, and𝛿𝐷 is the maximum
first mode deck displacement. The Capacity Spectrum CS is then approximated with an elastic-perfect-plastic equivalent model (Bilinear Capacity Spectra—BCS) where the elastic stiffness is characterized from the passage for the point of the
CS correspondent to 70% of the yielding acceleration𝑆𝑎𝑦. The
seismic demand is represented through Inelastic Demand Response Spectra (IDRS) that are indirectly computed scaling the 5% Damped Elastic Demand Response Spectra (EDRS)
3.0 6.0 9.0 12.0 15.0 0.0
Deck lateral displacement (cm) 0.00 0.02 0.04 0.06 0.08 0.10 B as e she ar/t o tal w eig h t ,3C ,3D #0C
Earthquake in longitudinal direction X Earthquake in transverse direction Y
#0D (a) LS (Life Safety) CP (Collapse Prevention) 0.00 0.10 0.20 0.30 0.40 0.50 0.60 Sa (g ) 1.0 2.0 3.0 4.0 0.0 T (s) (b)
Figure 7: (a) Capacity curves of the existing bridge. (b) Elastic demand response spectra, in terms of acceleration for the LS and CP Limit States defined for the site considered.
relations available in literature for the strength reduction factor proposed by Vidic et al. [30] as follows:
𝑅𝜇= (𝜇 − 1) 𝑇𝑇
0 + 1 for 𝑇 ≤ 𝑇0;
𝑅𝜇= 𝜇 for 𝑇 > 𝑇0
with𝑇0= 0.65 ⋅ 𝜇0.3⋅ 𝑇𝑐≤ 𝑇𝑐.
(4)
In particular, the seismic demand is provided by means of the elastic response spectrum for the horizontal component of the seismic action whose diagram and characteristic parameters are shown in Figure 7(b) and Table 2 respectively.
The inelastic pseudo-acceleration 𝑆𝑎 and displacement 𝑆𝑑
which represents the coordinates of the IDRS in ADRS format
are then derived from the coordinates[𝑆𝑑𝑒; 𝑆𝑎𝑒] of the EDRS,
as follows: 𝑆𝑎 =𝑆𝑎𝑒 𝑅𝜇; 𝑆𝑑=𝜇 ⋅ 𝑆𝑑𝑒 𝑅𝜇 . (5)
The reduction factor 𝑅𝜇 depends on the ductility 𝜇 and,
therefore, on the lateral displacement of the equivalent SDOF system. Consequently, an iterative graphic procedure is usually required to obtain the intersection between demand (IDRS) and capacity (BCS).
In this case, starting from the target displacements values
𝑑𝐶
LSand𝑑𝐶CPcorresponding to the LS and CP Limit States,
respectively, the relations between the MDOF system and SDOF equivalent system (see (3)) can be used to corre-late the various performance levels with the values of the
lateral displacement of the equivalent SDOF system 𝑆𝑑,PP.
Consequently, it is immediate to characterize the position of the performance point (PP) on the BCS, in the ADRS format, corresponding to the reach of each performance
Table 2: Parameters of the elastic response spectra, in terms of acceleration for the LS and CP Limit States.
Parameter LS CP
Probability of exceedance𝑃VR 0.10 0.05
Return period𝑇𝑅(years) 712 1462
Peak ground acceleration𝑎𝑔/𝑔 0.147 0.176
Dynamic amplification factor𝐹0 2.741 2.830
Transition period𝑇𝐶(sec) 0.651 0.687
level. This greatly simplifies the estimation of the intensity levels of the earthquake ground motion corresponding to the various performance levels. In fact, the position of the PP
gives the ductility reduction factor𝑅𝜇without any iterative
procedure. Thus, the problem in convergence and accuracy of the iterative graphical procedures based on the Capacity Spectrum Method may be avoided. For each performance
level, the corresponding value of PGA𝐶 may be calculated
with an incremental but noniterative procedure. In fact, the performance point, PP, is fixed, and the earthquake intensity level (PGA) is increased until the IDRS intersects the BCS in PP corresponding to the achievement of its performance level. The outcomes carried out applying this NSP procedure, reported in Tables 3 and 4, consist in the evaluation of the capacity of the existing bridge to resist seismic actions in terms of peak ground acceleration PGA values corresponding
to the Ultimate Limit States of the structure (PGA𝐶LS;
PGA𝐶CP). On the other hand, the PGA values required for
the LS and CP Limit States (PGA𝐷LS; PGA𝐷CP) correspond to
the seismic demand for a return period of 712 years and 1462 years, respectively. Consequently, the seismic risk indices are defined by the capacity/demand ratios as
𝛼LS= PGA𝐶LS PGA𝐷LS; 𝛼CP= PGA𝐶CP PGA𝐷CP. (6)
T a b le 3: N on li n ear st at ic pro ce d u re p ar am et er s an d re su lt s. E q ui valen t SD O F pa ra met er s fo r C ap aci ty Sp ec tr um defini ti o n B CS Y ield P o in t R ed uc ti o n fac to r pa ra met er s P er fo rma nce p o in t 𝑊𝑏 [kN] 𝛼1 Γ1 𝛿𝐷 𝑇eq 𝑆𝑑𝑦 [mm] 𝑆𝑎𝑦 /𝑔 𝜇 𝑇0 𝑅𝜇 𝑆𝑑,PP [mm] 𝑆𝑎,PP /𝑔 Pusho ver 𝑋 17 945 0.9 2 39 .0 0.0 27 0.4 03 6.5 6 0.08 9 LS 6.18 0.7 71 3.7 1 4 0.5 0.08 9 CP 7.94 0.8 31 4.3 6 52.1 0.08 9 Pusho ver 𝑌 17 945 0.9 0 39 .0 0.0 29 0.6 0 9 11.5 4 0.07 6 LS 5.7 5 0.7 4 8 4.7 3 6 4.3 0.07 6 CP 7.26 0.80 9 5.7 1 83.8 0.07 6
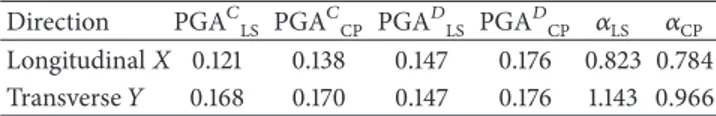
Table 4: Capacity and demand peak ground acceleration and corresponding risk index.
Direction PGA𝐶LS PGA𝐶CP PGA𝐷LS PGA𝐷CP 𝛼LS 𝛼CP
Longitudinal𝑋 0.121 0.138 0.147 0.176 0.823 0.784
Transverse𝑌 0.168 0.170 0.147 0.176 1.143 0.966
The values of the seismic risk index evaluated for the Life Safety and the Collapse Prevention Limit States along the longitudinal and transverse directions are also listed in Table 4. A value of the capacity/demand ratio greater than one points out that the bridge in existing state fulfills the seismic performance required for a given Limit State. The condition for which the verification is fulfilled occurs only for the case of the LS Limit State and seismic loads acting along the transverse direction. The other capacity/demand ratios for the LS Limit State along the longitudinal direction as well as for the CP Limit State along the two principal directions are less than one. These outcomes point out the poor lateral displacement capacity and limited global ductility of the existing bridge if compared to the new “seismic demand” levels required by the code provisions. These results are mainly due to the low chord rotation capacity of the plastic hinges located at base cross section of the columns.
4. Seismic Retrofit
4.1. Intervention Strategy. As an alternative to the use of some
traditional intervention approaches, the improvement of the seismic performance of the existing bridge was developed through a retrofit strategy based on seismic isolation and sup-plemental energy dissipation. To this aim, the use of friction pendulum devices (FPD) placed between the piers top and the deck was developed. This strategy is highly convenient from an economic point of view if compared to those of a maintenance intervention for the replacement of the bearing devices. In fact, if the seismic isolation has a high typically premium due to the high cost of the bearing devices and con-struction of additional elements required for the connection between the bridge deck and substructure, it presents eco-nomic benefits due to the reduction of postearthquake repair costs.
4.2. Friction Pendulum Devices. Seismic isolation represents
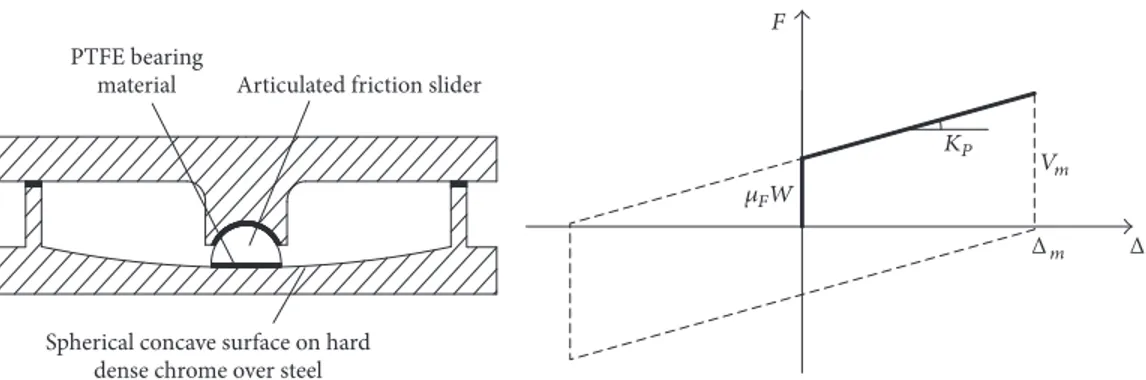
a useful tool for the earthquake resistant design of bridges that can be used in both new constructions and retrofits [6, 15, 17, 19, 20, 31]. The friction pendulum device (FPD) [32] is seismic isolation bearing, with a mechanism based on its concave geometry and surface friction properties (Figure 8) [33]. The supporting structure is governed by a pendulum motion as the housing plate simultaneously slides on the concave spher-ical surface and dissipates hysteretic energy via friction [34]. For a single concave isolator pendulum with a radius
of curvature𝑅𝐶 and weight𝑊, the following relations can
express the period of vibration𝑇𝑃after the activation of FPD
isolator and the associated stiffness𝐾𝑃:
𝑇𝑃= 2𝜋√𝑅𝑔𝐶;
𝐾𝑃= 𝑅𝑊
𝐶,
(7)
where 𝑔 is the gravity acceleration. Therefore, the
force-displacement diagram of a FPD isolator is nearly rigid due to stick-slip behaviour, for lateral loads lower than the resisting
friction force𝑉𝑓 and proportional to 𝐾𝑃 for higher loads
(Figure 8). In particular,𝑉𝑓expresses the intersection of the
curve with the𝑌-axis (corresponding to zero displacement)
and is calculated as the product of the friction coefficient𝜇𝐹
times the supported load𝑊:
𝑉𝑓= 𝜇𝐹𝑊. (8)
The fundamental design parameters of a FPD device are the material friction coefficient and the radius of curvature. Noticeably, there is little control of the friction coefficient, which can typically range between 0.02 and 0.11 depending on the material properties used for the construction of the sliding surfaces, the changes with contact pressure, sliding velocity, air temperature, and so on [35].
The radius of curvature in principle is free of restriction parameter. Nevertheless, its value is only limited by the condition to have not a much larger value of the structural vibration period which is related to a very low lateral stiffness of the isolated structure and/or potential maximum residual displacement. Moreover, regarding the displacement capacity
Δ𝑚 of the FPD isolator, there is no theoretical restriction
except for the inherent limits on the uplift. Subsequently, the energy dissipation property of the FPD devices may be assessed by evaluating the equivalent viscous damping ratio
𝜉FPstarting from the area of a full hysteresis loop𝐴ℎ:
𝐴ℎ= 4𝜇𝐹𝑊Δ𝑚. (9)
Whereas the maximum lateral force𝑉𝑚is equal to
𝑉𝑚 = 𝑊 (𝜇𝐹+Δ𝑚
𝑅𝐶) (10)
the𝜉FPvalue can be estimated as follows:
𝜉FP=
2𝜇𝐹
𝜋 (𝜇𝐹+ Δ𝑚/𝑅𝐶). (11)
As mentioned above, the behaviour of the FPD is strongly nonlinear and involves the coupling of multiple components of the dynamic response, posing challenges for those attempt-ing to model their response. The main modellattempt-ing aspects
of the response of the FPD are(1) the normal force (𝑊);
(2) the coefficient of friction (𝜇); (3) the in-plane
bidirec-tional sliding interaction; and(4) large deformation effects
(𝑃-Δ). The response of the FPD is typically modelled by a simplified bilinear force-deformation relationship. Ample theoretical and experimental research findings are available in the current literature, separately representing each of these modelling aspects.
Experiments have shown that axial load fluctuations were consequential in the response of individual isolators incorpo-rating a sliding mechanism [36, 37]. Dicleli showed that vary-ing dead loads on the FPD along a seismically isolated bridge,
Spherical concave surface on hard dense chrome over steel PTFE bearing
material Articulated friction slider
Δ Vm Δm KP FW F
Figure 8: Scheme and hysteresis loop of a FPD isolator.
due to a different tributary weight on abutments and piers, might lead to a nonuniform transverse response that could result in excessive displacements [38]. Jangid performed a parametric study on a Seismic Isolation Bridge and showed that the friction coefficient of the bearings is influential in optimizing the seismic response of the bridge [39].
In particular, the coefficient of friction 𝜇, in addition
to the material properties of the surface, were found to be
primarily a function of the slider velocityV and axial force 𝑁
[40]. Accurate mathematical models have been developed by
Constantinou et al. [41] to capture the value of𝜇 for a range of
V that is of interest to the response of the FPD. The influence
ofV on 𝜇𝐹was approximated via the aid of the experimental
results as follows:
𝜇𝐹= 𝜇fast− (𝜇fast− 𝜇slow) 𝑒−𝑟V, (12)
where𝜇fastand𝜇sloware the values of the friction coefficient
at large and small sliding velocities, respectively, and𝑟 is a
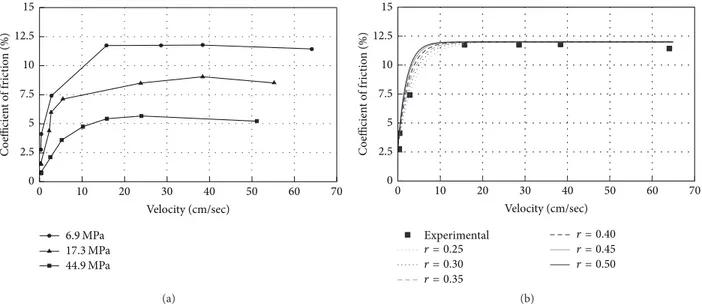
rate parameter, having units of time per unit length, that controls the variation of the coefficient of friction with velocity (Figure 9). The parameters used in defining (12) are mainly functions of surface properties and contact pressure. Sample values may be found elsewhere [42, 43].
The comparison between the experimental and numerical results relating to the values of the friction coefficient
depend-ing on different axial stress levels and the rate parameter𝑟
variation are shown in Figures 9(a) and 9(b), respectively. Moreover, Warn and Whittaker [44] showed that neglecting the bidirectional coupling of the isolation bearing models in bridges resulted in discrepancies in the force-deformation histories and underestimation of displacements of the bear-ings. Almazan and De la Llera [45] showed that the exact
kinematics and 𝑃-Δ moments might be considerable in
estimating the peak bending moments of the columns in seismically isolated bridges. The authors highlighted that the upward or downward positioning of the FPD can be used to
control the flow of the𝑃-Δ moments.
It is, therefore, clear that to properly assess the seismic response of bridge structures isolated with friction pendulum device; it is necessary to take into account all of the modelling aspects mentioned.
4.3. Bridge Retrofit Design Process. For the case study of
existing bridge, a seismic retrofit strategy based on the use
of an isolating system located between the columns top and the deck was implemented through the placement of a FPD single concave isolator in place of the existing support bearings (18 devices). Moreover, the application of a seismic isolation strategy permits controlling the seismic response of the substructure elements without increasing their lateral strength and stiffness [46]. The design of the FPD isolators was performed by means of a multiobjective approach in order to meet the performance levels provided for different operating conditions of the bridge. In particular, the first design objective was to avoid the deck displacements under the lateral actions due to wind loads and braking forces defined according to the Serviceability Limit State SLS level. On the other hand, the second design objective was to ensure that the seismic response of the columns of the piers and abut-ments kept within linear elastic range when the deck achieved the maximum lateral displacement demand provided by the seismic code for the Ultimate Limit State SLU level.
The first design level allows designing the minimum value
of the static friction coefficient 𝜇stat required to avoid the
lateral displacement of the deck under the effect of the low-level horizontal loads. This objective is pursued by verifying the following condition:
𝜇stat⋅ 𝑊tot≥ 𝐹𝑏→ 𝜇stat≥ 0.03, (13)
for which the design target is reached if the sum of the
friction forces of all the devices (𝑊tot= 14629 kN), calculated
when the minimum axial load acts on each device, exceeds
the maximum value of the horizontal forces 𝐹𝑏 due to
longitudinal braking and acceleration effect of the vehicles acting at the surfacing level of the carriageway equal to 442 kN.
The second design level was performed through a design process consisting of an application of a Direct Displacement-Based Design (DDBD) approach as well as the hierarchy of strength considerations to define first the displacement
capacityΔ𝑚and then the radius of curvature𝑅𝐶of the
isola-tors. It is well known that the DDBD approach aims to design a structure to achieve a predefined level of lateral deformation under a target level of earthquake intensity [14]. More-over, the application of the displacement-based concepts for assessment and evaluation of existing structures is more straightforward since the characteristics of the structure, such as material properties and elements geometry, are known.
6.9 MPa 17.3 MPa 44.9 MPa 0 2.5 5 7.5 10 12.5 15 C o efficien t o f f ric tio n (%) 0 10 20 30 40 50 60 70 Velocity (cm/sec) (a) Experimental r = 0.30 r = 0.25 r = 0.35 r = 0.50 r = 0.45 r = 0.40 0 5 2.5 7.5 10 12.5 15 C o efficien t o f f ric tio n (%) 0 10 20 30 40 50 60 70 Velocity (cm/sec) (b)
Figure 9: Dependency of the coefficient of friction on sliding velocity: (a) experimental data for different axial stress levels (Mokha et al.
1990); (b) effect of the rate parameter𝑟 variation.
Assuming that the higher modes effects on the columns are negligible, bridge structure can be assumed as a SDOF system characterized by a force-displacement diagram similar to that of the FPD isolator. This last condition, which occurs for bridges with stiff substructures when the columns have the same flexibility, was preliminarily verified comparing the final value of the lateral stiffness of the designed isolation sys-tem with the corresponding one of the substructure elements [28–47]. Therefore, according to the DDBD principles, for the subsequent evaluation of the radius of curvature value, a trial value of the displacement design for the isolation system
Δ𝑚was considered. This value corresponds to the maximum
seismic displacement demand𝑆𝑑(𝑇𝐷; 𝜉iso) for the site under
consideration (referring to an overall system damping value
𝜉iso) amplified by a safety margin factor 𝛾ov equal to 1.4
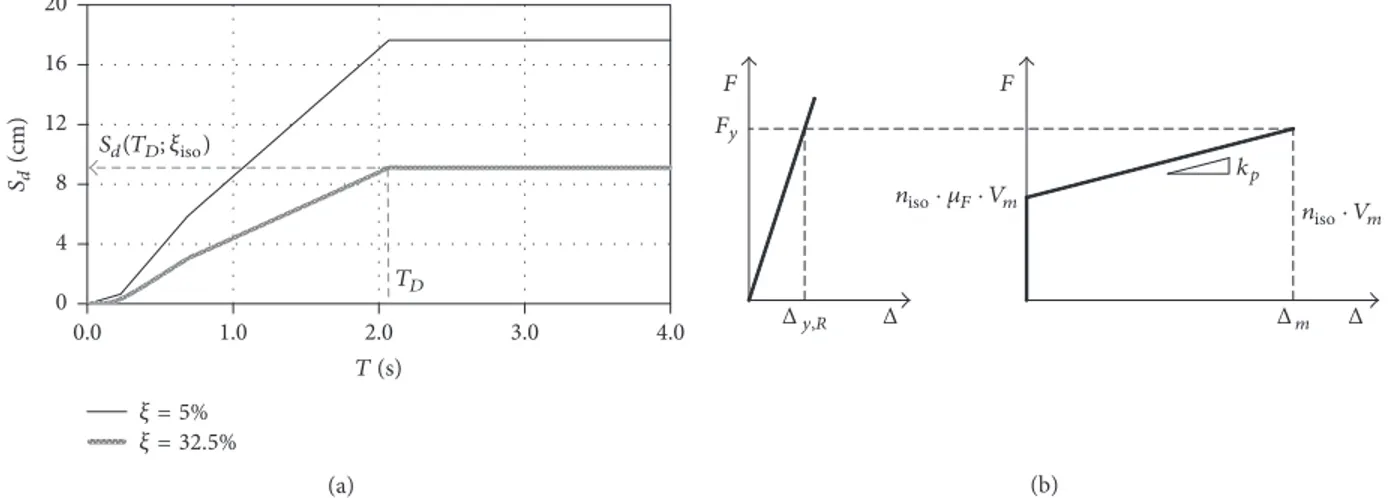
(Figure 10(a)). This last choice is due by numerous simplifying assumptions adopted for this phase of dimensioning [14].
The value of 𝑆𝑑(𝑇𝐷; 𝜉iso) was estimated from the elastic
displacement response spectrum for periods greater than or
equal to 𝑇𝐷 (corner period). In particular, a trial value of
the damping ratio of the isolation system equal to 5% was assumed in the first step of the design iterative process.
The use of constant displacement spectrum at periods equal to or greater than 2.0 sec is conservative for the bridge site. In fact, according to the relations proposed by Faccioli et al. [48], if the expected earthquake moment magnitude equal
to 7 involves a𝑇𝐷value greater than 2 sec the corresponding
peak response displacement, due to the epicentral distance (ranged in 60–100 km), is less than the value defined by the Code.
It should therefore be ensured, according to capacity design principles, (a) first that the displacement capacity of the isolators is greater than the corresponding seismic demand and, (b) secondly, that the lateral load applied to the existing columns in correspondence of the design
displacementΔ𝑚 of FPD isolator induces internal forces at
the base cross-section of the column lower than their flexural and shear strengths. Thus, considering that, for structural
periods greater than𝑇𝐷, the displacement demand is constant
and equal to the maximum value, this latter value was assumed as a design parameter.
Starting from the evaluation of the flexural strength𝑀𝑅𝑑
value of the cross section at the base of the central column of the pier (equal to 2119 kNm), the design maximum value of
the lateral force𝑉𝑚to consider for a couple of FPD isolators
located at the pier top was calculated, also accounting for the second order effects, as follows:
2𝑉𝑚= (𝑀𝑅𝑑− 2𝑊Δℎ 𝑚)
𝑃 , (14)
where𝑊 is the maximum axial load acting on each device
(996 kN) andℎ𝑃is the pier column height. Therefore, it is
possible to calculate the device stiffness𝐾𝑃(Figure 10(b)),
𝐾𝑃= (𝑉𝑚Δ− 𝑉𝑓)
𝑚 ,
(15) thus, inverting the second relation of (7), to define the
design value of the radius of curvature 𝑅𝐶. According to
(11), the equivalent viscous damping of the FPD is mutually related to the design displacement and lateral stiffness (hence radius of curvature) of the isolation systems. Consequently, the curvature radius of the FPD is derived iteratively from the spectrum analyses, changing step-by-step the equivalent
viscous damping𝜉isoof the isolation system, having assumed
for the FPD isolators, a friction coefficient as a mean value for all the devices over the entire bridge. At the final step of the
procedure, an optimal device with𝑅𝐶value of 1.90 m and𝜉iso
value of 32.5% with a maximum displacement demand equal to 128 mm was carried out.
The dimensioning of the circular contact section placed between the articulated friction slider and the concave
1.0 2.0 3.0 4.0 0.0 T (s) 0 4 8 12 16 20 Sd (cm) Sd(TD; CMI) TD = 5% = 32.5% (a) F F Fy Δy,R Δ Δm Δ kp nCMI· Vm nCMI· F· Vm (b)
Figure 10: (a) Design displacement spectra; (b) force-displacement diagram of the pier column and of the FPD isolator.
surface of the FPD was also carried out. In particular,
considering the maximum axial load𝑊 value, introduced
above and adopting a maximum value for the contact stress of 44.9 MPa according to the experimental results of Figure 9(a)
[40], a minimum radius dimension for the slider𝑅sl equal
to 85 mm was evaluated. This choice allows achieving the
highest value of the friction coefficient at large speeds𝜇fast
equal to 6% and 8% for internal and external FPD isolators, respectively. Moreover, according to Mokha et al. [40], a value of 2% was assumed as the friction coefficient at nearly zero
velocity𝜇slow.
In order to define a more practical consequence of this design process, as a final step, the selection of a FPD isolator among a number of available standard devices, whose characteristics are as much as possible similar to those of the optimal device, was performed. The mechanical properties of both the optimal and standard FPD isolators, as subsequently considered in the analyses, are shown in Table 5. This choice was made in order to compare the results carried out for the seismic response of the isolated bridge adopting the standard device to those obtained considering the FPD optimal solution.
5. Seismic Bridge Response and
Structural Evaluation
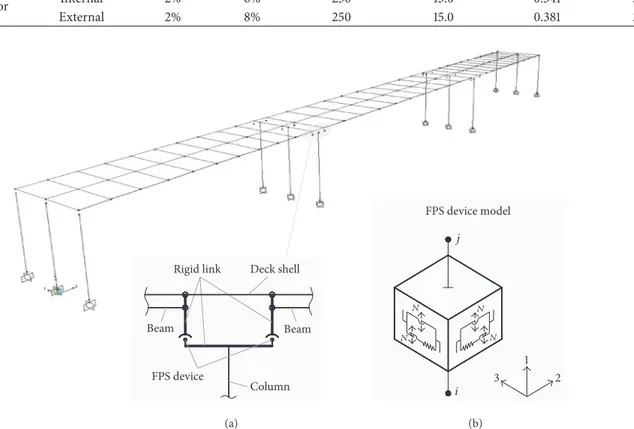
The seismic response assessment of the retrofitted bridge was developed by means of nonlinear response history anal-ysis (NRHA) performed on a structural 3D beam-column frame elements model with FPD isolators, implemented in SAP2000, through a direct integration of the equations of motion technique of the overall isolated system. The geometry and modelling approach of this Seismically Isolated Bridge, where the isolation system is achieved by placing a single FPD concave isolator in correspondence of each original bearing, are illustrated in Figure 11(a). In particular, the superstructure elements are expected to remain within their linear elastic range. Thus, the deck elements (box girder and slab) are modelled using elastic beam column and shell elements. The deck element discretization allows implicitly
including the translational and rotational mass of the deck in the model, whereas the FPD isolators are designed to ensure an elastic response for the substructure elements. Therefore the columns of the pier and abutments are modelled using elastic beam-column elements. The nonlinear hysteretic behaviour for the FPD devices was described by a biaxial friction pendulum model depicted in Figure 11(b) (Nonlinear Link named “Friction Isolator”). The model is based on the hysteretic behaviour proposed by Wen [49], Park et al. [50] and recommended for base-isolation analysis by Nagarajaian et al. [51]. The modelling aspects of the FPD device are dealt with, along with the essential physical phenomenon involved in the response. In fact, the influence of the variations in
axial load𝑊 and friction coefficient 𝜇, in-plane bidirectional
sliding interaction, and the orientation of the FPD are taken into account. Rigid elements provide the connection between the FPD device and deck elements (slab and box girders) and columns, respectively. The existing joints placed at the bridge ends must be replaced by new seismic joints with an adequate width so as to avoid the pounding between the deck and abutment wall due to the maximum isolator displacement.
Generally, a bridge structure with an isolation system can be considered as a structural system consisting of a substructure (the columns) and a superstructure (the deck) connected by the seismic isolators. There is a significant difference in damping of the two subsystems and isolation system, which makes the system nonclassically damped. This will lead to the coupling of the motion equations, with an analysis of the system through a complex model analysis being required [52]. Consequently, the damping matrix of the overall seismic isolated bridge can be evaluated through the damping features of each subsystem and then taking into account the effects due to their coupling [53, 54]. In particular, the complete damping matrix of the seismically
isolated bridge [𝐶iso] can be expressed as follows:
[𝐶iso] = [[ [ [𝐶sub] + [𝐶𝑜] [𝐶𝑠𝑝]𝑇 [𝐶𝑠𝑝] [𝐶deck] ] ] ] . (16)
Table 5: Mechanical properties of FPD optimal and standard isolators.
Type Position 𝜇slow 𝜇fast 𝑅𝐶[cm] Δ𝑚[cm] 𝜉FP[Δ𝑚] 𝑇𝑃[s]
Optimal Isolator Internal 2% 6% 190 12.8 0.297 2.76
External 2% 8% 190 12.8 0.361 2.76
Standard isolator Internal 2% 6% 250 15.0 0.341 3.17
External 2% 8% 250 15.0 0.381 3.17 FPS device Column Rigid link Beam Beam Deck shell N N N N i j 1 2 3 FPS device model (a) (b)
Figure 11: (a) FEM model of the seismic isolated bridge; (b) local modelling of a FPD isolator.
Whereas the superstructure consists of a rigid deck, the
related damping matrix [𝐶deck] can be directly taken into
account by means of the hysteretic response of the FPD
isolators. The substructure damping characteristics [𝐶sub]
can be considered by including in the model viscous dampers placed between the top of the columns (abutments or piers)
and a fixed external support along the two main directions𝑋
and𝑌. It is well known that different values of the damping
can strongly affect the dynamic response [55–59]. Thus, the
evaluation of the corresponding damping constants 𝑐A/P is
carried out assuming that the columns behave like SDOF systems along each principal direction:
𝑐A/P= 2𝜉√𝑘A/P⋅ 𝑀A/P, (17)
where𝜉 is the structural damping ratio of the single column,
assumed equal to 3%, while𝑀A/Pand𝑘A/Prepresent the
trib-utary mass and lateral stiffness of the column (of abutment A or pier P) in the considered direction, respectively. Con-sequently, the eight damping constants reported in Table 6 were calculated, two for each type of column (abutment or
pier) depending on the load directions considered (along𝑋
and𝑌) and on the column position (internal and external).
The definition of all these damping characteristics also allows
implicitly taking into account the effects of the coupled terms
of the complete damping matrix [𝐶iso]. In particular, the
coupling terms consist of the matrix [𝐶0], that is, the diagonal
matrix, representing the increment of dissipation of the sub-structure elements due to the presence of an isolator device
on the top of each column, and the coupling matrix [𝐶𝑠𝑝] that
expresses the coupling between the two substructures. The seismic response assessment of the isolated bridge was then developed, starting from the outcomes of the NRHA carried out using seven recorded accelerograms of significant historical earthquakes (Table 7). These seismic inputs were selected following the requirement that the spectral displace-ments in the range 2–6 sec are consistent with the ones of the design displacement spectrum (Figure 12). Their horizontal and vertical components were scaled to a peak ground acceleration values equal to 0.176 g and 0.054 g, respectively, corresponding to the CP Limit State design as suggested by the code provisions for the site under consideration. The scaling of the signals was done varying only the amplitude and leaving the same frequency content (i.e., the same shape of the response spectrum).
5.1. Effects of the FPD Modelling Parameters. To examine the
Table 6: Values of the damping constants of the substructure elements.
Direction 𝑐A,int[kN⋅s/m] 𝑐A,ext[kN⋅s/m] 𝑐P,int[kN⋅s/m] 𝑐P,ext[kN⋅s/m]
Longitudinal𝑋 215.94 179.95 223.68 186.40
Transverse𝑌 120.84 100.70 125.22 104.35
Table 7: Earthquake ground motion parameters.
Number Earthquake record Id. station Date Component PGA [g] 𝑀𝑤 𝑇𝑅[s] 𝐼𝐴[m/s]
Long. Trans. Vert.
(1) Christchurch RHSC 21/02/11 0.290 0.250 0.195 57 57 1.115
(2) Off Noto P. ISK006 25/03/07 0.866 0.732 0.462 75 75 9.061
(3) South Iceland 306 21/06/00 0.109 0.091 0.063 40 40 0.067
(4) Kagoshima KGS004 26/03/97 0.134 0.299 0.098 70 70 1.011
(5) Northridge 24087 17/01/94 0.344 0.308 0.552 60 60 1.469
(6) Loma Prieta 57007 18/10/89 0.479 0.630 0.439 40 40 3.175
(7) Irpinia Calitri 23/11/80 0.175 0.158 0.166 86 86 1.364
Table 8: Summary of seismic isolated bridge model parameters.
Model Vertical component Coefficient of friction variability Rate coefficient[s/m]
(1)a (2)a ∙ (3)b ∙ ∙ 30 (4)b ∙ ∙ 20 (5)b ∙ ∙ 50 a𝜇
slow=𝜇fast= 3%;b𝜇slow= 2% 𝜇fast,int= 6% 𝜇fast,ext= 8%.
Christchurch Off Noto South Iceland Kagoshima Northridge Loma Prieta Irpinia NTC 2008 1 2 3 4 5 6 0 T (s) 0 0.05 0.1 0.15 0.2 0.25 Sd (m)
Figure 12: Ground motion displacement response spectra compar-ing with the Italian Code (NTC2008) elastic response spectrum.
the seismic response of the retrofitted bridge, the five seismic isolated bridges models indicated in Table 8 are considered. All the models account for the bidirectional coupling of
the sliding forces, incorporating the 𝑃-Δ moments and
considering the friction coefficient at low sliding velocity
𝜇slow equal to 0.02. The comparison between the seismic
performances of the retrofitted bridge isolated by means of the optimal and standard FPD isolators were also carried out.
The effects of the modelling parameters on the seismic response of the retrofitted bridge were evaluated through the results of nonlinear response history analyses (NRHA) carried out using the recorded accelerogram of Irpinia. These results, expressed in terms of the maximum value of the lateral displacement and axial force of the isolators placed at the top of the pier external columns and bending moment about a weak axis and shear in the transverse direction for the cross section at the base of the corresponding column, are compared in Table 9.
In particular, in model 1, the value of axial force on the FPD is taken as the corresponding constant value after the gravity load analysis and includes the effect of the horizontal components of the earthquake ground motion, while, in model 2, the effect of the vertical component is explicitly taken into account. In particular, for these two models, a constant value of the friction coefficient at slow and large sliding velocity equal to 0.03 for the devices is assumed. The comparison between the results, carried out through models 1 and 2, shows how the vertical component of the earthquake ground motion has a negligible effect on the lateral displacement peak value of the FPD seismic isolators as well as on the bending moment and shear at base of
T able 9: M axim um va lues o ft h e Seismic Is o la ted B ridg e resp o n se p ara m et er s: de vice la tera ldisp lacemen ts, de vice axia lf o rce ,b endin g m o m en t ab o u tw eak ax es, and she ar at b as e o fe xt er na l p ier co lumn s. M o del Op timal FPD de vice (𝑅𝐶 = 1.9 m) St an da rd FPD de vice (𝑅𝐶 =2 .5 m ) L at eral d isp lacemen t A xi al forc e B en d in g m om en t Sh ear L at era ld isp lacemen t A xi al F orc e B en d in g m om en t Sh ear Ra d ia l A n gl e Ra d ia l A n gl e [cm] [deg] [kN] [kN m] [kN] [cm] [deg] [kN] [kN m] [kN] (1) a 3% 10.4 0 97 .95 10 9 0 1013 116 10.0 3 95.6 6 1088 92 3 10 3 (2) a 3% 10.9 0 98.8 1 13 01 10 65 101 10.0 6 95.5 4 13 0 0 9 6 7 107 (3) b 9. 72 27 7. 20 1294 157 5 19 3 9.5 0 27 8.80 129 2 141 4 18 4 (4) b 9.07 27 6.6 5 12 83 15 6 7 188 9. 10 27 7. 6 6 12 83 13 83 18 2 (5) b 9.79 27 7.7 5 13 08 15 55 197 9.88 27 9.4 7 13 11 14 37 188 a𝜇 slo w = 𝜇fast =3 % ; b𝜇 slo w =2 % 𝜇fast ,in t =6 % 𝜇fast ,ext =8 % .
the external pier column. On the other hand, this vertical component of the seismic action leads to an increase of the peak value of the device axial force equal to 19%.
Model 3 is developed in order to evaluate the effect of the friction coefficient variation considering the rule of (12). In particular, a value of the friction coefficient at low sliding
velocity 𝜇slow equal to 0.02 and a maximum value of the
friction coefficient at large sliding velocity𝜇fastequal to 0.06
and 0.08 for internal and external devices, respectively, with
a rate parameter 𝑟 value equal to 30 were assumed. The
comparison between the results carried out through models 2 and 3, with the use of an optimal FPD device, shows how the effect of friction coefficient variation leads to a slight variation in the lateral displacement peak value equal to 10.8%, whereas there is a notable increase in the peak value of the bending moment and shear, respectively, equal to 47.9% and 91.1%. The effect of the friction coefficient variability was found with a similar trend for the response parameters of the substructure element of the seismic isolated bridge with the use of a standard FPD device, whereas the effects in terms of maximum device displacement are negligible.
Moreover, the effect of the rate parameter was evaluated comparing the results carried out with model 3 as well as those obtained with models 4 and 5, for which two extreme values of the rate parameter, respectively, equal to 20 and 50 were considered. In fact, a typical value for this parameter ranged between 20 and 30 s/cm for unfilled PTFE and up to 50 s/cm for composite PTFE [22]. This comparison shows how the effect of the rate parameter variation is negligible on the seismic response of the seismic isolated bridge for all the devices used.
As a result of all the comparison and sensitivity analyses, it follows that the vertical component of the earthquake ground motion and the variability of the friction coefficient should be taken into account in order to carry out an accurate seismic response assessment of the seismic isolated bridge with FPD isolators, while the rate parameter has only a slight and negligible impact on the response parameters. In particular, the effect of the axial load variability in the FPD isolator has been duly taken into account for the selection of the device bearing capacity and the relating value of the friction
coefficient at a high sliding velocity𝜇fast.
5.2. Structural Evaluation of Retrofitting Bridge. The seismic
response assessment of the Seismically Isolated Bridge and the verification of the preliminary seismic design process were finally performed using model 3 that considers the effect of the vertical component of earthquake ground motion, the variability of the coefficient of friction (between 0.02 and 0.06 for the devices placed on internal columns and between 0.02 and 0.08 for the devices placed on the external ones), adopting a value for the rate parameter equal to 30. In particular, the verification was carried out for the seismic isolated bridge where the optimal FPD isolators were used. The seismic isolated bridge model was analysed for gravity load and sequentially subjected to NRHA analyses using simultaneously the longitudinal, transverse, and vertical acceleration records of the given earthquake. In particular, the in-plane orthogonal components of the earthquake were
oriented along the transverse direction(𝑌) to result in the
maximum demands on the columns.
With reference to the FPD devices, the safety checks, developed by comparing the lateral displacement demand
with the corresponding displacement capacity (Δ𝑚 equal
to 12.8 cm), are always fulfilled. In particular, the seismic response of the isolators placed at the top of the external columns of the piers and of the internal column of the abut-ments, in terms of lateral displacement along the two main
directions𝑋 and 𝑌, are shown in Figures 13 and 14. The
fulfil-ment of these safety checks highlights that the energy dissipa-tion capacity of the FPD devices is sufficient to limit the seis-mic displacement demand and replace the need for additional energy dissipation devices. The time history hysteresis loops for the FPD isolators, placed at the top of the pier columns and of the abutment columns, as an effect of the Irpinia earth-quake along the transverse direction, are in good agreement with the theoretical ones constructed on the basis of (7) and
(10) using, respectively,𝜇fastvalues equal to 0.08 and 0.06 for
the friction coefficient at a high velocity (Figure 15).
The other safety checks were performed taking into account the maximum values of the internal forces calculated by means of the NRHA. In particular, in Figure 16, the inter-section domain between the conventional failure interaction surface of the axial force and the biaxial bending moments
𝑃-𝑀𝑥-𝑀𝑦with the plan of equation𝑃 = cost for the
cross-section at the base of the central columns of pier and external columns of the abutment are represented. The checkpoints refer to the maximum bending moment value calculated for each main direction and the corresponding value in orthogonal direction using all the sets of signals selected.
The safety checks are widely fulfilled, providing very sat-isfactory confirmation of the reliability of the adopted seismic retrofit intervention. In fact, the seismic isolation strategy, giving high lateral deformation to the bridge superstructure, permits reducing significantly the internal force levels in the columns, allowing them to remain within linear elastic range to the new seismic design forces for the CP Limit State defined for the site under consideration.
6. Conclusions
The paper deals with the proposal and application of a procedure for the seismic retrofit of an existing multispan prestressed concrete girder bridge, whose structural scheme is representative of a fairly widespread typology for the construction of road bridges.
The procedure is based on three steps that specifically concern (a) the seismic risk assessment of the existing bridge; (b) the design process of a bridge retrofit intervention based on the seismic isolation of the deck with friction pendulum devices (FPD); (c) the seismic response assessment of the seis-mically isolated bridge and the evaluation of the performance level achieved after the seismic retrofit intervention.
Starting from the knowledge of the geometry and material properties derived by the original drawings and design report, the seismic risk assessment of the existing bridge towards the new seismic actions, provided by the current Italian Code provisions, was performed. With this
L at eral disp lacemen t (cm) L at eral disp lacemen t (cm)
Off Noto 5 Christchurch 5
10 South Iceland 5 0 2 4 6 8 10 0 5 10 15 20 25 L at eral disp lacemen t (cm) Kagoshima 10 5 Northridge 5 0 1 2 3 4 5 6 0 5 10 15 20 L at eral disp lacemen t (cm) Loma Prieta 5 0 2 4 6 8 10 12 14 Irpinia 5 10 FPS device pier Pier column 20 40 60 80 0 t (s) −3 −2 −1 0 1 2 3 4 −4 −3 −2 −1 0 1 2 3 6 5 4 L at eral disp lacemen t (cm) L at eral disp lacemen t (cm) −3 −2 −1 −6 −8 −10 −4 −2 0 1 2 3 6 5 4 5 10 15 20 25 0 t (s) 5 10 15 20 25 0 t (s) t (s) t (s) t (s) 15 20 0 5 −3 −2 −4 −2 −3 −1 −2 −1 0 1 2 3 4 L at eral disp lacemen t (cm) 5 10 15 20 0 25 t (s) X direction Y direction X direction Y direction X direction Y direction X direction Y direction X direction Y direction X direction Y direction X direction Y direction
L at eral disp lacemen t (cm) L at eral disp lacemen t (cm)
Off Noto 5 Christchurch 5
10 South Iceland 5 0 2 4 6 8 10 0 5 10 15 20 25 L at eral disp lacemen t (cm) Kagoshima 10 5 Northridge 5 0 1 2 3 4 5 6 0 5 10 15 20 L at eral disp lacemen t (cm) Loma Prieta 5 0 2 4 6 8 10 12 14 Irpinia 5 10 FPS device abutment Abutment column 20 40 60 80 0 t (s) −3 −2 −1 0 1 2 3 4 −4 −3 −2 −1 0 1 2 3 6 5 4 L at eral disp lacemen t (cm) L at eral disp lacemen t (cm) −3 −2 −1 −6 −8 −10 −4 −2 0 1 2 3 6 5 4 5 10 15 20 25 0 t (s) 5 10 15 20 25 0 t (s) t (s) t (s) t (s) 15 20 0 5 −3 −2 −4 −2 −3 −1 −2 −1 0 1 2 3 4 L at eral disp lacemen t (cm) 5 10 15 20 0 25 t (s) X direction Y direction X direction Y direction X direction Y direction X direction Y direction X direction Y direction X direction Y direction X direction Y direction
FPS pier internal device FPS pier external device
FPS abutment internal device FPS abutment external device
−200 −150 −100 −50 0 50 100 150 200 F o rce (kN) −10 −5 0 5 10 15 −15 Displacement (cm) NLTH loop Theoretical loop (MFIQ= 0.02) Theoretical loop (@;MN= 0.06) −200 −150 −100 −50 0 50 100 150 200 F o rce (kN) −10 −5 0 5 10 15 −15 Displacement (cm) NLTH loop Theoretical loop (MFIQ= 0.02) Theoretical loop (@;MN= 0.08) −200 −150 −100 −50 0 50 100 150 200 F o rce (kN) −10 −5 0 5 10 15 −15 Displacement (cm) NLTH loop Theoretical loop (MFIQ= 0.02) Theoretical loop (@;MN= 0.08) −200 −150 −100 −50 0 50 100 150 200 F o rce (kN) −10 −5 0 5 10 15 −15 Displacement (cm) NLTH loop Theoretical loop (MFIQ= 0.02) Theoretical loop (@;MN= 0.06)
Figure 15: Comparison between theoretical and time history hysteresis loops, as effect of Irpinia earthquake along the transverse direction, for the FPD isolators placed at the top of pier columns and abutment columns.
aim, an incremental noniterative Nonlinear Static Procedure (NSP) inspired to the Pushover analysis, Capacity Spec-trum Method, and Inelastic Demand Response Spectra was applied. The use of this NSP permitted carrying out, accord-ing to the Performance-Based Earthquake Engineeraccord-ing, the values of PGA for which the structural capacity meets the seismic demand for the Limit State taken into account and, consequently, calculating the corresponding risk index. The results point out the inadequate lateral displacement capacity as well as the limited global ductility of the existing bridge towards the new “seismic demand” levels provided by the current seismic code.
Consequently, the second step concerns the design of a seismic retrofit intervention based on the deck isolation by using friction pendulum devices, FPD. In particular, the dimensioning of the isolation devices was developed through a multiobjective approach in order to meet the performance
levels provided for different operating conditions of the bridge. The first design objective was to avoid the lateral displacement of the deck under the lateral actions due to wind loads and braking forces defined according to the Ser-viceability Limit State SLS level. The second design objective was to ensure that the seismic response of the columns remained within their linear elastic range when the deck reached the maximum lateral displacement demand provided by the seismic code for the Ultimate Limit State SLU level.
The paper also examined, for this specific case, the effects of the FPD modelling parameters on the seismic response of the retrofitted bridge through nonlinear response history analyses involving a solution of the complete set of equi-librium equations at each time increment. In particular, the sensitivity analyses have shown how the vertical component of the earthquake ground motion and the variability of the coefficient of friction of the FPD isolator should be taken into
720 180 Column cross section 216 100 420 720 0 1500 3000 4500
Pier external column
−4500 −3000 −1500 0 1000 2000 3000 −1000 −2000 −3000 Mx (kN m) My(kNm) P = 1466 E. Mx, max; My My, max; Mx
Pier internal column P = 1948 E. 0 1000 2000 3000 −1000 −2000 −3000 Mx (kN m) 0 1500 3000 4500 −4500 −3000 −1500 My(kNm) Mx, max; My My, max; Mx
Abutment internal column P = 764 E. 0 1000 2000 3000 −1000 −2000 −3000 Mx (kN m) 0 1500 3000 4500 −4500 −3000 −1500 My(kNm) Mx, max; My My, max; Mx Abutment external column
P = 637 E. 0 1000 2000 3000 0 1500 3000 4500 −1000 −2000 −3000 −4500 −3000 −1500 M x (kN m) My(kNm) Mx, max; My My, max; Mx
Figure 16: Safety check of the cross section at the base of internal and external columns of piers and abutments.
account in order to carry out an accurate seismic response assessment of a seismically isolated bridge. On the other hand, the rate parameter has shown only a slight impact on the structural response parameters. In particular, the effect of
the axial load variability in the FPD isolator was relevant for the selection of the device bearing capacity and the relative
value of the friction coefficient at a high sliding velocity𝜇fast,