Review
Findings about LORETA Applied to High-Density
EEG—A Review
Serena Dattola * , Francesco Carlo Morabito , Nadia Mammone and Fabio La Foresta
DICEAM Department, Mediterranea University of Reggio Calabria, Via Graziella Feo di Vito, 89060 Reggio Calabria, Italy; [email protected] (F.C.M.); [email protected] (N.M.); [email protected] (F.L.F.)
* Correspondence: [email protected]
Received: 30 March 2020; Accepted: 14 April 2020; Published: 17 April 2020 !"#!$%&'(!!"#$%&' Abstract: Electroencephalography (EEG) is a non-invasive diagnostic technique for recording brain electric activity. The EEG source localization has been an area of research widely explored during the last decades because it provides helpful information about brain physiology and abnormalities. Source localization consists in solving the so-called EEG inverse problem. Over the years, one of the most employed method for solving it has been LORETA (Low Resolution Electromagnetic Tomography). In particular, in this review, we focused on the findings about the LORETA family algorithms applied to high-density EEGs (HD-EEGs), used for improving the low spatial resolution deriving from the traditional EEG systems. The results were classified according to their clinical application and some aspects arisen from the analyzed papers were discussed. Finally, suggestions were provided for future improvement. In this way, the combination of LORETA with HD-EEGs could become an even more valuable tool for noninvasive clinical evaluation in the field of applied neuroscience.
Keywords: high-density EEG; LORETA; EEG source localization
1. Introduction
Brain imaging refers to several techniques which map the structure and functions of the brain, used for investigations in cognitive neuroscience and for clinical applications. These techniques include, among others, positron emission tomography (PET), single photon emission computer tomography (SPECT), functional magnetic resonance imaging (fMRI), magnetoencephalography (MEG) and electroencephalography. Imaging techniques differ according to several factors, such as spatial and temporal resolution, invasiveness and cost [1]. In particular, EEG is a non-invasive diagnostic tool which records the electrical signals, generated by neurons, from electrodes placed on the head surface. For its non-invasiveness and its relatively low cost, over the years EEG has become a powerful instrument successfully employed in different fields, such as neurosurgery, neurology, and cognitive science. Because of its excellent temporal resolution, EEG is well-suited to analyze the dynamics of brain functions; on the other hand, EEG has a modest spatial resolution. Recently, high-density montages have been employed for recording the EEGs, in order to cope with this limitation. The estimation of the localization of the sources generating the electric signals is a key issue for diagnosing pathological conditions in the brain. The reconstruction of the distribution of the current density starting from the EEG measurements is termed as EEG inverse problem [2]. During the last two decades, LORETA (Low Resolution Electromagnetic Tomography) has been one of the most employed algorithm for the brain source localization, turning out to be a promising tool in several clinical fields. The objective of our work is to provide a review of the findings about this methodology, classifying them according to their clinical application. In particular, we focused on the LORETA
method applied to high-density EEGs, used for improving the low spatial resolution deriving from the traditional EEG systems.
2. EEG
Electroencephalography (EEG) is a technique used for recording the brain electrical activity from electrodes placed on the scalp. It was introduced by Hans Berger, who recorded the first human EEG in 1929, and described for the first time the alpha and beta waves [3]. EEG measures the potentials generated by large populations of neurons in the brain. The electrical activity can be spontaneous or a consequence of the presentation of a stimulus or the execution of any task. In order to generate a measurable EEG, a large number of simultaneously active neurons are needed. The electric potentials generated by neurons can be represented by dipoles. The EEG signal recorded by a single electrode does not arise only from the electrical activity of the regions underlying it—in fact, it detects the contribution of all sources, due to the conductivity of the scalp and the tissues. Consequently, the use of a realistic head model is fundamental to making EEG analysis more accurate [4]. EEG provides a very high temporal resolution, in the order of milliseconds; otherwise, its spatial resolution is modest. EEG pre-processing is a very important step in EEG signal analysis. The EEG is affected by unwanted components, called artifacts, which can have a physiological origin (eye artifacts, muscle artifacts) or derive from instrumentation (movement of cables, material used as a conductive gel between the electrodes and the scalp). Then, after the signal acquisition, the various types of artifacts have to be identified and removed by means of rejection methods based on automatic or visual detection [5]. Another crucial issue concerns the reference electrode. As is known, the EEG consists of a relative measurement, not an absolute one, because it detects the potential differences between two points. The properties of the reference, determined by its physical position or by the calculation method, affects the EEG measurements [6,7]. When a large number of electrodes is employed, it would be advisable to use the average reference, according to which the signal of each electrode, acquired in physical reference, is referred to a virtual value resulting from the average of the signals coming from all the electrodes [8].
The two following subsections describe the most commonly used systems for the electrode arrangement on the scalp.
2.1. Low-Density EEG
For years, the position of the electrodes on the head surface was set according to the International 10–20 System [9]. Electrode placement is based on four reference points on the head surface: the nasion, the inion, and the left and right preauricular points. “10–20” refers to the distance between adjacent electrodes, that is 10% or 20% of the length inion-nasion and left-right preauricular points. The use of percentages instead of fixed distances allows to preserve the correspondence between the electrodes and the underlying brain areas whatever the size of the head [10]. Each location site is associated with letters and numbers. Fp, F, C, P and O denote the fronto polar, frontal, central, parietal and occipital areas, respectively. Even numbers indicate the right hemisphere, odd numbers the left one, and “z” identifies the midline (Figure1). The maximum electrodes number is 21.
2.2. High-Density EEG
Over the years, the sampling of the scalp potential has been a matter broadly discussed by many researchers [11]. A correct spatial sampling, in fact, is essential to avoid aliasing and mislocalization of the sources [12]. In 1985, Chatran et al. proposed the 10–10 system, which is made up of 81 electrodes [13]. It was obtained adding 60 supplementary electrodes to the 21 of the 10–20 system (Figure2a). After some modifications it became the standard of the American Clinical Neurophysiology Society and the International Federation of Clinical Neurophysiology. Later, the results of several studies showed that the interelectrode distance should be between 1 cm and 3 cm, which implies the use of at least 100 electrodes [14–19]. Therefore, a farther extension of the 10–10 system was introduced, the so-called
10-5 system, which consists of 345 electrode locations [20] (Figure2b). However, today the EEG acquisition system on the market include no more than 256 electrodes.
Figure 1. Electrode location on the scalp according to the 10–20 system [10]. On the (A): lateral view of the skull. On the (B): superior view of the skull.
(a) (b)
Figure 2. (a) Electrode positions in the 10–10 system; light blue circles denote the 10-20 electrode positions.
(b) Electrode positions in the 10-5 system; dots indicate the positions added to the 10–10 system.
3. EEG Source Localization
The localization of the active brain sources is a very important matter concerning the EEG. This issue is termed as EEG inverse problem. The activation of a configuration of known brain sources generates a well-defined electric and magnetic field. Therefore, it is possible to predict the potential differences recorded on the scalp from the current densities of the sources. This is the so-called forward problem, which provides a unique solution. On the other hand, the inverse problem is an ill-posed problem: it does not produce a unique solution because more than one combination of simultaneously active sources can generate the same electric field on the head surface. Therefore, in order to estimate the locations of the sources from the potential differences on the scalp, some biophysical and mathematical constraints must be imposed [21]. Regardless of the method employed, over the years the improvement in source localization accuracy using HD-EEG systems has been proved by several studies [22–24]. Moreover, analyzing simulated EEG data, it was shown that the accuracy in source localization was better when the sensors were distributed on the whole head surface (not only the superior head regions) [25].
The algorithms for solving the EEG inverse problem can be classified in two main groups—parametric and non parametric methods [26]. The parametric methods assume that the EEG signals arise from a small number of point sources, whose location and orientation are unknown: in this case the number of dipoles is chosen a priori (Equivalent Current Dipole approach). Over the years, these kind of algorithms are being replaced by the introduction of the non parametric methods, which assume that several sources with fixed positions are distributed across the brain volume (Distributed Source Models approach). Among the latter methods, the minimum norm estimate was the first one which produced an instantaneous, distributed, discrete, linear solution, but it showed a misplacement of deep source onto the outermost cortex [27]. The issue of large localization errors was solved with the introduction of LORETA [28].
3.1. Low Resolution Electromagnetic Tomography (LORETA)
LORETA, introduced in 1994, represented an innovative method in the field of high temporal resolution neuroimaging, since it allowed a three-dimensional reconstruction of the brain electrical activity distribution and proposed a linear solution to the inverse problem, valid from the neurophysiological point of view [28]. The brain volume is divided in a three-dimensional grid, made up of 2394 voxels at 7 mm spatial resolution. LORETA uses a three-shell spherical head model registered to the Talairach human brain atlas [29]. Each source has a fixed position on a grid point (voxel) and is defined by a current density vector with unknown components. The intensity and direction of the electrical activity at each point determine the electromagnetic field measured on the scalp. The solution space is restricted to grey matter and hippocampus. From a physiological point of view, the solution takes into consideration that neighboring neurons have a higher probability of being simultaneously active. Hence, the model assumes that nearby points have a certain probability of being synchronized (in terms of orientation and intensity) as compared with points distant from each other. Among the possible infinite reconstructions of the active generators, starting from a set of data recorded on the scalp, LORETA chooses the smoothest. Mathematically, this is performed by using a discrete spatial Laplacian operator. As a consequence, LORETA has a relatively low spatial resolution since produces blurred images, maintaining the location of the maximal activity, but with a certain amount of dispersion. Nevertheless, its average localization error is only one grid unit. Compared to other methods for solving the inverse problem, LORETA has shown a greater accuracy in localizing deep neuronal sources [30].
The general inverse problem can be expressed as [31] min
J FW (1)
with
FW =kF KJk2+ aJTWJ (2)
where F 2 RNEx1is the vector of the electric potential differences measured at NEelectrodes with respect to a single common reference electrode; K 2 RNEx(3NV)is the lead field matrix corresponding
to Nvvoxels; J 2 R(3NV)x1is the current density; a > 0 is the Tikhonov regularization parameter [32]. It is assumed that the EEG measurements and the lead field are average reference transformed.
The solution is
ˆJW=TWF (3)
where TWis the pseudoinverse, given by
TW =W 1KT(KW 1KT+ aH)+ (4)
The matrix H is the average reference operator. For LORETA, the matrix W denotes the squared spatial discrete Laplacian operator.
3.2. Standardized Low Resolution Electromagnetic Tomography (sLORETA)
A few years later, the authors of LORETA proposed a new method, called sLORETA, based on the noise normalized current density approach [33]. This method no longer uses the Laplacian operator and is based on the standardization of the current density [34]. In particular, the current density estimation is obtained using the minimum norm solution and is standardized by means of its variance. In this case, unlike the Dale method [33], the variance considers not only the noise caused by the EEG measurements but also the biological noise deriving from the actual sources. So, the electric potential variance is
SF=KSJKT+SFNoise (5)
where SFNoiseis the variance of the noisy measurements and SJis the variance of the current density.
According to the Bayesian point of view, the actual source variance, that is the current density variance (prior), is equal to the identity matrix. Therefore, the variance of the estimated current density can be written as
SˆJ=TSFTT=T(KKT+ aH)TT=KT[KKT+ aH]+K (6)
Finally, sLORETA is given by the estimates of standardized current density power:
svTsv = ˆjvT[SˆJ]v1ˆjv (7)
where [SˆJ]v is the vth 3 ⇥ 3 diagonal matrix in [SˆJ]. For sLORETA, the brain volume consists of 6239 voxels at 5 mm spatial resolution. The simulations showed that sLORETA has zero localization error in ideal (no-noise) conditions and the lowest localization error as compared with the minimum norm and the Dale methods in the presence of measurement and biological noise [34].
3.3. Exact Low Resolution Electromagnetic Tomography (eLORETA)
The need to farther reduce the localization error led to the formulation of the eLORETA algorithm. eLORETA introduced a weight matrix which takes the deeper sources into account in a more adequate way [35]. The eLORETA solution is computed by Equation (4), where the weight matrix W has the following expression:
Wv= [KTv(KW 1KT+ aH)+Kv]1/2 (8)
The matrix Wv 2 R3⇥3is the vth diagonal subblock of W.
eLORETA is a genuine inverse solution with zero localization error in the presence of measurement and structured biological noise. It also shows a better capacity of suppressing less significant sources and produces less blurred images in comparison to sLORETA [36].
4. LORETA Analysis
The next subsections are organized as follows: the first one includes the papers which investigated the brain functions in healthy subjects; from the second one onward, the papers are grouped according to the brain disorder which affects the participants involved in the research.
4.1. Event-Related Potentials
Event-Related Potentials (ERPs) are electrical signals time locked to sensory, motor or cognitive stimuli, which reflect the timing of the information processing in the brain. ERP waveforms (components), described on the basis of their amplitude and latency, provide useful information about sensory, cognitive and emotional processes both in healthy and brain-injured subjects. In this section we focused on the results about the localization of ERP neuronal sources in healthy subjects.
In the study reported in Reference [37], ten healthy subjects performed a visual task, which consisted in discriminating between a perspective drawing of an object existing in the 3D world (possible object) and perspective drawing of an object which can not exist in the 3D world
(impossible object). The EEG were recorded by 72 channels. A significant difference between possible and impossible conditions in current density was found in the right inferior fusiform gyrus, suggesting that this region is involved in cognitive processes of discrimination between spatially possible and impossible objects.
The word repetition effects on the implicit memory were investigated in Reference [38]. Thirteen healthy subjects underwent a lexical decision task, in which word and non-word (speech sounds without meaning in Korean) were visualized on a computer monitor. Some of the words were repeated after 1–5 intervening words. The ERP elicited during the task were recorded by 128 electrodes and the ERP sources were reconstructed by LORETA, using a realistic head model based on individual MRI. The statistical analysis revealed that the sources produced by old words (i.e., repeated words) showed a significant current density reduction, in comparison to the new words, in the left inferior frontal gyrus, suggesting that the activity of the left inferior frontal area is associated with word repetition effects. The study in Reference [39] focused on the anticipatory neural responses to heat stimuli and the modulation of brain activity caused by the expectation of pain. Before receiving laser heat stimuli at three different intensities (low, medium or high), fifteen healthy subjects visualized a cue word that predicted the heat intensity (certain expectation) or not (uncertain expectation). The source reconstruction, starting from 61-channel EEGs, showed that the uncertain condition, compared to the certain condition, produced a greater activation in the left dorsolateral prefrontal cortex (DLPFC), posterior cingulate cortex, left (contralateral) inferior parietal cortex and right superior frontal gyrus (SFG), which are associated with attentional function (including somatosensory and pain functions). Conversely, there was an increased activity for the certain condition (relative to the uncertain condition) in the left inferior frontal and inferior temporal cortex, and right anterior prefrontal cortex, involved in prospective memory functions.
Lamm explored the N2 ERP component, associated with cognitive control, in two works. In the first one [40], seventeen children executed a go/no-go task with two different stimuli deriving from non-affectively (neutral) charged pictures and non-affectively charged pictures. The LORETA reconstruction, performed on 64-channel EEGs, showed that the DLPFC, a region related to cognitive control, was more active in the affectively charged picture condition as compared to the neutral picture condition. In the second study [41], the author explored the behavioral inhibition (BI) in 106 seven-years old children. In this case, children performed a go/no-go task presenting only neutral pictures. The analysis of the estimated sources, starting from 64-channel EEGs, revealed that BI produced a greater activity in the DLPFC and the dorsal anterior cingulate cortex (dorsal ACC).
Meyer and colleagues studied the brain activity involved in semantic processing [42]. The source localization of responses to stimuli, represented by semantically congruent and incongruent audiovisual speech and body actions, was computed starting from 128-channel EEGs of eleven subjects. The analysis of results revealed that the sources, reconstructed for different time windows, were located in the occipital/posterior temporal area in the early activation (before 120 ms after stimulus). From 180 to 420 ms, the activation involved different regions simultaneously, including the inferior frontal, superior temporal, parasaggital and superior parietal areas. This outcome was consistent with models which place parallel processing of complex action sequences in frontal, temporal and parietal areas. Late activity (after 460 ms) was mainly concentrated in the inferior-frontal areas.
Tremblay and Vannasing studied the differences between the development of the parvocellular (P) and magnocellular (M) visual system of 33 healthy preterm and 41 fullterm infants [43]. More specifically, the participants underwent visual stimuli for investigating the visual evoked potentials, in particular the N1 and P1 components. The EEG were recorded by 128 electrodes at 12 months of age. In response to stimuli which stimulated preferentially the M system, a greater activity was detected in the dorso-parietal region in fullterm infants, corresponding to a mature M pathways response, as compared to preterm babies. On the contrary, there was no difference in brain sources between the groups for the P system. These outcome suggested a normal development of the P pathway in the preterms, whereas the the M system was not yet mature at 12 months of age.
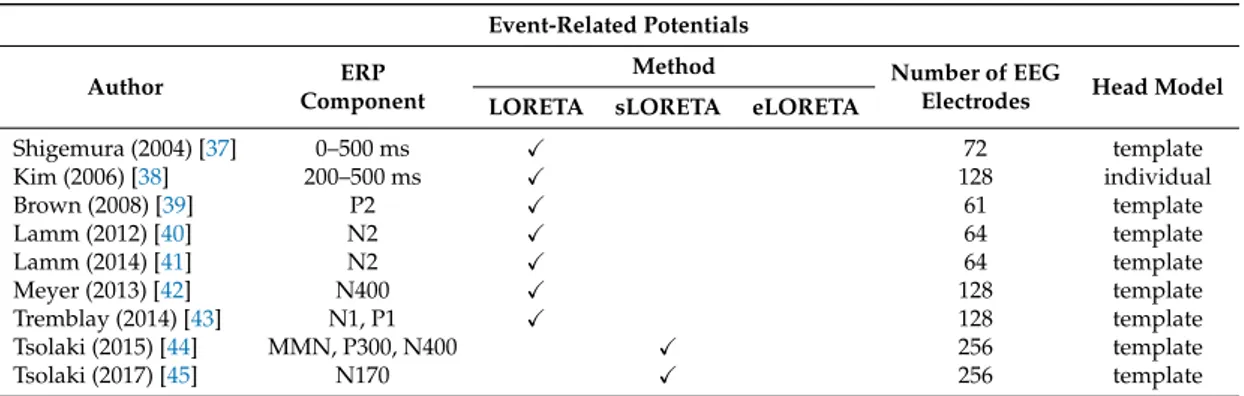
The study explained in Reference [44] explored the age and gender differences obtained from three ERP components: the mismatch negativity (MMN), the P300 and the N400. 27 young adults and 18 elderly underwent an oddball task and HD-EEG were acquired by 256 electrodes. There was a statistically significant age-related difference in lantencies and amplitude of the MMN and the P300. From the source reconstruction done by sLORETA, in the case of P300 emerged that the maximum current density is in the frontal lobe for the young subjects whereas it is in the temporal lobe for the elderly group. There was also a decreased activity with aging. As for the gender analysis, in the young group the MMN and the P300 component maximum current density is similar for both gender, even if it is located in the frontal lobe in female and in the temporal lobe in male. Finally, as for the N400 component, females have almost the half maximum intensity as compared to age matched males. Tsolaki and colleagues explored neural activation during emotion processing [45]. The study involved 22 adult females, 11 young and 11 elderly. Images of facial expressions of fear and anger were presented to the participants while a 256-channel system was recording their EEG. The analysis of the N170 ERP component revealed a significantly higher amplitude in the elderly for both emotions, especially at the occipito-temporal sites. The brain source localization, conducted using sLORETA, showed that during the N170 component, for both emotions, the maximum current density of the difference wave between the young and the elderly subjects is located in the same brain region, that is the limbic area. These findings indicated a deficit in the limbic area due to aging during the emotional processing. Table1summarizes the main features of each above-mentioned study.
Table 1. Overview of the included papers about event-related potentials (ERPs).
Event-Related Potentials
Author ERP
Component
Method Number of EEG
Electrodes Head Model LORETA sLORETA eLORETA
Shigemura (2004) [37] 0–500 ms X 72 template Kim (2006) [38] 200–500 ms X 128 individual Brown (2008) [39] P2 X 61 template Lamm (2012) [40] N2 X 64 template Lamm (2014) [41] N2 X 64 template Meyer (2013) [42] N400 X 128 template Tremblay (2014) [43] N1, P1 X 128 template Tsolaki (2015) [44] MMN, P300, N400 X 256 template Tsolaki (2017) [45] N170 X 256 template 4.2. Epilepsy
Epilepsy is a neurological disorder caused by abnormal electrical activity of brain cells and characterized by recurrent seizures. Epilepsy can be classified into two main categories—focal (partial) or generalized. In the first one, seizures derived from alterations in a limited brain area; in the second one, both hemispheres are involved [46]. From the physiological point of view, epilepsy is associated with increased neuronal synchronization. Therefore, the brain areas showing a rising activity may have ictogenic property.
In the event of drug resistant focal epilepsy, the resective surgery is a valid therapeutic option. In this case, the accurate localization of the epileptogenic zone to be removed is a crucial issue. Recently, high-density EEG have improved the noninvasive evaluation of epilepsy. In Reference [47], the authors reviewed the findings about LORETA in epilepsy until 2015. All the papers included in this section were not cited in the above-mentioned review.
Several recent studies confirmed the benefits of employing high-density EEG systems. Wang et al. studied the generators of the interictal spikes [48]. From the analysis of 7 patients, the authors proved that using a high-density montage with 76 electrodes, the epileptogenic zones generating seizures were localized more accurately than a 31-electrode EEG system. The localization error was defined as the shortest distance between the LORETA maximum source strength and the resected zones. Moreover, they investigated how the head modeling affected the high-density source localization. They compared
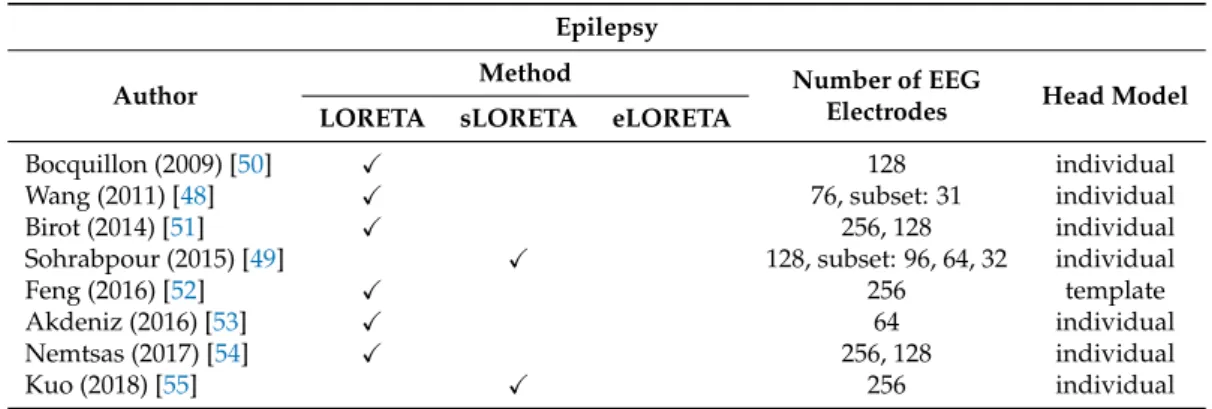
a realistic boundary element method head model and a three-shell spherical head model. The results showed that the first one provided a statistically significant lower localization error. These findings were confirmed by the surgical resection outcome. In Reference [49] the authors considered four electrode configurations (32, 64, 96 and 128) for studying five epileptic pediatric patients. The outcome showed that the localization error of the epileptogenic foci decreased when the number of electrodes increased. In particular, the most significant improvement was observed when going from 32 to 64 electrodes. The study explained in Reference [50] investigated the attention impairment in temporal lobe epilepsy (TLE). Ten patients and ten healthy subjects underwent an oddball paradigm while a 128-channel system was acquiring their EEG. The source reconstruction of the P3b component was performed by LORETA using a head model based on individual MRIs for each subject. The analysis of results revealed a statistically significant lower current density for TLE patients in the temporal areas and, to a lesser extent, in the frontal regions, as compared to controls, in both auditory and visual oddball paradigms. The temporal and frontal areas are involved in attentional processes, so TLE might cause a dysfunction of the attention system, as these results suggest. Birot and colleagues [51] based their research on the study of the interictal epileptiform discharges. Thirty-eight patients with pharmacoresistant focal epilepsy were selected. They underwent high-density EEG (128 or 256 electrodes) and intracranial recordings. The authors compared the localization accuracy of the irritative zones deriving from three different head models: a Locally Spherical Model with Anatomical Constraints (LSMAC), a Boundary Element Model and a Finite Element Model, all of them obtained from the individual MRI of the patients. Thirty-two subjects underwent surgical resection of the supposed epileptogenic zones. For the 23 patients with a post-operative positive outcome (Engel class I and II), at least in the 74% of cases the source maxima were within the resected zone. Moreover, the authors computed the distance between the source estimated by LORETA and the irritative zone defined by the intracranial recordings. The results showed that the position of source maxima is very similar for all head model (in 10% of cases the maximum is at the exact same position). A statistical test confirmed that there was not a statistical significant difference between the distributions of distance across the head model. So this study proved that the choice of one of the above-mentioned head model does not significantly affect presurgical evaluation and clinical decision making. In Reference [52], the authors considered forty-three patients with TLE, who underwent resective surgeries. In order to acquire the EEG signals a 256-channel montage was used. The authors analyzed the localization accuracy of the epileptogenic zone evaluated by means of LORETA and other noninvasive methods (MRI, PET, cEEG, and semiology). The evaluation was carried out by comparing results with resections that eliminated or significantly reduced seizures. The outcome obtained with LORETA showed the best sensitivity and specificity. The study also revealed that the probability of postoperative seizure freedom when the interictal epileptic discharges arose from one single source was significantly better than the case of multiple sources. Moreover, it was more likely that patients were seizure freedom after surgery when the localized sources were within the resected zones as compared to sources outside resection (94.1% vs. 33.3%). These findings suggested that source localization of the epileptogenic zone by LORETA could be a good instrument for presurgical planning. Akdeniz [53] studied 15 patients with drug-resistant focal epilepsy by means of 64 electrodes. As the above-mentioned papers, the author used individual head model obtained from MRI images. 9 patients of 15 showed lesions on MRI; for the other 6, intracranial recordings were also performed for the presurgical evaluation. The epileptogenic zone localized by LORETA agreed with the resected area for 13 patients, who were seizure-free after surgery. For the remaining two patients, an epileptogenic zone next to the resected area was found, denoting that the epileptogenic zone had not been resected completely. This outcome was supported by the fact that both subjects had seizures, although fewer, even after surgery. Fifteen patients affected by intractable focal epilepsy took part in the study proposed in Reference [54]. The recordings were made using 256 electrodes, except for one patient for whom 128 electrodes were used. The analysis of results was based on the concordance of the interictal and ictal source localization and the surgical outcome, using individual head model (LSMAC). Starting from the 8 patients who underwent resection surgery,
the seizure onset zone was correctly localized in 5 of 6 patients who turned out to be seizure-free after surgery. For the sixth one (128 electrodes) the localized ictal source was outside the resected zone. This could suggest the need of a greater number of electrodes for achieving a correct localization. As for the comparison between interictal and ictal localization, they were sublobar concordant in 9 of 14 patients and agreed with MRI scans. For additional 4 patients there was partially concordance because the interictal analysis showed more than one solution: in these cases the ictal source corresponded with one of the detected interictal source. In total there was concordance in 93% of cases. Kuo et al. [55] examined 84 seizures in 12 patients with medically resistant epilepsy. Their aim was the localization of the seizure onset zone by means of sLORETA starting from 256-channel EEG. The accuracy of results were tested by comparing them according to one or more of the following clinical criteria: epileptogenic lesions assessed from MRI imaging, seizure onset detected in intracranial EEG and successful surgical outcomes. For the source localization from HD-EEG individual head modeling were used, whereas the others source analysis were carried out with the atlas head model. The number of seizure onsets localized was 56 out of 84. For the lateralization measure, the results from HD-EEG were more accurate than results from the 19-channel 10-20 EEG (100% vs. 50%). This trend was also confirmed for the sublobar concordance (90% vs. 40%). Finally, the seizure localization resulting from HD-EEG with ictal onset was better than that deriving from the clinical interpretation of the interictal spikes (IIS). Table2summarizes the main features of each above-mentioned study.
Table 2. Overview of the included papers about epilepsy. Epilepsy
Author Method Number of EEGElectrodes Head Model
LORETA sLORETA eLORETA
Bocquillon (2009) [50] X 128 individual
Wang (2011) [48] X 76, subset: 31 individual
Birot (2014) [51] X 256, 128 individual
Sohrabpour (2015) [49] X 128, subset: 96, 64, 32 individual
Feng (2016) [52] X 256 template
Akdeniz (2016) [53] X 64 individual
Nemtsas (2017) [54] X 256, 128 individual
Kuo (2018) [55] X 256 individual
4.3. Alzeheimer’s Disease
Alzheimer’s Disease (AD) is a neurodegenerative disorder which is the most common cause of dementia. The first stage of the disease, called Mild Cognitive Impairment (MCI), is a transition state between normal aging and dementia. However, the MCI symptoms, above all memory problems, do not alter the everyday life significantly. As the disease advances, people experienced severe language impairment, disorientation, behavioral changes and loss of their motor skills. Because of these symptoms, people are no more able to take care of themselves. An early diagnosis is essential but extremely hard because the first stage condition is often mistaken for normal aging. Most of the studies about LORETA and AD considered low density montage EEG. The few works carried out on high-density EEG are reported below.
The study conducted in Reference [56] explored the effect of cognitive and physical training on the deterioration of brain processes. Seventy MCI patients were divided into five equally populated groups: long lasting memory (LLM), physical training (PT), cognitive training (CT), active control (AC) and passive control (PC). LLM performed physical and cognitive exercises, PT underwent only physical training, CT carried out only cognitive tasks, AC group watched a documentary and answered a questionnaire, and PC were not involved in any activity. The EEG were recorded before and after the completion of the procedure (8 weeks), using 57 electrodes. eLORETA computed the active source reconstruction for delta, theta, alpha, beta 1 and beta 2 bands. In order to perform the statistical
analysis, the statistical nonparametric mapping method was employed, implemented in an eLORETA software package. From the comparison between the reconstructed sources before and after the procedure within each group arose that there were statistically significant differences only for the LLM group, for all frequency bands except for the alpha band. In particular, the cortical activity decreased in precuneus extending in the posterior cingulate cortex. As for delta and theta decrease, it can be considered as a positive outcome on brain neuroplasticity, which could decelerate the neurodegeneration processes. Therefore, results showed that combined physical and cognitive training maintains or improves cognitive functions.
The analysis of the ERP components could be a useful tool for an early diagnosis of AD. In Reference [57], the authors examined two ERP components, the MMN and the P300, for detecting the cognitive decline. The study involved three groups of subjects: 21 healthy elderly, 21 mild cognitive impairment, and 21 mild AD. The EEG were recorded by a 256-channel system during the execution of the 2-tone oddball task. The localization of active sources, performed by sLORETA, revealed that the highest difference in the amplitude between controls and MCI and controls and AD for both MMN and P300 is similar in MCI and AD and is in the same Brodmann area (BA 11) in the frontal lobe, independently of the stage of the disease. This research was the first one which explored MMN and P300 using LORETA applied to HD-EEG for studying Alzheimer’s disease. Gu and colleagues [58] carried out a study which combined ERP and sLORETA, too. Their study dealt with amnestic mild cognitive impairment (aMCI), which can be divided into two groups: single domain aMCI (sd-aMCI) and multiple-domain aMCI (md-aMCI). They considered 85 subjects: 46 healthy elderly controls and 39 aMCI (26 sd-aMCI and 13 md-aMCI patients). 64-channel EEG were recorded while the subjects were performing two tasks related to visuospatial working memory (VSWM task) and executive function (Go/Nogo tasks). Two ERP components were considered and analysed: N200 and P300. As for VSWM task, the results revealed no significant differences in source activation between sd-aMCI and controls during P300 time range. However, the P300 amplitude in md-aMCI decreased as compared to sd-aMCI patients. Moreover, for md-aMCI there was a hypoactivation in the right middle frontal gyrus (BA 8) during P300 time range, compared to sd-aMCI. These outcome confirmed that md-aMCI showed more serious deficits in updating operation of working memory, compared to sd-aMCI patients. sLORETA source reconstruction also detected a hypoactivation for md-aMCI in the right medial frontal gyrus (BA 9) compared to controls, and in the right SFG (BA 10) compared to sd-aMCI, in both Nogo and Go task during N200 time range. Finally, md-aMCI showed less activation in the right SFG (BA 8) compared to sd-aMCI in Go task during P300 time range.
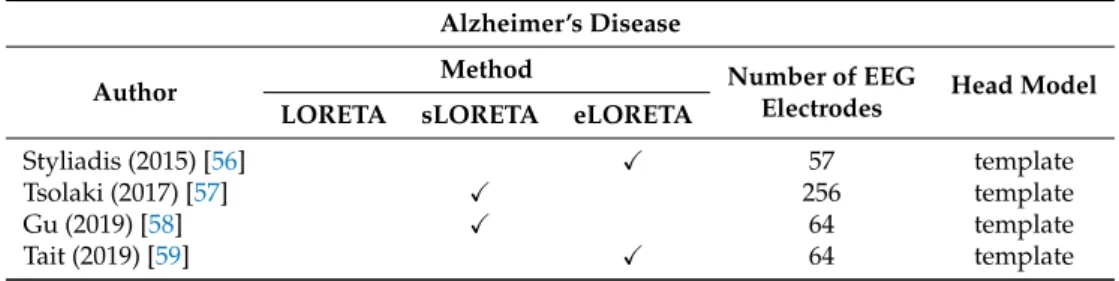
In [59], the authors explored the alteration of networks in AD. Differently from the majority of previous study EEG were recorded in an open eyes state. A 64-channel system was employed for detecting the EEG from 21 AD patients and 26 controls. Using eLORETA, the power spectrum was computed for each subject, for the total band and for each of the classic five frequency bands. The only significant difference was the increase in power for theta band. Then, starting from the reconstructed sources, a functional connectivity analysis was conducted over 40 regions of interest (ROIs) for theta band, computing the phase locking factor between each pair of ROIs. Results showed that the small-worldness of networks decreased in AD and was positively correlated with MMSE language sub-score, suggesting that modifications in AD networks topology are mostly associated with language deficits. It was also found that the reduction of the small-worldness was a consequence of increased path lengths, mainly localized to the temporal lobes. Moreover, the authors investigated the relationship between functional and effective connectivity: the results suggested that changes in functional connectivity derived from a reduced effective connectivity between the temporal lobes and other anatomical regions of the brain. Table3summarizes the main features of each above-mentioned study.
4.4. Depression
Major depressive disorder (MDD) is a mental disorder characterized by a lasting feeling of sadness or a lack of interest in outside stimuli. It has a recurrent nature, so people experience, on average, five to nine major depressive episodes in their lifetime. If not correctly treated, depression can significantly affect the quality of life. Over the years, LORETA has been widely employed for detecting alterations in the brain activity of MDD subjects. As for HD-EEG, the papers examined are the following.
Table 3. Overview of the included papers about Alzheimer’s disease. Alzheimer’s Disease
Author Method Number of EEGElectrodes Head Model LORETA sLORETA eLORETA
Styliadis (2015) [56] X 57 template
Tsolaki (2017) [57] X 256 template
Gu (2019) [58] X 64 template
Tait (2019) [59] X 64 template
In Reference [60], Pizzagalli and colleagues studied the activity within the rostral anterior cingulate cortex, a region involved in action regulation. They considered 17 subjects with high BDI (Beck Depression Inventory) scores and 17 subjects with low BDI scores (controls). A 128-channel system recorded the EEG in resting state (with both eyes open and closed) before the execution of the Eriksen Flanker task. LORETA reconstructed the cortical current density distribution of the theta (6.5–8 Hz) and gamma (36.5–44 Hz) bands. Results showed that high BDI subjects had significantly lower accuracy after incorrect than correct trials, and a statistically significant reduction of the pre-task gamma current density within the affective (rostral) but not cognitive (dorsal) ACC subdivision, as compared to low BDI. Therefore, the lower activity within the ACC in depressed subjects may cause abnormal responses to errors. Conversely, for low BDI subjects, pre-task gamma within the affective ACC subdivision was a predictor of the post-error adjustments effect. In Reference [61], the authors focused on depression in adolescence. Female adolescents, 36 healthy controls (HC) and 23 MDD, were enrolled and executed the facial recognition task: four basic emotional facial expressions (happy, sad, fearful, angry) were presented in different intensity, ranging from 10% (low intensity) to 100% (high intensity). In addition, EEG were recorded in resting state by 128 electrodes, not simultaneously with the emotion identification. The cortical current density was estimated by LORETA, for the theta (6.5–8.0 Hz) and low alpha (8.5–10 Hz) bands in the DLPFC, a region related to the emotion processes biases in MDD. The results revealed that MDD subjects exhibited a greater accuracy in the identification of sad faces and worse accuracy in the identification of happy faces, especially low-intensity happy faces, as compared to HC. There were no significant differences between groups for both fearful and angry expression. Moreover, LORETA analysis showed greater theta and alpha current density in MDD versus HC, particularly in the left DLPFC. Finally, it was also found that greater left DLPFC theta and alpha activity was correlated with a reduced accuracy for happy emotion identification. The same author examined depressed female adolescents in Reference [62], too. Thirty HC and twenty-two MDD subjects completed the self-referential encoding task while ERP were recorded with a 128-channel system. The above-mentioned task included 80 trials consisting of 40 positive and 40 negative words. In order to analyse the cognitive-affective processes related to self-referential processing, P1, P2 and late positive potential responses to positive and negative words were examined. It was also estimated the cortical current density by LORETA. Results showed that depressed subjects endorsed, recalled, and recognised more negative words and fewer positive words, as compared to the healthy group. Moreover, MDD showed greater P1 amplitudes following negative words, which is associated with a more negative self-view and greater self-criticism. As for the late LPP, a greater amplitude following negative versus positive words in depressed group was
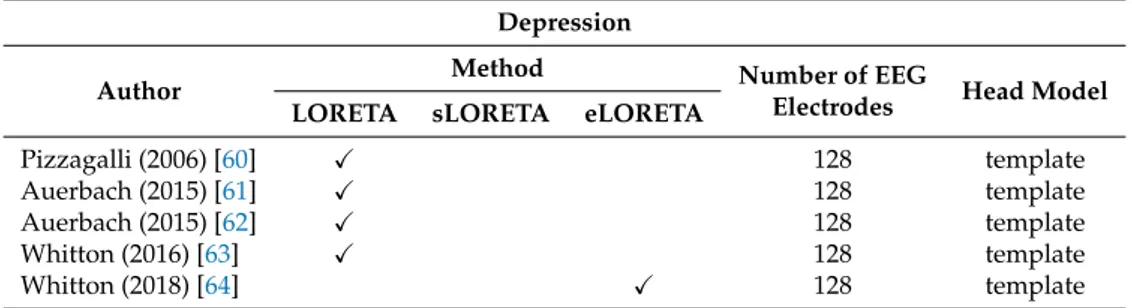
observed too; conversely, the healthy females displayed the opposite trend. For both P1 and LPP, LORETA showed less current density to negative words in the inferior frontal gyrus in MDD versus HC. In addition to the inferior frontal gyrus, for P1, reduced activity was detected in the depressed group within the anterior cingulate and medial temporal gyrus, whereas for LPP in the middle temporal gyrus. The referred-to group differences were all statistically significant. These findings indicated that the P1 and LPP reflect self-referential processing biases in female adolescents with depression. Whitton and colleagues [63] examined 26 patients with remitted major depressive disorder (rMDD) and 34 control subjects with no history of depression. ERPs were recorded during the execution of a probabilistic reward task by means of a 128-channel system. The objective was to study the reward learning systems in rMMD subjects. The source localization was carried out by LORETA for eight ROIs, defined from two meta-analysis of reward-related fMRI studies. Results showed a decrease in reward-related ERP amplitudes and a reduced reward-related activation in the ACC and the pregenual ACC for rMMD group, as compared to controls. These outcome implied that the reward learning deficits detected in acute MDD persisted into full remission and that these impairments could derive from abnormalities in the neural processes involved in reward feedback monitoring. In Reference [64], the authors investigated the resting state functional connectivity in 65 subjects with MDD compared to 79 healthy controls; moreover, 30 rMDD subjects were considered for a secondary analysis. The cortical activity was reconstructed by the eLORETA method applied to 128-channel EEGs. The functional connectivity was computed by the lagged phase synchronization parameter, using a tool implemented in the eLORETA software. The analysis was conducted considering ROIs belonging to the default mode network (DMN) and the frontoparietal network (FPN) for several frequency bands. A statistical analysis was used for investigating the group differences in within- and between-network connectivity. Significant differences were found between the HC and MDD groups within-DMN connectivity in the beta 2 band (18.5–21 Hz) and between the DMN and FPN connectivity in the beta 1 band (12.5–18). In addition, results revealed that both indices of connectivity were lower in rMDD group as compared to MDD, whereas the rMDD and HC did not differ. These findings showed that depression is characterized by greater within-DMN and DMN–FPN phase synchronization in the high-frequency band, which normalizes to some extent in remitted subjects but is associated with a more recurrent depressive illness course. Table4summarizes the main features of each above-mentioned study.
Table 4. Overview of the included papers about depression. Depression
Author Method Number of EEGElectrodes Head Model LORETA sLORETA eLORETA
Pizzagalli (2006) [60] X 128 template Auerbach (2015) [61] X 128 template Auerbach (2015) [62] X 128 template Whitton (2016) [63] X 128 template Whitton (2018) [64] X 128 template 4.5. Stroke
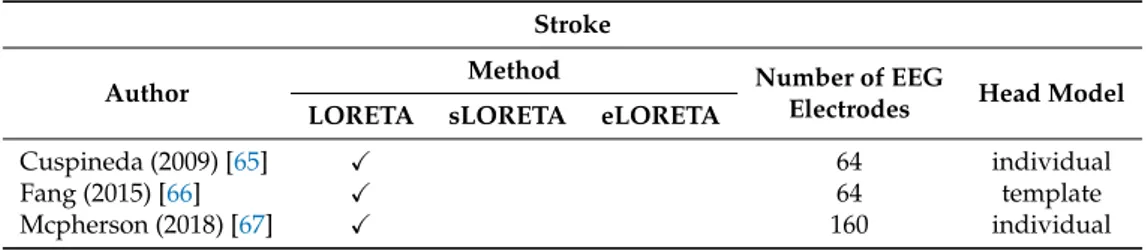
Stroke is defined by the World Health Organization as a clinical syndrome, with a vascular origin, consisting of rapidly developing clinical signs of focal or global disturbance of cerebral function lasting more than 24 h or leading to death. The papers in literature about LORETA and stroke are few. As for HD-EEG, just three works were found.
The study proposed in Reference [65] explored the closed-open eyes alpha reactivity phenomenon from 64-channel EEGs of 32 healthy subjects and a patient with acute ischemic stroke. The comparison between open eyes and closed eyes conditions in healthy subjects revealed that there was a statistical significant higher activation in the bilateral posterior cortical regions, where the primary visual cortex is located. In some cases, lower activations were also found in the anterior and thalamic regions.
As for the stroke patient, there was a significant decrease in reactivity in the damaged hemisphere, as compared to normal subjects. It was also detected a reactivity reduction in the undamaged hemisphere. The research in Reference [66] involved 10 stroke patients with a coordination impairment of the upper limb and 5 healthy controls. The participants executed an upper extremity reaching task while a 64-channel system was acquiring their EEG. The objective was the estimation of the cortical activity related to both movement preparation and motor execution. The source localization was carried out by LORETA and the contralesional/lesional activation ratio (CTLR) for both groups was computed and compared. CTLR is the ratio of activation in the right or non-lesion hemisphere versus left or lesioned hemisphere. The results showed that the CTLR for the primary motor cortices was significantly higher for stroke as compared to the controls in the planning phase, but not in the execution phase. In the stroke group, the CTLR was significantly higher in the planning than execution phase in the Brodmann area 4, whereas for the controls the CTLR for both phases were similar. As it is expected, these findings revealed that stroke patients have an abnormally high brain activity, specifically in the contralesional hemisphere. In fact, because of damage in the cortical network, a greater effort was needed to execute the motor task for stroke patients. In Reference [67], 160-channel EEGs from 10 adults with chronic, hemiparetic stroke and 8 adults without neurological injury were examined during the execution of a motor task for exploring the mechanisms underlying the so-called “flexion synergy”. An individual head model was created from MRI and used for reconstructing the cortical activity by means of LORETA. In controls group, the cortical activity was mainly observed in the hemisphere contralateral to the arm being examined, regardless of the shoulder abduction load. In stroke patients, contralesional cortical activity quickly and progressively rose in premotor and primary motor cortices as shoulder abduction loading, and the synergy expression increased too. Conversely, the subjects without neurological injury showed a decreased cortical activity in these regions as shoulder abduction loading increased. These findings can be interpreted as an adaptive strategy of recruiting contralesional motor resources for preserving low-level function at the cost of fine motor control. Table5summarizes the main features of each above-mentioned study.
Table 5. Overview of the included papers about stroke. Stroke
Author Method Number of EEGElectrodes Head Model LORETA sLORETA eLORETA
Cuspineda (2009) [65] X 64 individual
Fang (2015) [66] X 64 template
Mcpherson (2018) [67] X 160 individual
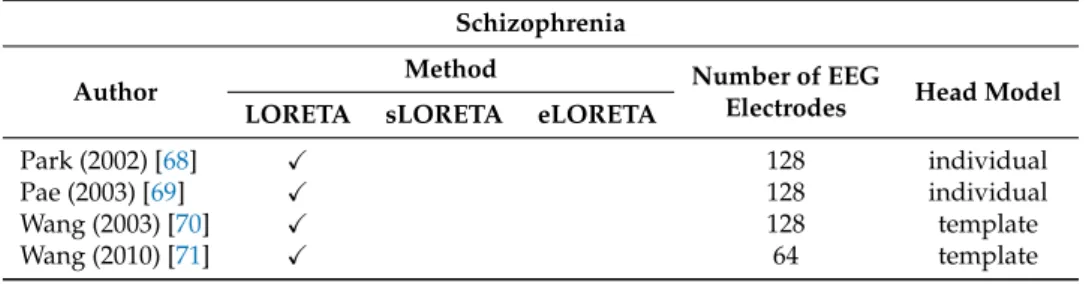
4.6. Schizophrenia
Schizophrenia is a chronic mental disorder characterized by psychotic behaviors, deficits of normal responses to emotions and cognitive impairment. ERPs have been widely employed for investigating schizophrenia. In particular, the studies we reviewed analyzed the MMN and the P300 components.
In Reference [68], the authors investigated the source localization of the MMN, produced by an auditory deviant stimulus. A 128-channel system was used for recording the EEGs from 14 schizophrenic patients and 14 controls. The MMN source reconstruction by LORETA was performed after matching the electrode positions with individual MRI. The statistical parametric mapping revealed a significant decrease of MMN current density for patients group in the left superior temporal gyrus and the left inferior parietal lobule. A similar study (individual head model, 128 electrodes) was conducted in Reference [69], but in this case the P300 component was examined. The statistical analysis showed a P300 current density reduction for schizophrenic patients in the left medial temporal area and in the left inferior parietal area, whereas in the left prefrontal and right orbitofrontal the current density increased. It was also found that current density in the left parietotemporal area was negatively
correlated with the Positive and Negative Syndrome Scale (PANSS) total scores, a scale which measures the symptom severity of schizophrenia. Wang and colleagues [70] explored the P300 component, too. Thirteen patients and twenty controls were enrolled and performed the auditory oddball paradigm. A high-density system made up of 128 electrodes was employed for recording the EEGs. The source reconstruction estimated by LORETA showed that the neural generators in healthy subjects extended over the cortex, including bilateral frontal, parietal and temporal lobes. LORETA analysis also revealed a statistically significant reduction in the P300 current density in patients group as compared to controls. In particular, the aforementioned decrease was detected in the left fronto-temporal cortex, as reported in previous studies. A few years later, the same author conducted a study with the same method but, unlike his previous research, drug-naive first episode schizophrenia patients were considered, using just 64 electrodes for recording the EEGs [71]. The source distribution in controls was consistent with the outcome of Wang’s previous study. As for the comparison between the two groups, there was a statistically significant reduced P300 current density in the patient group especially over the left insula, left superior temporal gyrus and left postcentral gyrus. Moreover, the P300 current density over the above-mentioned brain regions showed an inverse correlation with the patients’ total PANSS scores. Table6summarizes the main features of each above-mentioned study.
Table 6. Overview of the included papers about schizophrenia. Schizophrenia
Author Method Number of EEGElectrodes Head Model LORETA sLORETA eLORETA
Park (2002) [68] X 128 individual
Pae (2003) [69] X 128 individual
Wang (2003) [70] X 128 template
Wang (2010) [71] X 64 template
5. Discussion and Conclusions
The identification of brain active sources from noninvasive measurements has been a widely explored matter and led to the development of several EEG source localization techniques over the past decades. Generally speaking, first of all the source reconstruction is deeply affected by EEGs pre-processing stage, which includes artifacts removal, reference electrode issue, EEGs epoch duration [72].
In our work, we reviewed the research which employed the methods belonging to the LORETA family combined with HD-EEGs. The analysis of the included papers reveals some aspects to be discussed. As for the clinical application, LORETA algorithms have been used especially in epilepsy, resulting in a valid method for the localization of the epileptogenic zones. In the case of epilepsy, the findings were confirmed by other brain imaging techniques and positive clinical outcomes [48–55]. Conversely, the works not related to epilepsy provided results which were consistent with the previous findings but not corroborated by other brain imaging techniques. As for the methodology, many works show a peculiarity: although at the time of writing it was proved that both sLORETA and eLORETA outperformed LORETA, the most used algorithm was LORETA. So, it could be interesting to carry out new studies for verifying if the use of either sLORETA or eLORETA improves farther the localization accuracy. The head model used for the investigation represents another crucial issue in source reconstruction. Using a realistic head model for each subject based on personal MRI images is a recommended choice for improving the localization accuracy. In all reviewed papers about epilepsy, except for Reference [52], an individual head model was employed. As for the remaining papers, the individual head model was utilized just in a few cases. Moreover, for the included works, the number of electrodes of the EEG recording systems vary from 57 to 256. More detailed studies could be useful to figure out what is the ideal number of sensors relating to the clinical objective. Tables1–6showed the method, the number of electrodes and the head model employed for each paper.
From the above discussion, arises that combining LORETA with HD-EEGs has provided promising results, especially in the treatment of epilepsy. Farther investigations are needed in order to enhance the localization accuracy and validate the results deriving from source reconstruction. Finally, coping with the above-mentioned limitations, LORETA applied to HD-EEGs could become an even more valuable tool for noninvasive clinical evaluation in the field of applied neuroscience.
Author Contributions: resources, S.D. and N.M.; writing—original draft preparation, S.D.; writing—review and
editing, F.L.F. and F.C.M.; visualization, S.D.; supervision, F.L.F. All authors have read and agreed to the published version of the manuscript.
Funding: This research received no external funding.
Conflicts of Interest: The authors declare no conflict of interest. References
1. Lenartowicz, A.; Poldrack, R. Brain Imaging; Elsevier: Amsterdam, The Netherlands, 2010.
2. Jatoi, M.A.; Kamel, N.; Malik, A.S.; Faye, I.; Begum, T. A survey of methods used for source localization using EEG signals. Biomed. Signal Process. Control 2014, 11, 42–52. [CrossRef]
3. Tudor, M.; Tudor, L.; Tudor, K.I. Hans Berger (1873-1941)—The History of Electroencephalography. J. Croatian Acad. Med. Sci. 2005, 59, 307–313.
4. Wolters, C.H.; Anwander, A.; Tricoche, X.; Weinstein, D.; Koch, M.A.; Macleod, R.S. Influence of tissue conductivity anisotropy on EEG/MEG field and return current computation in a realistic head model: A simulation and visualization study using high-resolution finite element modeling. NeuroImage 2006, 30, 813–826. [CrossRef] [PubMed]
5. Islam, M.K.; Rastegarnia, A.; Yang, Z. Methods for artifact detection and removal from scalp EEG: A review. Neurophysiol. Clin./Clin. Neurophysiol. 2016, 46, 287–305. [CrossRef] [PubMed]
6. Nunez, P.L.; Srinivasan, R.; Westdorp, A.F.; Wijesinghe, R.S.; Tucker, D.M.; Silberstein, R.B.; Cadusch, P.J. EEG coherency: I: Statistics, reference electrode, volume conduction, Laplacians, cortical imaging, and interpretation at multiple scales. Electroencephalogr. Clin. Neurophysiol. 1997, 103, 499–515. [CrossRef] 7. Chella, F.; Pizzella, V.; Zappasodi, F.; Marzetti, L. Impact of the reference choice on scalp EEG connectivity
estimation. J. Neural Eng. 2016, 13, 036016. [CrossRef]
8. Bertrand, O.; Perrin, F.; Pernier, J. A theoretical justification of the average reference in topographic evoked potential studies. Electroencephalogr. Clin. Neurophysiol./Evoked Potentials Sect. 1985, 62, 462–464. [CrossRef] 9. Jasper, H.H. The ten-twenty electrode system of the International Federation. Electroencephalogr.
Clin. Neurophysiol. 1958, 10, 370–375.
10. Malmivuo, P.; Malmivuo, J.; Plonsey, R. Bioelectromagnetism: Principles and Applications of Bioelectric and Biomagnetic Fields; Oxford University Press: New York, NY, USA, 1995.
11. Levin, K.; Chauvel, P. High-resolution EEG. In Clinical Neurophysiology: Basis and Technical Aspects: Handbook of Clinical Neurology Series; Elsevier: Amsterdam, The Netherlands, 2019; p. 185.
12. Srinivasan, R.; Tucker, D.M.; Murias, M. Estimating the spatial Nyquist of the human EEG. Behav. Res. Methods Instrum. Comput. 1998, 30, 8–19. [CrossRef]
13. Chatrian, G.; Lettich, E.; Nelson, P. Ten percent electrode system for topographic studies of spontaneous and evoked EEG activities. Am. J. EEG Technol. 1985, 25, 83–92. [CrossRef]
14. Spitzer, A.R.; Cohen, L.G.; Fabrikant, J.; Hallett, M. A method for determining optimal interelectrode spacing for cerebral topographic mapping. Electroencephalogr. Clin. Neurophysiol. 1989, 72, 355–361. [CrossRef] 15. Gevins, A.; Brickett, P.; Costales, B.; Le, J.; Reutter, B. Beyond topographic mapping: Towards
functional-anatomical imaging with 124-channel EEGs and 3-D MRIs. Brain Topogr. 1990, 3, 53–64. [CrossRef] [PubMed] 16. Tucker, D.M. Spatial sampling of head electrical fields: The geodesic sensor net. Electroencephalogr.
Clin. Neurophysiol. 1993, 87, 154–163. [CrossRef]
17. Freeman, W.J.; Holmes, M.D.; Burke, B.C.; Vanhatalo, S. Spatial spectra of scalp EEG and EMG from awake humans. Clin. Neurophysiol. 2003, 114, 1053–1068. [CrossRef]
18. Mammone, N.; De Salvo, S.; Ieracitano, C.; Marino, S.; Cartella, E.; Bramanti, A.; Giorgianni, R.; Morabito, F.C. Compressibility of High-Density EEG Signals in Stroke Patients. Sensors 2018, 18, 4107. [CrossRef] [PubMed]
19. Mammone, N.; De Salvo, S.; Bonanno, L.; Ieracitano, C.; Marino, S.; Marra, A.; Bramanti, A.; Morabito, F.C. Brain network analysis of compressive sensed high-density EEG signals in AD and MCI subjects. IEEE Trans. Ind. Inf. 2018, 15, 527–536. [CrossRef]
20. Oostenveld, R.; Praamstra, P. The five percent electrode system for high-resolution EEG and ERP measurements. Clin. Neurophysiol. 2001, 112, 713–719. [CrossRef]
21. Baillet, S. Forward and inverse problems of MEG/EEG. Encycl. Comput. Neurosci. 2015, 1226–1233._529-1. [CrossRef]
22. Lantz, G.; De Peralta, R.G.; Spinelli, L.; Seeck, M.; Michel, C. Epileptic source localization with high density EEG: how many electrodes are needed? Clin. Neurophysiol. 2003, 114, 63–69. [CrossRef]
23. Michel, C.M.; Murray, M.M.; Lantz, G.; Gonzalez, S.; Spinelli, L.; de Peralta, R.G. EEG source imaging. Clin. Neurophysiol. 2004, 115, 2195–2222. [CrossRef]
24. Staljanssens, W.; Strobbe, G.; Van Holen, R.; Birot, G.; Gschwind, M.; Seeck, M.; Vandenberghe, S.; Vulliémoz, S.; van Mierlo, P. Seizure onset zone localization from ictal high-density EEG in refractory focal epilepsy. Brain Topogr. 2017, 30, 257–271. [CrossRef] [PubMed]
25. Song, J.; Davey, C.; Poulsen, C.; Luu, P.; Turovets, S.; Anderson, E.; Li, K.; Tucker, D. EEG source localization: Sensor density and head surface coverage. J. Neurosci. Methods 2015, 256, 9–21. [CrossRef] [PubMed] 26. Grech, R.; Cassar, T.; Muscat, J.; Camilleri, K.P.; Fabri, S.G.; Zervakis, M.; Xanthopoulos, P.; Sakkalis, V.;
Vanrumste, B. Review on solving the inverse problem in EEG source analysis. J. Neuroeng. Rehabilit. 2008, 5, 25. [CrossRef] [PubMed]
27. Hämäläinen, M.S.; Ilmoniemi, R.J. Interpreting magnetic fields of the brain: Minimum norm estimates. Med. Biol. Eng. Comput. 1994, 32, 35–42. [CrossRef]
28. Pascual-Marqui, R.D.; Michel, C.M.; Lehmann, D. Low resolution electromagnetic tomography: A new method for localizing electrical activity in the brain. Int. J. Psychophysiol. 1994, 18, 49–65. [CrossRef] 29. Talairach, J.; Tournoux, P. Co-Planar Stereotaxic Atlas of the Human Brain; Theime: New York, NY, USA, 1988. 30. Pascual-Marqui, R.D. Review of methods for solving the EEG inverse problem. Int. J. Bioelectromagn. 1999,
1, 75–86.
31. Tong, S.; Thakor, N.V. Quantitative EEG Analysis Methods and Clinical Applications; Artech House: Norwood, MA, USA, 2009.
32. Tikhonov, A.N.; Arsenin, V.Y. Solutions of Ill-Posed Problems; WH Winston: Washington, DC, USA, 1977; Volume 330.
33. Dale, A.M.; Liu, A.K.; Fischl, B.R.; Buckner, R.L.; Belliveau, J.W.; Lewine, J.D.; Halgren, E. Dynamic statistical parametric mapping: Combining fMRI and MEG for high-resolution imaging of cortical activity. Neuron
2000,26, 55–67. [CrossRef]
34. Pascual-Marqui, R.D. Standardized low-resolution brain electromagnetic tomography (sLORETA): Technical details. Methods Find Exp. Clin. Pharmacol. 2002, 24, 5–12.
35. Pascual-Marqui, R.D. Discrete, 3D distributed, linear imaging methods of electric neuronal activity. Part 1: Exact, zero error localization. arXiv 2007, arXiv:0710.3341.
36. Jatoi, M.A.; Kamel, N.; Malik, A.S.; Faye, I. EEG based brain source localization comparison of sLORETA and eLORETA. Australas. Phys. Eng. Sci. Med. 2014, 37, 713–721. [CrossRef]
37. Shigemura, J.; Yoshino, A.; Kobayashi, Y.; Takahashi, Y.; Nomura, S. Spatiotemporal differences between cognitive processes of spatially possible and impossible objects: A high-density electrical mapping study. Cognit. Brain Res. 2004, 18, 301–305. [CrossRef]
38. Kim, Y.Y.; Lee, B.; Shin, Y.W.; Kwon, J.S.; Kim, M.S. Activity of left inferior frontal gyrus related to word repetition effects: LORETA imaging with 128-channel EEG and individual MRI. Neuroimage 2006, 29, 712–720. [CrossRef] [PubMed]
39. Brown, C.A.; Seymour, B.; Boyle, Y.; El-Deredy, W.; Jones, A.K. Modulation of pain ratings by expectation and uncertainty: Behavioral characteristics and anticipatory neural correlates. Pain 2008, 135, 240–250. [CrossRef] [PubMed]
40. Lamm, C.; White, L.K.; McDermott, J.M.; Fox, N.A. Neural activation underlying cognitive control in the context of neutral and affectively charged pictures in children. Brain Cognit. 2012, 79, 181–187. [CrossRef] [PubMed]
41. Lamm, C.; Walker, O.L.; Degnan, K.A.; Henderson, H.A.; Pine, D.S.; McDermott, J.M.; Fox, N.A. Cognitive control moderates early childhood temperament in predicting social behavior in 7-year-old children: An ERP study. Dev. Sci. 2014, 17, 667–681. [CrossRef] [PubMed]
42. Meyer, G.F.; Harrison, N.R.; Wuerger, S.M. The time course of auditory–visual processing of speech and body actions: Evidence for the simultaneous activation of an extended neural network for semantic processing. Neuropsychologia 2013, 51, 1716–1725. [CrossRef]
43. Tremblay, E.; Vannasing, P.; Roy, M.S.; Lefebvre, F.; Kombate, D.; Lassonde, M.; Lepore, F.; McKerral, M.; Gallagher, A. Delayed early primary visual pathway development in premature infants: High density electrophysiological evidence. PLoS ONE 2014, 9, e107992. [CrossRef] [PubMed]
44. Tsolaki, A.; Kosmidou, V.; Hadjileontiadis, L.; Kompatsiaris, I.Y.; Tsolaki, M. Brain source localization of MMN, P300 and N400: Aging and gender differences. Brain Res. 2015, 1603, 32–49. [CrossRef]
45. Tsolaki, A.C.; Kosmidou, V.E.; Kompatsiaris, I.Y.; Papadaniil, C.; Hadjileontiadis, L.; Tsolaki, M. Age-induced differences in brain neural activation elicited by visual emotional stimuli: A high-density EEG study. Neuroscience 2017, 340, 268–278. [CrossRef]
46. Commission on Classification and Terminology of the International League Against Epilepsy. Proposal for revised classification of epilepsies and epileptic syndromes. Epilepsia 1989, 30, 389–399. [CrossRef] 47. Maleki, L.; Kooraneh, A.E.; Derakhshi, H.T. Types of Epilepsies and Findings EEG-LORETA about Epilepsy.
World Acad. Sci. Eng. Technol. Int. J. Soc. Behav. Educ. Econ. Bus. Ind. Eng. 2015, 9, 2382–2390.
48. Wang, G.; Worrell, G.; Yang, L.; Wilke, C.; He, B. Interictal spike analysis of high-density EEG in patients with partial epilepsy. Clin. Neurophysiol. 2011, 122, 1098–1105. [CrossRef] [PubMed]
49. Sohrabpour, A.; Lu, Y.; Kankirawatana, P.; Blount, J.; Kim, H.; He, B. Effect of EEG electrode number on epileptic source localization in pediatric patients. Clin. Neurophysiol. 2015, 126, 472–480. [CrossRef] [PubMed]
50. Bocquillon, P.; Dujardin, K.; Betrouni, N.; Phalempin, V.; Houdayer, E.; Bourriez, J.L.; Derambure, P.; Szurhaj, W. Attention impairment in temporal lobe epilepsy: A neurophysiological approach via analysis of the P300 wave. Hum. Brain Map. 2009, 30, 2267–2277. [CrossRef] [PubMed]
51. Birot, G.; Spinelli, L.; Vulliémoz, S.; Mégevand, P.; Brunet, D.; Seeck, M.; Michel, C.M. Head model and electrical source imaging: A study of 38 epileptic patients. Neuroimage Clin. 2014, 5, 77–83. [CrossRef] [PubMed]
52. Feng, R.; Hu, J.; Pan, L.; Wu, J.; Lang, L.; Jiang, S.; Gu, X.; Guo, J.; Zhou, L. Application of 256-channel dense array electroencephalographic source imaging in presurgical workup of temporal lobe epilepsy. Clin. Neurophysiol. 2016, 127, 108–116. [CrossRef]
53. Akdeniz, G. Electrical source localization by LORETA in patients with epilepsy: Confirmation by postoperative MRI. Ann. Indian Acad. Neurol. 2016, 19, 37. [CrossRef]
54. Nemtsas, P.; Birot, G.; Pittau, F.; Michel, C.M.; Schaller, K.; Vulliemoz, S.; Kimiskidis, V.K.; Seeck, M. Source localization of ictal epileptic activity based on high-density scalp EEG data. Epilepsia 2017, 58, 1027–1036. [CrossRef]
55. Kuo, C.C.; Tucker, D.M.; Luu, P.; Jenson, K.; Tsai, J.J.; Ojemann, J.G.; Holmes, M.D. EEG source imaging of epileptic activity at seizure onset. Epilepsy Res. 2018, 146, 160–171. [CrossRef]
56. Styliadis, C.; Kartsidis, P.; Paraskevopoulos, E.; Ioannides, A.A.; Bamidis, P.D. Neuroplastic effects of combined computerized physical and cognitive training in elderly individuals at risk for dementia: An eLORETA controlled study on resting states. Neural Plast. 2015, 2015. [CrossRef]
57. Tsolaki, A.C.; Kosmidou, V.; Kompatsiaris, I.Y.; Papadaniil, C.; Hadjileontiadis, L.; Adam, A.; Tsolaki, M. Brain source localization of MMN and P300 ERPs in mild cognitive impairment and Alzheimer’s disease: A high-density EEG approach. Neurobiol. Aging 2017, 55, 190–201. [CrossRef]
58. Gu, L.; Chen, J.; Gao, L.; Shu, H.; Wang, Z.; Liu, D.; Yan, Y.; Li, S.; Zhang, Z. Deficits of visuospatial working memory and executive function in single-versus multiple-domain amnestic mild cognitive impairment: A combined ERP and sLORETA study. Clin. Neurophysiol. 2019, 130, 739–751. [CrossRef] [PubMed] 59. Tait, L.; Stothart, G.; Coulthard, E.; Brown, J.T.; Kazanina, N.; Goodfellow, M. Network Substrates of
Cognitive Impairment in Alzheimer’s Disease. Clin. Neurophysiol. 2019, 130, 1581–1595. [CrossRef] [PubMed]
60. Pizzagalli, D.A.; Peccoralo, L.A.; Davidson, R.J.; Cohen, J.D. Resting anterior cingulate activity and abnormal responses to errors in subjects with elevated depressive symptoms: A 128-channel EEG study. Hum. Brain Map. 2006, 27, 185–201. [CrossRef] [PubMed]
61. Auerbach, R.P.; Stewart, J.G.; Stanton, C.H.; Mueller, E.M.; Pizzagalli, D.A. Emotion-processing biases and resting eeg activity in depressed adolescents. Depress. Anxiety 2015, 32, 693–701. [CrossRef]
62. Auerbach, R.P.; Stanton, C.H.; Proudfit, G.H.; Pizzagalli, D.A. Self-referential processing in depressed adolescents: A high-density event-related potential study. J. Abnorm. Psychol. 2015, 124, 233. [CrossRef] 63. Whitton, A.E.; Kakani, P.; Foti, D.; Van’t Veer, A.; Haile, A.; Crowley, D.J.; Pizzagalli, D.A. Blunted
neural responses to reward in remitted major depression: A high-density event-related potential study. Biol. Psychiatry Cognit. Neurosci. Neuroimag. 2016, 1, 87–95. [CrossRef]
64. Whitton, A.E.; Deccy, S.; Ironside, M.L.; Kumar, P.; Beltzer, M.; Pizzagalli, D.A. Electroencephalography source functional connectivity reveals abnormal high-frequency communication among large-scale functional networks in depression. Biol. Psychiatry Cognit. Neurosci. Neuroimag. 2018, 3, 50–58. [CrossRef]
65. Cuspineda, E.; Machado, C.; Virues, T.; Martínez-Montes, E.; Ojeda, A.; Valdés, P.; Bosch, J.; Valdes, L. Source analysis of alpha rhythm reactivity using LORETA imaging with 64-channel EEG and individual MRI. Clin. EEG Neurosci. 2009, 40, 150–156. [CrossRef]
66. Fang, Y.; Daly, J.J.; Hansley, J.; Yao, W.X.; Yang, Q.; Sun, J.; Hvorat, K.; Pundik, S.; Yue, G.H. Hemispheric activation during planning and execution phases in reaching post stroke: A consort study. Medicine 2015, 94, e307. [CrossRef]
67. McPherson, J.G.; Chen, A.; Ellis, M.D.; Yao, J.; Heckman, C.; Dewald, J.P. Progressive recruitment of contralesional cortico-reticulospinal pathways drives motor impairment post stroke. J. Physiol. 2018, 596, 1211–1225. [CrossRef]
68. Park, H.J.; Kwon, J.S.; Youn, T.; Pae, J.S.; Kim, J.J.; Kim, M.S.; Ha, K.S. Statistical parametric mapping of LORETA using high density EEG and individual MRI: Application to mismatch negativities in schizophrenia. Hum. Brain Map. 2002, 17, 168–178. [CrossRef]
69. Pae, J.S.; Kwon, J.S.; Youn, T.; Park, H.J.; Kim, M.S.; Lee, B.; Park, K.S. LORETA imaging of P300 in schizophrenia with individual MRI and 128-channel EEG. Neuroimage 2003, 20, 1552–1560. [CrossRef] [PubMed]
70. Wang, J.; Hiramatsu, K.I.; Hokama, H.; Miyazato, H.; Ogura, C. Abnormalities of auditory P300 cortical current density in patients with schizophrenia using high density recording. Int. J. Psychophysiol. 2003, 47, 243–253. [CrossRef]
71. Wang, J.; Tang, Y.; Li, C.; Mecklinger, A.; Xiao, Z.; Zhang, M.; Hirayasu, Y.; Hokama, H.; Li, H. Decreased P300 current source density in drug-naive first episode schizophrenics revealed by high density recording. Int. J. Psychophysiol. 2010, 75, 249–257. [CrossRef] [PubMed]
72. Michel, C.M.; Brunet, D. EEG source imaging: A practical review of the analysis steps. Front. Neurol. 2019, 10, 325. [CrossRef]
c 2020 by the authors. Licensee MDPI, Basel, Switzerland. This article is an open access article distributed under the terms and conditions of the Creative Commons Attribution (CC BY) license (http://creativecommons.org/licenses/by/4.0/).
(DPR 28 DICEMBRE 2000, N. 445, ARTT. 46 E SEGG. E LEGGE NOVEMBRE 2011, N. 183, ART. 15)
Il sottoscritto LA FORESTA FABIO nato a Messina il 30/01/1975 e residente in via Panoramica SLT Fosse 11/A 98168 Messina, C.F. LFR FBA 75A30 F158A,
DICHIARA
che la pubblicazione scientifica prodotta in copia è conforme all’originale.
CONSAPEVOLE CHE CHIUNQUE RILASCIA DICHIARAZIONI MENDACI E’ PUNITO AI SENSI DEL CODICE PENALE E DELLE LEGGI SPECIALI IN MATERIA, AI SENSI E PER GLI EFFETTI DEGLI ART. 75 E 76 DPR 445/2000.
CONSAPEVOLE DI QUANTO PREVISTO DALL’ART. 13 DEL D.LGS 196/03 CODICE IN MATERIA DI PROTEZIONE DEI DATI PERSONALI.
Si allega copia di documento di identità in corso di validità.
Messina, 05/11/2020
![Figure 1. Electrode location on the scalp according to the 10–20 system [ 10 ]. On the (A): lateral view of the skull](https://thumb-eu.123doks.com/thumbv2/123dokorg/5033090.56144/3.892.204.690.210.477/figure-electrode-location-scalp-according-lateral-view-skull.webp)