Alma Mater Studiorum – University of Bologna
School of Engineering and Architecture
Department of Electrical, Electronic and Information Engineering (DEI)
Master Course in
Electrical Energy Engineering
Thesis in:
APPLIED MEASUREMENTS FOR POWER SYSTEMS
Metrological characterisation of Low Power
Voltage Transformers by using impulse
response analysis
Student:
Saeid Homeili
Supervisor:
Prof. Lorenzo Peretto
Academic year: 2019/2020 JULY 2020
2
Acknowledgment:
To my beloved wife and son which has always supported me…
To my bleeding home Iran which will be in my heart forever…
To Italy which gave me this golden opportunity through the scholarship
program of the Italian Ministry of Education Affairs…
I would like to express my special thanks of gratitude to my supervisor
Prof. Lorenzo Peretto who helped me to do this thesis and to obtain
new knowledge and special thanks to my best friend Dr. Abass Ghaderi
who help me to find answers to do this thesis.
3
INDEX
INTRODUCTION
CHAPTER 1
1 STATE OF THE ART ... 9
1.1 The necessity of voltage and current measurement ... 9
1.2 Modeling and identifying of LPITs ... 10
1.3 Impulse response application background ... 12
CHAPTER 2
2 LITERATURE REVIEW ... 152.1 Voltage and current measurement ... 15
2.2 conventional current transformer (CT) ... 15
2.3 Main features of current transformers... 16
2.4 Voltage transformer (V.T.) ... 17
2.5 Capacitor voltage transformer (C.V.T.) ... 18
2.6 The new generation of LPITs ... 22
2.7 Technical consideration ... 23
2.8 Accuracy in LPVT and LPCT ... 24
2.9 New generation of medium current transformer (LPCT) ... 25
2.10 The new generation of medium voltage transformer (LPVT) ... 27
Passive LPVT ... 27
Active LPVT ... 29
2.11 LPVT (smart terminals) ... 30
2.12 Insulations consideration ... 31
2.13 Dielectric permittivity in LPITs ... 31
The dielectric of a capacitor ... 33
Specification factors in a capacitor ... 34
Dissipation factor and loss of tangent definitions ... 35
2.14 Frequency dependency to the permittivity ... 35
CHAPTER 3
3 PROCEDURE ... 403.1 The dynamic model of LPVT ... 41
3.2 Unit impulse function ... 43
Sampling property ... 43
3.3 Study of impulse response system identification ... 44
4
Convolution integral ... 47
FFT and IFFT concept ... 50
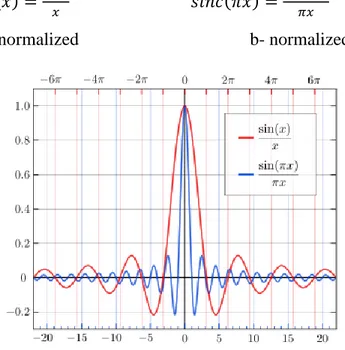
3.5 Sinc function as an impulse signal ... 51
3.6 Sinc function properties ... 52
3.7 Power quality frequency range ... 56
3.8 Design the sinc signal ... 57
DTFT ... 57
Bandlimited pulse (window pulse) ... 58
Sinc calculation ... 61
3.9 Measured parameters and tests ... 66
Sinc response test ... 67
Sweep frequency response test ... 68
3.10 The transfer function of LPVT ... 68
CHAPTER 4
4 EXPERIMENTAL TEST ... 714.1 Setup test ... 71
Arbitrary Waveform ... 73
Data Acquisition Chain ... 75
4.2 Measurement setup ... 77
4.3 Approval and validation tests... 79
Sinc response test in different voltages validation ... 79
Harmonic tests validation ... 80
CHAPTER 5
5 RESULTS ... 825.1 Results of a new method of sinc response ... 82
SR test results ... 82
Sweep frequency test results and comparison ... 83
5.2 h(t) transfer function ... 84
5.3 Approving h(t) accuracy ... 86
Result test under different voltage and frequencies ... 86
5.4 Results of harmonics test and validation of h(t) ... 88
Sinusoidal harmonic results ... 89
5.5 Validation of h(t)... 91
6 CONCLUSION ... 94
5
Introduction
The evolution of smart grids and the broad application of renewables and medium voltage (MV) industries have created a need for the extensive use of current and voltage measurements for the proper management of power networks. Electrical power grids will require real-time capable control and monitoring systems to ensure stability under increasingly complex and challenging conditions. The generation of analog measurement and control systems in power substations are approaching the end of their useful lifespan. More often their replacement is based on digital substation automation solutions and the use of new technologies to perform more efficiently. In distribution, measurements and control of the power network, require the use of advanced, low-power sensing technologies instead of traditional solutions using iron-core instrument transformers, due to their physical limitations and other reasons. Moreover, Instrument Transformers are experiencing special attention by utilities and private customers for different important reasons.
A generally accepted propose is the installation of a low-power current transformer (LPCT) (current sensor) and a low-power voltage transformer (LPVT) (voltage sensor) due to accurate operation, high bandwidth, small size and compatibility with computer network in digital substation automation. The application of an LPCT is not so demanding from an electrical field point of view and different technologies can even be used. Nevertheless, the application of an LPVT needs to access the MV point, which is a challenging task to separable connectors due to the high level of electric field strength in the under-voltage area.
The requirements of LPVTs are described in the existing standard IEC 60044-7, released in 1999, and a new set of standards for the IEC 61869 standard family to cover the latest needs and requirements for both active and passive LPVTs are introduced in recent years. These standards describe a set of tests. LPVTs have some test requirements that apply to each particular product. These requirements are not always aligned, as they demand different tests, different test values, or different acceptance criteria, which depend on other specific requirements agreed upon between the manufacturer and purchaser. On the other hand, the achieved results of these tests can not cover all the needs to characterize LPVT, specifically covering accuracy requirements or give valuable identity which capable to introduce LPVT behavior in different conditions. Also, many of these tests are time-consuming and are not always aligned.
6
Therefore, this thesis presents a new approach in dealing with this issue and proposes determining the impulse response of LPVT, purposing to find transfer function (h(t)) which contains most electrical characteristics of LPVTsas a dynamic system. To characterize any dynamic system impulse Response is a well-known approach in literature to identify the behavior of LPVTs, This thesis also suggests using sinc function as an impulse signal to achieve response in determining frequency band. Additionally, the proposed approach has been approved and validated by extensive, practical testing of passive LPVT in design experimental setup in laboratory and computer simulations, the results of these tests passed by comparing results with simulation and standard. Finally, the recommended method and test approaches and criteria can be proposed improvement of future IEC 61896-11 standards.
The thesis is structured as follows:
1. In Chapter One, the necessity of voltage and current is expressed. Importance of modeling and types of modeling for system identification are mentioned, some application of using impulse response in some different surveys are introduced.
2. In Chapter Two some features and definitions about the conventional CT, PT, CVT, and in the following LPCT and passive and active LPVT are explained, also structure of capacitor LPVT and relevant relation and impact of dielectric permittivity on frequency response in a capacitor is mentioned.
3. In Chapter Three, it is tried to define the LPVT model. A proper dynamic system by using control theory and signal system concept is expressed. Application of impulse response in identifying and characterization in some articles and surveys which have been studied up to now are explained. In the following the new method using sinc signal to apply as an impulse signal and also an analytical approach to design sinc signal in power quality frequency domain is expressed. Moreover, all procedure tests which are designed to approve this method and tests for validation of the sinc response and validation of LPVT transfer function h(t) are explained at the end of this chapter.
4. In chapter Four experimental setup tests and all utilize apparatus and components and also the software is explained, relevant schematics and setup tests are depicted. All processes of tests and simulation due to the approval and validation of the results are explained.
5. In chapter Five the result of sinc response and sweep frequency response are explained and analyzed. Moreover, to approve the accuracy of the purpose method the result of sinc response to different voltages in different frequencies is compared with simulation results. Test results by the different sinusoidal signal which are contaminated with different harmonics are shown and recorded and admitted by comparing with experimental test. In
7
the end, the simulation results of accuracy of LPVT transfer function h(t) are validated by comparing simulation results with standard value for sinusoidal harmonics, all results are depicted via relevant diagrams, charts, and tables.
8
CHAPTER 1
9
1
STATE OF THE ART
In modern society, in this age of advanced technology, using a complex chain of electrical and electronic systems should inevitably have one hundred present integrity. A failure is considered unacceptable from costumers' perspective, and any implications or consequences due to failure have been significant in most of all aspects of modern life. Therefore, in various engineering applications that involved electrical transmission and distribution systems, for instance: industries, smart grid, distribution generation, and power quality, etc. There are committed to seek and develop advanced technology which guarantees better performance and efficiency for the normal operation of various interconnected electrical networks and systems.
One of the major system that mentioned is the system in which efforts to measure accurate and real-time electrical parameters. Protection relays, power meters, and control units in up-to-date switchgear are built with digital technology. The modern secondary equipment does not need the high power output of the instrument transformers (ITs) as this was necessary for electromechanical relays. As a consequence, the requirements for (ITs) is changed. Requests for universal use of (ITs) for measurement, protection, and even metering applications and the reduction of the overall costs of switchgear are common. Further requirements for modern (ITs) besides reliability and safety are easy handling, the reduction of the expenditure of work during planning and installation, and short lead times.[1] By using established and highly proven components such as iron cores, capacitors, resistors, and quadrat pole shunt it is possible to produce sensors which are fulfilling all the requirements. Compared with traditional (ITs), low power (ITs) have less overall costs, lower weight, and are immune to electromagnetic interference in the substation. One low power (IT) can be used for metering and protection purposes. For that reason, the number of different types for all applications can be dramatically reduced in a wide range of primary current.
Nowadays digital instruments, apparatuses, and relays with inputs for low power (ITs) are available from several relay manufacturers. By using such relays together with the wide measuring range of low power (ITs) users get a system with high reliability, functionality, and flexibility. Considering short review of typical current and voltage sensors gives clear aspects of (ITs) sensors. [2]
1.1
The necessity of voltage and current measurement
CT & PT are called the instrument transformer, because those are used to assist the measuring instruments for the measurement of electrical parameters like current, voltage, frequency,
10
power factor, active power(MW), reactive power(MVAR), etc. of high voltage system. The high current & high voltage of a high voltage system cannot be directly fed to a measuring instrument for measurement purposes and protection chains, as the instrument will be damaged or burnt. So the high current/voltage is reduced to a reasonably small value i.e. 5 amp, or 1 amp, in case of current transformer and 110 volts, in case of a voltage transformer. These are called the secondary current or voltage which is directly proportional to the primary current or voltage. This secondary current or voltage is conveniently fed to the measuring instruments and relays, which in turn can measure the primary parameters with a suitable scale. Moreover, it enhances safety for the personnel at the low voltage control and protection side and makes it possible for standardization of instruments, relays, power quality meters, load flow calculation, and PMU system. And also, attain other quantities that are involved with control, estimate, planning, maintenance, and operation on generation in power plants, transmission networks, and distribution systems. Conventional steady-state analysis of power networks relies on the so-called bus/branch model. Accordingly, the active and reactive power flows through switches and circuit breakers are treated as state variables along with the complex voltage at the network nodes, and also the case of real-time modeling, where the current trend is towards the representation of parts of the power network at the bus-section. The search of the correct network topology requires the consideration of voltage and current measurements using (LPITs) in nodes and through the branches respectively. [3]
1.2
Modeling and identifying of LPITs
For better reorganization of feature and identify the behavior of (ITs), studying on a clear model of (ITs) as a system can be the main way to analysis of behavior (IT’s) functionality. Modeling is an essential tool for engineers to assess the functions of apparatus and components as dynamic systems. [4]
In control system engineering, system identification methods are used to get appropriate models for the design of prediction algorithms, or simulation. Also in signal processing applications, models obtained by system identification are used for (spectral analysis, fault detection, pattern recognition, adaptive filtering, linear prediction), and other purposes. In recent times, system identification techniques have delivered powerful methods and tools for data-based system modeling. While the theory for identification of linear systems has become very mature, the challenges for the field are in modeling and developing more complex dynamical systems (nonlinear, distributed, hybrid, large scale), and in task-oriented issues
11
(identification for control, diagnosis, etc.).They also have wide applications in non-technical fields such as biology, environmental sciences, and econometrics to develop models for increasing scientific knowledge on the identified object, or prediction and control.[5] In this thesis, it is purposed the develop a dynamic model of (ITs) that has a weighting function that coincides with an estimated sequence.
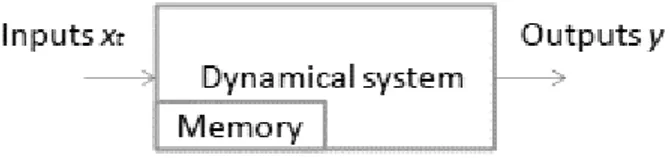
Dynamic systems are described by differential equations. The solution of the differential equation will be able to see the impact of the input, it shows how the variables of the system depend on the independent variable. Through modeling, we have converted our suspension into a system, with input, output, states, and parameters. [6] System identification deals with the problem of constructing the mathematical model of a dynamic system based on a given set of experimental data. To perform a theoretical analysis of the identification methods, it is necessary to introduce assumptions on the data. As it is not necessary to know the system, we will use the system concept only for investigating how different identification methods behave under different circumstances such as the behavior of system interacting to supply impulse signal or step signal.
The purpose of a model is to describe how the various variables of the system relate to each other. The relationship among these variables is called a model of the system. Modeling the system of interest is considered useful in many areas of science as an aid to properly describe the system’s behavior. A good model must reflect all properties of such an unknown system. Several kinds of models can be classified as mental models that do not involve a mathematical formula, graphical models that are also suitable for certain systems using numerical tables and/or plots. Mathematical models which describe how the variables relate to each other in terms of mathematical expressions such as differential and difference equations. The mathematical models are useful in practice because they describe the system’s behavior by mathematical expressions, which are simple to examine and analyze. [6]
In many cases, while dealing with problems related to system identification we deal with parametric models, such models are characterized by a parameter vector, which we denote by . The corresponding model will be denoted M(). When is varied over a set of feasible values we obtain a model structure.
12
Sometimes, we use non-parametric models such as a model that is described by a curve, function, or table. An impulse response is an example of these models which we will study later in detail in this thesis.
The property by which the resulting models are in forms of curves or functions so that an the identification method is known to be a non-parametric method. One of the nonparametric methods which are used is the impulse response. The impulse response of a system is its output when presented with a brief signal, an impulse. While an impulse is a difficult concept to imagine, it represents the limit case of a pulse made infinitely short in time while maintaining its area or integral (thus giving an infinitely high peak). [7]
1.3
Impulse response application background
In literature, there are many studies on the implementation of an impulse response. There can be addressed varied applications and researches which are commented in the following: 1-Test and approve of protection capability oil insulation breakdown in transformer and other apparatus and capability of withstanding extra-high voltages to protect the measurement devices during the high voltage test(partial discharge detection experiments, breakdown, etc.)[8]
2- Frequency response analysis (FRA) is a regular method to detect winding faults in the transformer. According to the kind of excitation source it can be used impulse frequency response analysis (IFRA) and sweep frequency response analysis (SFRA) However, it has been discovered that the test result of IFRA can be heavily influenced by the repetition frequency of input impulse. Besides, the frequency resolution of the test result also needs to be considered. Winding deformations are major faults that occur in the power transformer and Frequency response can be plot as a trend with resonances at several different frequencies, these resonances are produced by the inductance and capacitance of the network. Based on the information of the response trend, especially the frequencies of resonances, small deformation of transformer winding can be detected by imposing the impulse signal to the transformer. The impulse signal has higher amplitude and frequency band than the sinusoidal signal, which means that the signal to noise ratio (SNR) is better and the frequency response curve can reach to frequency higher more than 1MHz, providing more information about the characteristic of the transformer.[9]Moreover, impulse frequency response analysis (IFRA) is feasible for online condition monitoring of power transformer winding deformation and can increase the
13
frequency range of analysis. At present, the Frequency response curves of off-line IFRA methods are mostly solved by Fast Fourier Transform (FFT). [10]
3- by using the method based on Wiener filtering and measurement of the transformer response in the frequency domain using a low-frequency network analyzer it can possible to present a method for Finite-Impulse-Response (FIR) modeling of voltage instrument transformers.[11] 4-by using impulse response which is applying to Instrument Voltage Transformers (VT), it can be capable of analyzing critical behavior such as inaccuracy and ratio error in VT.[12] So, output signals may result in terms of overvoltage able to provoke dangerous dielectric solicitations when subjected to impulse voltages. Furthermore, the accuracy of VT (defined by IEC Standards) only at power frequency doesn’t consider fast impulse response. Under these conditions, the VT may introduce errors in voltage measurements and the transmitted signals may create overvoltage in correspondence of the secondary circuit and by nominal withstand.[13] Additionally, the transformer ratio (peak values) under impulse condition was found to be normally lower (2-3 times) than the nominal value and this error may have negative Consequences also in terms of power quality. [14]
5-Their has been used as finite impulse response (FIR) model for prediction of the process outputs in many studies. In contrast to state-space parameterizations, the FIR model is in a form that can easily be applied in robust predictive control, i.e.[15]
In many science branches and survey phenomenon using an analysis of impulse response is a known tool and also an efficient way to reach an acceptable result. It can be mentioned to impulse response analysis to study and measure parameters of state variables in acoustic spaces or transducers or widespread use in communication science[16],[17].
Just as utilization of impulse response analysis is the so-called method for finding the many answers, and also it is a progress technique to achieve the right behavior of systems in various electrical apparatuses and relevant functions.
This thesis is going to study using impulse response to find out the behavior characteristics and responses of LPVTs to impulse signals. Hence, to a better understanding of characteristics and different current and voltage transformers, it is tried to explain some features and brief mention to introduce conventional CTs, PTs, CVT. Afterward, new generations of LPCTs, LPVTs will be considered.
14
CHAPTER 2
15
2
LITERATURE REVIEW
Interconnected power systems are usually subdivided into different control and security areas. The transmission system operator is the responsible entity for the security of a single control area. Generally, voltage and frequency control and the security level assessment are the main tasks to keep the system in the normal state.
Voltage control of power systems is mainly provided by the generating units. The terminal voltage of generating units is controlled and maintained within specific limits utilizing the automatic voltage regulator (AVR). The frequency of an electric system depends on the active power balance. To control the frequency, the active power balance must be restored. The typical measurement of voltage in terminals and buses and current in branches are utilized to power balance, voltage control and have reliable security of electrical system operating at different voltage levels.
2.1
Voltage and current measurements
Current and voltage transformers (CT/PT) are used in High Voltage (HV) and Medium-voltage (MV) Installations to give an of electrical current to protection relays and units and metering equipment and they are designed to value to provide a current and voltage in its secondary proportional to the current flowing in its primary. CTs are connected in series and protection devices and metering equipment is connected to the secondary of the CT in a series association. And PTs are connected in parallel.
2.2
conventional current transformer (CT)
To better understand CT characteristics and functionality some important features and operational parameters are explained Current and voltage transformers are generally designed in the following standards:
IEC 60044-1 “current transformers”, IEC 60044-2 “inductive voltage transformers” ANSI/IEEE-standard, all other relevant worldwide standards.
16
Fig.2-1 Current transformer in an AIS substation Fig. 2-2 Current transformer in a GIS substation
2.3
Main features of current transformers
There are several features and characteristics introduce by factories according to the application and technical points of view. In this part, the main, well-known and most practical is presented
Rated primary current
The value of the primary current which appears in the designation of the transformer and on which the performance of the current transformer is based.
Rated secondary current
The value of secondary current which appears in the designation of the transformer and on which the performance of the current transformer is based. Typical values of secondary currents are 1 A or 5 A. In the case of transformer differential protection, secondary currents of 1/√3A and 5/√3A is also specified.
Rated burden
The apparent power of the secondary circuit in Volt-amperes expressed at the rated secondary current and a specific power factor (0.8 for almost all standards)
Accuracy class
In the case of metering CT s, accuracy class is typical, 0.2, 0.5, 1, or 3.This means that the errors have to be within the limits specified in the standards for that particular accuracy class. The metering CT has to be accurate from 5% to 20% of the rated primary current, at 25%, and 100% of the rated burden at the specified power factor. In the case of protection CT s, the CT s should pass both the ratio and phase errors at the specified accuracy class, usually 5P or 10P, as well as a composite error at the accuracy limit factor of the CT.
17
Current ratio error
The error with a transformer introduces into the measurement of a current and which arises from the fact that the actual transformation ratio is not equal to the rated transformer ratio. The current error expressed in percentage is given by the formula:
Current error in % = (Ka (Is-Ip)) * 100 / Ip (2.1) Where (Ka) is rated transformation ratio, (Ip) is actual primary current, (Is) is actual secondary current when Ip is flowing under the conditions of measurement.
Knee point voltage
That point on the magnetizing curve (Fig.2-3) where an increase of 10% in the flux density (voltage) causes an increase of 50% in the magnetizing force (current).The ‘Knee Point Voltage’ (Vkp) is defined as the secondary voltage at which an increase of 10% produces an increase in magnetizing current of 50%. It is the secondary voltage above which the CT is near magnetic saturation.
Fig. 2-3
2.4
Voltage transformer (V.T.)
The potential transformer may be defined as an instrument transformer used for the transformation of voltage from a higher value to a lower value. This transformer step down the voltage to a safe limit value which can be easily measured by the ordinary low voltage instrument like a voltmeter, wattmeter and watt-hour meters, etc.
18
Construction of potential transformer
The potential transformer is made with high-quality core operating at low flux density so that the magnetizing current is small. The terminal of the transformer should be designed so that the variation of the voltage ratio with load is minimum and the phase shift between the input and output voltage is also minimum.
The primary winding has a large number of turns, and the secondary winding has a much small number of turns. For reducing the leakage reactance, the co-axial winding is used in the potential transformer. The insulation cost is also reduced by dividing the primary winding into the sections which reduced the insulation between the layers.
Connection of potential transformer
The potential transformer is connected in parallel with the circuit (Fig.2-4). The primary windings of the potential transformer are directly connected to the power circuit whose voltage is to be measured. The secondary terminals of the potential transformer are connected to the measuring instrument like the voltmeter, wattmeter, etc.
Fig. 2-4
The secondary windings of the potential transformer are magnetically coupled through the magnetic circuit of the primary windings.
2.5
Capacitor voltage transformer (C.V.T.)The potential transformer is mainly classified into two types, i.e., the conventional wound types (electromagnetic types) and the capacitor voltage potential transformers. In this thesis, we focus on capacitor voltage. Conventional wound type transformer is very expensive because of the requirement of the insulations. Capacitor potential transformer is a combination of capacitor potential divider and a magnetic potential transformer of a relatively small ratio. [18],[19],[20].
19
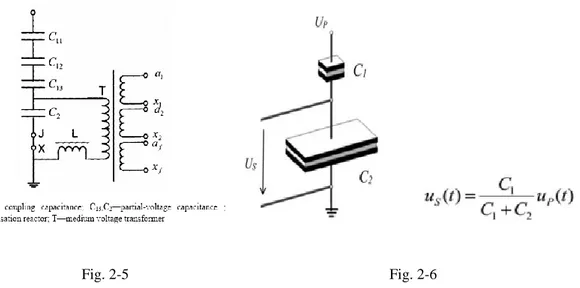
A capacitive voltage transformer (CVT) is widely used in high-voltage (HV) and extra-high voltage (EHV) and medium voltage systems instead of a traditional voltage transformer (VT). (Fig.2-5) is illustrated a CVT’s structure can be mainly divided into a capacitive divider and an electromagnetic unit. A capacitive divider is comprised of an insulating cylinder and a series capacitors inside of it. An electromagnetic unit is comprised of a compensation reactor, a step-down transformer, and a damper. A capacitive divider can first lower the system voltage as an input for an electromagnetic unit. By isolation and reduction of the step-down transformer, the low voltage signals can be used for protection and measurement. Compared with a VT, a CVT has the advantages of smaller size, lower cost, and refrain from Ferro resonance. However, the structure of a CVT is more complicated than a traditional VT which has more measurement accuracy influential parameters, therefore a CVT has more significant measurement error and a higher probability of insulation faults. The circuit diagram of the capacitor potential transformer is shown in the (Fig.2-6). The stack of high voltage he capacitor from the potential divider, the capacitor of two sections becomes C1 and C2.
Fig. 2-5
Fig. 2-6
Both potential dividers and the intermediate transformer have the ratio and insulation requirements which are suitable for economical construction. The intermediate transformer must be of very small ratio error, and phase angle gives the satisfactory performance of the complete unit. The secondary terminal voltage is given by the formula shown below. [21]
20
CVT model
Fig. 2-7
In (Fig.2-7) capacitors are named as the first, second, and third capacitor from bottom to the top in the voltage divider respectively. C11, C12, C2, and C3 are the equivalent capacitance of each segment, where C11, C2, and C3 belong to the high-voltage capacitor, and C12 belongs to the low-voltage capacitor. The main factors influencing equivalent capacitance are temperature and dielectric breakdown. Since a CVT capacitor has a negative temperature coefficient, the equivalent capacitance will decrease when the temperature increases. The dielectric breakdown will cause a short circuit in series capacitors, which means equivalent capacitance will increase. R11, R12, R21, and R31 are the insulation resistances of each segment. The increase in the dielectric loss factor represents a decrease in insulating resistance. The main factors influencing insulation resistance are temperature and moisture in the insulation. When the temperature increases, the dielectric loss of the capacitor will first decrease and then increase. Therefore, the corresponding insulation resistance will first increase and then decrease. Moisture in the insulation will result in a larger dielectric loss, which means the insulation resistance will decrease. R13, R22, and R32 are the surface equivalent resistances. The increase in leakage current represents a decrease in surface resistance. The main factors influencing the surface resistance is environmental contamination and humidity. When contamination and humidity in the atmosphere increases, the surface leakage current of a capacitive divider will increase, which represents the decrease in surface resistance. The electromagnetic unit, Lk, is the sum of compensation reactor reactance and leakage reactance of the transformer, which can be used to resonate with equivalent capacitance of the voltage divider 𝑐0, Lk = 1 / 𝜔2𝑐
21
circuit resistance of the transformer; Zm is the excitation impedance of the transformer; Zd and ZL are the impedance of the damper and load which are recalculated to the primary side of the step-down transformer. tanδ is the dielectric loss factor(2.2) which can be used to characterize the real power loss of insulating material. [21]
𝑡𝑎𝑛𝛿 = 1 𝜔𝑅𝐶⁄ (2.2) In an ideal potential transformer, the primary and the secondary voltage is exactly proportional to the primary voltage and exactly in phase opposition. But this cannot be achieved practically due to the primary and secondary voltage drops. Thus, both the primary and secondary voltage is introduced in the system.
The burden of a potential transformer
The burden is the total external volt-amp load on the secondary at the rated secondary voltage. The rated burden of a PT is a VA burden which must not be exceeded if the transformer is to operate with its rated accuracy. The rated burden is indicated on the nameplate.
The limiting or maximum burden is the greatest VA load at which the potential transformer will operate continuously without overheating its windings beyond the permissible limits. This burden is several times greater than the rated burden. [22]
Phasor diagram of a potential transformer
The phasor diagram of the potential transformer is shown in the (Fig.2-8).
Where, Is – secondary current Es – secondary induced emf Vs – secondary terminal voltage Rs – secondary winding resistance Xs – secondary winding reactance Ip – Primary current
Ep – primarily induced emf Vp – primary terminal voltage Rp – primary winding resistance Xp – primary winding reactance Kt – turn ratio
Io – excitation current
Im – magnetizing component of Io Iw – core loss component of Io Β- phase angle error
22
The main flux is taken as a reference. In instrument transformer, the primary current is the vector sum of the excitation current Io and the current equal to the reversal secondary current Is multiplied by the ratio of 1/kt. The Vp is the voltage applied to the primary terminal of the potential transformer. [23],[24]
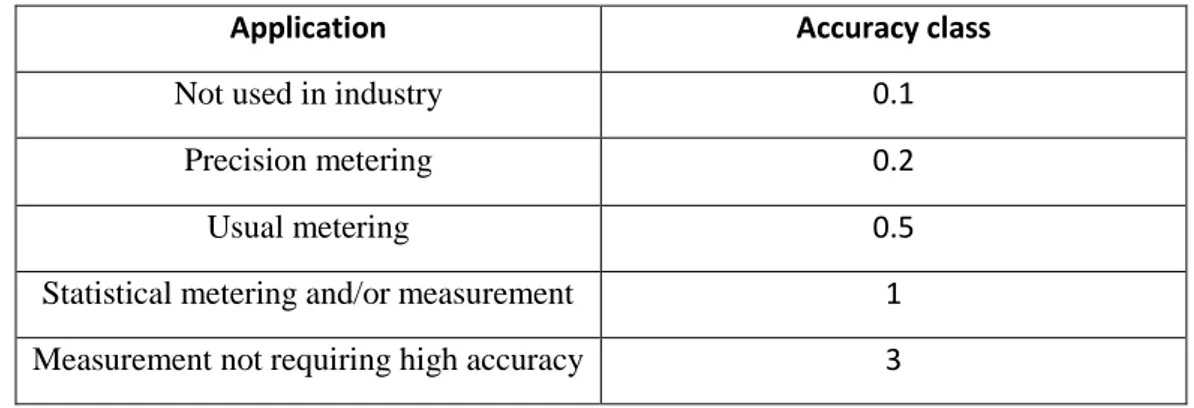
The accuracy class is guaranteed if the voltage is between 80 and 120% of the rated primary voltage and for any load between 25 and 100% of the rated accuracy power with an inductive power factor of 0.8.[25],[26]
TABLE I.the accuracy class generally used by the corresponding application.
Application Accuracy class
Not used in industry 0.1
Precision metering 0.2
Usual metering 0.5
Statistical metering and/or measurement 1
Measurement not requiring high accuracy 3
2.6
The new generation of LPITs
The use of instrument transformers is mandatory for protection or measuring in Medium Voltage applications. Technological progress has led to many developments in the field of measuring. In Medium Voltage applications, the consequence comes into using more and more LPITs associated with digital relays. Relays are easily fitted with LPCTs, ensuring a high consistency of the devices building the protection chain. The LPITs have an output signal with a limited maximum power around 1 volt-ampere, hence a few volts or mil-amperes, that are suitable to direct connect to an acquisition system, avoiding the use of signal adapters that complicate the measurement setup and may decrease its overall accuracy. Another peculiarity of the LPITs is the dimension, which is more compact and reduced compared to legacy inductive ones. This feature of the LPITs is particularly appreciated in a Smart Grid environment where the distributed energy resources, mainly constituting renewable sources, require that the measurement instruments are installed in an application where the space for them is limited and not guaranteed. [27]
23
VT versus LPVT and CT versus LPCT
Table II summarizes the pros and cons of conventional voltage transformers (VTs) and current transformers (CTs) compared to the new low-power voltage transformers (LPVT) and low– power current transformers (LPCT).[28]
TABLE IIsummarizes the pros and cons of (VTs) and (CTs) compared to (LPVT) and (LPCT).
Generic (both for VT and CT) Generic (both for LPVT & LPCT)
accuracy Non-linear. Saturates. Higher
accuracy classes possible
Linear. No saturation. Extended range for high accuracy classes a correction factor could be necessary logistics and
design
features must be calculated for each protection, control or
metering scheme
no need for calculations as there is no saturation and no need to load the
transformer
burden load in the Ω, kΩ range load in the MΩ range
Conventional VT LPVT
cost cost of VT>>>cost of LVPT
isolation galvanic isolation no galvanic isolation
size more room is required smaller and lighter
secondary status must be loaded or open-circuited safe by design
Conventional CT LPCT
secondary status safe if protected, if not must be
loaded or short-circuited safe by design
2.7
Technical consideration
Considering operation and maintenance
Project leaders should bear in mind that operation and maintenance engineers should also be properly trained to exploit the benefits of the new systems. The introduction of LPCTs and LPVTs in the MV network will affect mainly two aspects of the usual operation and maintenance procedures: MV cable insulation testing and RMU wiring testing. It is important to work together with the technology suppliers to train the staff, to provide timely technical support. [28]
Technical consideration in wiring and cabling
With the introduction of LPCTs and LPVTs, it is still possible to use these terminal blocks but we should bear in mind that, given the very low-voltage level of the signal on the secondary
24
side of the LPCT or LPVT, the connection quality becomes critical. Due to the low-power nature of the signal, it is also possible to introduce some innovations on the wiring schemes. The use of coaxial cables with BNC or TNC connectors or shielded twisted pair cables with RJ45 connectors is a convenient and cost-effective option that allows avoiding polarity errors in the wiring. To use these new wiring schemes, field crews would have to be trained and equipped with appropriate tooling and procedures to ensure that safety requirements are met and the tests are performed correctly. [28]
The choice of LPVTs and CTs
The choice of LPVTs was quite obvious after analyzing the requirements as they had several relevant advantages, including size and price. In some solutions, they are already being supplied integrated into the RMUs.
2.8
Accuracy in LPVT and LPCT
The operation of Smart Grids in presence of Distributed Energy Resources has required the introduction of new technologies in power systems, like digital communication, a new type of switchgear, different network topologies, and the massive use of (LPIT) which are replacing with conventional (ITs).
The use of (LPITs) has allowed implementing many new operating and measurement functions, new performance and features are requested to the IT to accomplish real-time network control with the highest efficiency, speed, and accuracy. Very accurate energy and power measurements must be performed to correctly split the energy production revenues among them and for a proper accurate reactive energy injection into the grid. Reaching such accuracy in its measurement gets very challenging. This is what is requested for the new devices used as voltage sensors, the Low Power Voltage Transformers (LPVT). Usually, such devices reduce the phase-to-ground primary voltage to amplitudes of few volts. In such a case matching the existing requirements in terms of accuracy of the voltage measurement required for the (LPITs) to feature special accuracy classes (far better than those of the inductive voltage transformers. Moreover, it will be useful to power network and system designers and operators for selecting suitable (LPVTs) according to also to the accuracy requested for the voltage measurement. It arises that the accuracy class of the (LPVTs) used in a three-phase system strongly affect the error. [29]
25
IEC standards for low-power passive current transformers (LPCT) and low-power passive voltage transformers (LPVT) were established, the IEC 61869-10[30], and IEC 61869-11[31] respectively. The standard accuracy classes vary from 0.1 to 3.0. An accuracy class 0.2 or better in combination with a matching reading unit would make these new transformers suitable for revenue metering of commercial MV customers. The application of (LPVT) and (LPCT) with matching electronic measurement equipment for accurate revenue metering (less than 0.2) is introduced.
Recently, studying has been performed based on IEC 61869-10 and IEC 61869-11 by calculating and estimating errors concerning correlate the uncertainty affecting the measurement of the voltage with the accuracy class of the (LPVT).[32]
2.9
The new generation of medium current transformer (LPCT)
LPCT is a magnetic sensor with an integrated shunt providing a reduced voltage output which represents the primary current (Fig.2-9). LPCT protection chain includes LPCT with transmitting cable, Sepam relay, tripping coil, circuit breaker. LPCT technology is the technical answer to the evolution of relay technology that is now based on digital design. There is only one sensor for all service currents. Then there is no need to choose the rating of the primary current as for the conventional CTs. [33]
Fig. 2-9 Designer recommendation about using LPCT
- To reduce the delivery time (less engineering, less lead time, less stock). - To have a last-minute adaptation of a configured switching device or cubicle. - To facilitate MV network evolution without any shutdown of the cubicle.
26
Choice limitations of the rated burden
Especially for small rated primary currents, and high rated short-time thermal currents (Ith), the rated burden of a current transformer is limited due to the maximum permissible kAW-value (ampere-turns). In this case, the information should be requested from the manufacturer. If the rated burden of a current transformer is calculated according to the equation(2.4).
𝑃𝑁 =(𝐴𝑊)
2. 𝑄 𝑓𝑒. 𝐾
𝐼𝑓𝑒
[𝑉𝐴] (2.4) Where: 𝐴𝑊 primary ampere-turns
𝑄𝑓𝑒 iron cross section(mm2) 𝐾 constant
𝐼𝑓𝑒 ferromagnetic circuit(cm)
Rated primary and secondary current
The value of the primary and secondary current indicates the performance rating of the transformer. A common practice is to use a secondary rated current of 1 or 5 A. The primary rated current depends on the network and is defined by the end-user.
Error limits
The composite error for metering cores has to be higher than 10% to protect the connected metering devices in case of overcurrents. On the opposite, the composite error for protection cores at the rated accuracy limit of the primary current should be smaller or equal to 5% (5P) or 10% (10P) to secure the proper tripping of the connected protection devices.
Accuracy class
This is the limit of the permissible percentage of current error at the rated current. In general, the limits of current error are calculated for a range between 1% up to 120% of rated current. (Fig.2-10) shows the relation of rated current and limitation of permissible current error for two classes 0.5 and 0.1 [33]
27
LPCT is compliant with international standard IEC 60044-8[34], and therefore it has passed type and routine tests required by the standard. LPCT respects the same accuracy class with a wider range. Measuring accuracy class 0.5 protective accuracy class 5P. LPCT represents an evolution of the conventional CT. The conventional CT has been designed for electromechanical relays and therefore supplies a high power current output with a low range of application. Modern electronic relays have low input power requirement, so the LPCT which apply a voltage signal as secondary output with a wider range of application is the optimal solution. [35]
2.10
The new generation of medium voltage transformer (LPVT)
LPVT is the acronym for Low Power Voltage Transformer. LPVTs are sensor style VTs (resistive or capacitive dividers) as opposed to traditional iron core transformer style VTs. The output a secondary voltage between 0.2 and 4V and can be used in conjunction with an upconverter box to give a 120V output to protective relays and meters.
Passive LPVT
The low-power passive voltage transformer measures direct, alternating, and mixed voltages e.g. motor management, power quality analysis, and protection purposes. LPVTs domain of application is medium voltage installations like Static VAR Compensators or frequency converter installations. The passive LPVT(Fig.2-11) consists of a high voltage resistive divider (R1, R2), and capacitor divider (C1, C2) and epoxy resin tube as a surge protector. The voltage divider transforms the primary voltage at point (A) to a low voltage at point (a), which can be processed by the secondary system. The output cable and the input of the secondary system are compensated, leading to a wide frequency range.
The electromagnetic shielding ensures high EMC and makes the GSER 16 suitable for use in environments with heavy external interference and disturbance.
The GDT protects the secondary tap against high voltages since there is no galvanic isolation between the primary and secondary terminal. [36]
28
Fig. 2-11
Limits of voltage error and phase displacement
The voltage error and phase displacement at the rated frequency shall not exceed the values given in the (tableIII) at any voltage between 80% and 120% of rated voltage and with burdens between 25% and 100% of the rated burden and a power factor of 0.8.
TABLE.III.voltage error and phase displacement at the rated frequency
Accuracy class ±voltage error(%) ±phase displacement
0.2 0.2 10
0.5 0.5 20
1 1 40
The rated thermal limiting
The thermal limiting output of the residual winding shall be specified in volt-ampere (VA) about the secondary voltage with the unit power factor. The preferred values are given in the IEC-Standard. Since the residual windings are connected in an open delta circuit, these windings are only loaded under fault conditions. Therefore, a maximum duration of 8 hours, for example, can be chosen.
The rated voltage factor is determined by the maximum operating voltage depending on the system's grounding conditions. In single pole insulated transformers, it is common practice to use a rated voltage factor of 1.9 the rated voltage for a load-duration of 8 hours. The rated factor is defined as 1.2.UN for all other types. [37]
29
Active LPVT
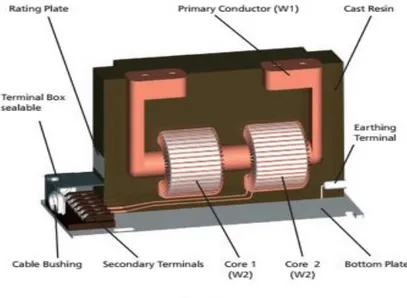
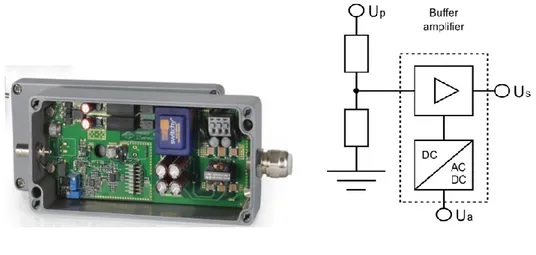
The goal should be to guarantee that any LPVT or LPCT will be able to operate with an IED. IEC-60044[38] standard specifies the tests that are required for electronic instrument transformers from electrical safety. Moreover, Two main types of devices are distinguished, passive LPVTs, and active ones. A passive LPIT is an (LPIT that includes only passive components) while an electronic LPIT is an (LPIT that includes active components) .it differs from an electronic LPIT by the presence of a power source and of an active circuit that adjusts the transformers’ output. The electronic voltage transformer measure direct, alternating, and mixed voltages with high accuracy e.g. motor management and power quality analysis. Its area of application is medium voltage installations, which require the voltage divider to be independent of the connected burden. The electronic voltage transformer is an alternative to conventional voltage transformers once the primary voltage contains DC components and/or higher frequencies. This system consists of a low-power passive voltage transformer (passive LPVT) and a buffer amplifier. The voltage divider inside the passive LPVT transforms the primary voltage Up to a low voltage, which is processed inside the electronics. For this processing, the auxiliary power supply Ua is required. Various protection devices make sure no high voltages can damage the electronics and the secondary equipment since there is no galvanic isolation between the primary and secondary terminal.
The buffer amplifier makes the passive LPVT independent of the connected burden and allows the output signal to be fed into more than one secondary equipment, thus extending the performance of the passive LPVT. The intelligent electronic devices (IEDs) (Fig.2-12) that collect and process the measurements of the LPCTs and LPVTs are another important factor to ensure the success of MV distribution automation projects. Contrary to CTs and VTs, the output of low-power sensors can be wired to an IED utilizing a thin wire such as the ones that are used for communications. Some vendors are leveraging on this to propose new connector options such as (RJ45) connectors that could carry both the V and I signals of a given phase in a single connector. One of the main challenges is ensuring compatibility between LPVTs, LPCTs, and IEDs. The IEC-61869 includes specific safety and accuracy tests for LPCTs and LPVTs that will fill the existing gaps soon standard. [39]
30
Fig. 2-12 Fig. 2-13
2.11
LPVT (smart terminals)
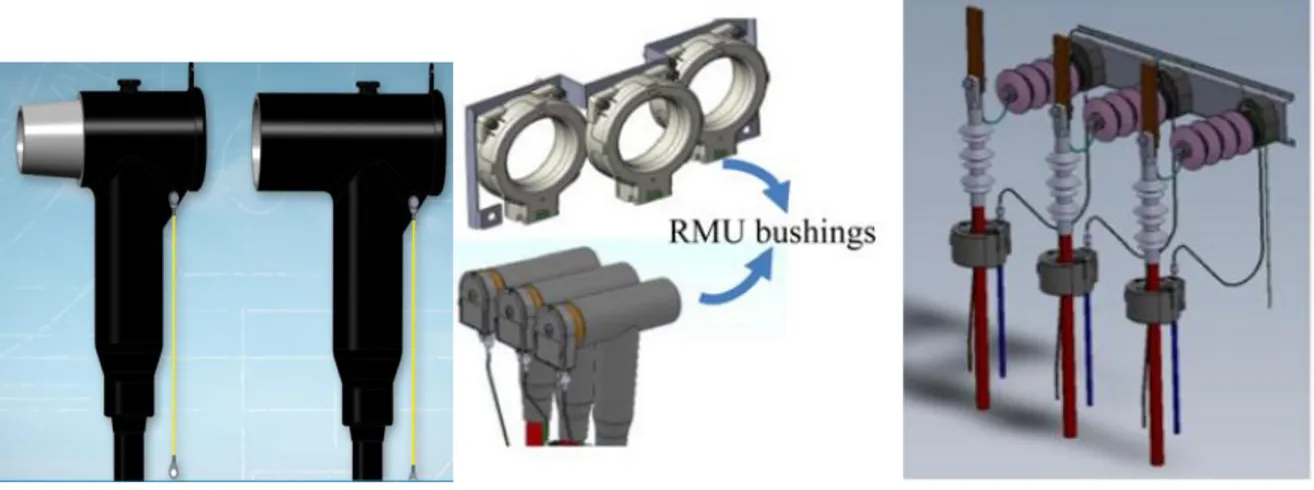
For connection of polymeric MV cables to transformers, switchgear units (GIS and conventional), and motors, etc, Indoor and outdoor installation (Fig.2-14). The connector is entirely protected by a watertight conductive envelope connected to the earth.
Smart terminals features
Continuous 250 A RMS overload 300 A RMS (8 hours per 24-hour period). operated when de-energized. Test by voltage detector through an inbuilt capacitive
voltage divider.
Single-core polymeric insulation (PE, XLPE, EPR...).copper or aluminum conductors. The semi-conducting screen either extruded or taped.
the metallic screen of tape, wire, or poly lam type. Insulation voltage up to 24 kV (Um).
Conductor sizes: 16 to 120 sqmm.no need for special tools, no heating, taping, or filling. Vertical, angled, or inverted position. No minimum distance between phases.
energizing may take place immediately after the connector is plugged into its bushing, dead-end plug...
Individual clamping by stainless steel brace. The three phases may also be locked together and to the equipment by use of metallic. [40], [41]
31
Fig. 2-14 Installation in AIS (right) and GIS (middle) RMUs and smart termination (left)
2.12
Insulations consideration
The engineer in charge of guiding the installation should pay special care to the selection of the position of the LPVT within the MV cable compartment. The LPVT should be installed in such a way that it will always respect that minimum distance. The same applies for all the cables that are used for the low-voltage signals RMU bushings on the secondary side of the LPVT and/or LPCTs.
The shield of the LPVT cable shall be connected to the ground only inside the sensor. In the case of voltage and current integrated sensors, a common shield is present, for both current and voltage sensors wires. Moreover, all of the LPVT shields shall be connected to the ground inside of the sensor. It is never allowed to use the ground eventually taken from the protection device for grounding sensors and/or cable shields. Also, the ground point of the capacitive divider shall be connected to the ground only inside the sensor. The ground eventually taken from the protection device cannot be used to ground the capacitive divider. [28]
The optimal installation location could be the bushing. Measuring current at the MV cable would require either disconnecting the MV cable or using a split-core CT/LPCT; besides this, it would also be necessary to pass the cable-shielding through the CT/LPCT.
2.13
Dielectric permittivity in LPITs
The Structurer of LPITs is involved in dielectric (epoxy resin) characteristics. Because of the non-ideal characteristic behavior of dielectric, the frequency response in LPITs can be effected by leakage resistivity and frequency dependency of the permittivity. This paragraph will explain short comments about the impotence of dielectric spectroscopy and the polarization/relaxation phenomena. That induced in dielectric materials during and after the
32
application of imposing variable frequency or impulse signal. According to the LPVT instructor, it is better to understand the concept of dielectric and permittivity impact of the capacitor, in the following, short remind of capacitor instructor is presented.
The capacitor is a component that has the ability or “capacity” to store energy in the form of an electrical charge producing a potential difference (Static Voltage) across its plates, much like a small rechargeable battery.In its basic form, a capacitor consists of two or more parallel conductive (metal) plates which are not connected or touching each other but are electrically separated either by air or by some form of a good insulating material such as waxed paper, mica, ceramic, plastic or some form of a liquid gel as used in electrolytic capacitors. The insulating layer between a capacitor's plates is commonly called the Dielectric. when a capacitor is connected to an alternating current or AC circuit, the flow of the current appears to pass straight through the capacitor with little or no resistance.
The capacitance of a parallel plate capacitor (Fig.2-15), is proportional to the area, A in metres2 of the smallest of the two plates and inversely proportional to the distance or separation, d (i.e. the dielectric thickness) given in meters between these two conductive plates.
Fig. 2-15
The generalized equation for the capacitance of a parallel plate capacitor is given as 𝐶 = 𝜀𝐴
𝑑
where ε represents the absolute permittivity of the dielectric material being used. The permittivity of a vacuum, εo is also known as the “permittivity of free space” has the value of
33
The dielectric of a capacitor
As well as the overall size of the conductive plates and their distance or spacing apart from each other, another factor that affects the overall capacitance of the device is the type of dielectric material being used (2.6). In other words the “Permittivity” (ε) of the dielectric. The dielectric material used is always an insulator. The various insulating materials used as the dielectric in a capacitor differ in their ability to block or pass an electrical charge. This dielectric material can be made from several insulating materials or combinations of these materials with the most common types used being: air, paper, polyester, polypropylene, Mylar, ceramic, glass, oil, or a variety of other materials.
The factor by which the dielectric material, or insulator, increases the capacitance of the capacitor compared to air is known as the Dielectric Constant, k and dielectric material with a high dielectric constant is a better insulator than a dielectric material with a lower dielectric constant. The dielectric constant is a dimensionless quantity since it is relative to free space. The actual permittivity or “complex permittivity” of the dielectric material between the plates is then the product of the permittivity of free space (εo) and the relative permittivity (εr) of the
material being used as the dielectric. Practically, the permittivity of free space, εo as our base
level and make it equal to one, when the vacuum of free space is replaced by some other type of insulating material, their permittivity of its dielectric is referenced to the base dielectric of free space giving a multiplication factor known as “relative permittivity”, εr.
𝐶𝑎𝑝𝑎𝑐𝑖𝑡𝑎𝑛𝑐𝑒, 𝐶 =𝜀0𝜀𝑟𝐴
𝑑 𝐹𝑎𝑟𝑎𝑑𝑠 (2.6)
Several factors can influence a capacitor instead of contracture parameters, all capacitors have a maximum voltage rating and when selecting a capacitor consideration must be given to the amount of voltage to be applied across the capacitor. If the applied voltage becomes too great, the dielectric will break down and arcing will occur between the capacitor plates resulting in a short-circuit, another factor which affects the operation of a capacitor is Dielectric Leakage. Dielectric leakage occurs in a capacitor as the result of an unwanted leakage current which flows through the dielectric material. Generally, it is assumed that the resistance of the dielectric is extremely high and a good insulator blocking the flow of the current. However, if the dielectric material becomes damaged due to excessive voltage or over temperature, the leakage current through the dielectric will become extremely high resulting in a rapid loss of charge on the plates and an overheating of the capacitor eventually resulting in premature
34
failure and thus aging of the dielectric. All in all, the conductive plates and their distance or spacing apart from each other in capacitor almost are constant parameters and do not change during operation but, the dielectric constant and relative permittivity are key to the operation of capacitors and the determination of the levels of capacitance achievable and both can be the state variables which must be considered. Permittivity and dielectric constant are two terms that are central to capacitor technology, the terms permittivity, and dielectric constant are essentially the same for most purposes.
The dielectric will also need to be chosen to meet requirements such as insulation strength - it must be able to withstand the voltages placed across it with the thickness levels used. It must also be sufficiently stable with variations in temperature, humidity, and voltage, etc.
Some materials have a very stable dielectric constant and can be used in high stability capacitors, whereas other dielectric materials enable very high levels of volumetric capacitance to be achieved. [43]
Specification factors in a capacitor
The Equivalent Series Resistance (ESR) of the capacitor, its Dissipation Factor (DF), loss tangent, and Quality Factor (Q) are all important factors in the specification of any capacitor. Factors like the ESR, dissipation factor, loss tangent and Q are important in many aspects of the operation of a capacitor and they can determine the types of applications for which the capacitor may be used. ESR, DF, and Q are all aspects of the performance of a capacitor that will affect its performance in areas such as frequency response. However, ESR and DF are also particularly important for capacitors operating in power supplies where a high ESR and dissipation factor, DF will result in a large amount of power being dissipated in the capacitor.
The equivalent series resistance or ESR of a capacitor has an impact on many areas where capacitors may be used. The resistor acts like any other resistor giving rise to voltage drops and dissipating heat.
The ESR of the capacitor is responsible for the energy dissipated as heat and it is directly proportional to the DF. When analyzing a circuit fully, a capacitor should be depicted as its equivalent circuit including the ideal capacitor, but also with its series ESR.
Although dissipation factor and loss tangent are effectively the same, they take slightly different views which are useful when designing different types of circuits. Normally the
35
dissipation factor is used at lower frequencies, whereas the loss tangent is more applicable for high-frequency applications. [44]
Dissipation factor and loss of tangent definitions
The dissipation factor is defined as the value of the tendency of dielectric materials to absorb some of the energy when an AC signal is applied.
The loss tangent is defined as the tangent of the difference of the phase angle between capacitor voltage and capacitor current for the theoretical 90-degree value anticipated, this difference is caused by the dielectric losses within the capacitor. The value δ (Greek letter delta) is also known as the loss angle.
Tanδ =D.F tanδ =1/ Q tanδ =ESR/ XC (2.7)
Where:
δ = loss angle, DF = dissipation factor, Q = quality factor, ESR = equivalent series resistance, Xc = reactance of the capacitor in ohms.
Actually, in LPVT epoxy resin is used for medium dielectric, and in this thesis is focused on epoxy resin Characteristic. Analysis of the epoxy resin is expected to reveal its dielectric characteristics in the frequency domain of the material under study. [45]
2.14
Frequency dependency to the permittivity
The dielectric properties of a material are associated with the response of the system to an applied electric field at microscopic and macroscopic levels. In the case of an ac driving field, these phenomena are expressed by the polarization and dielectric loss as a function of frequency. The frequency-dependent (ac), permittivity is defined through the linear relationship between the polarization and the ac driving field. It is tried to show how permittivity depends on the frequency and revile of why it will be necessary to analyze frequency response .in the following polarization in dielectric will be considered. [46]
The relationship between permittivity and resistance
There is a relationship between the permittivity and the conductivity of a material, through the Kramers Kronig relations. The complex permittivity(2.8) is:
36
Where 𝜀′is the real (normal) permittivity, 𝜀′′ is the conductivity, 𝜔 is the radian frequency, and
j is the usual sqrt (-1). Note that 𝜀′and 𝜀′′ are both functions of frequency, and the Kramers
Kronig relations show that the real and imaginary parts of a function aren't independent.[47] Unfortunately to get the imaginary part from the real is needed to know the real part at all frequencies because the Kramers Kronig relations involve an integral over all frequencies. Numerically, we can use limited frequency data, but it is still needed to know the frequency variation, and there is an arbitrary constant representing the frequency ranges. Generallywhen a dielectric is subjected an alternating electric field the permittivity of the dielectric material is complex, because in a lossless dielectric the energy loss due to the propagation of electric field is zero, but in dielectric when there is the propagation of sinusoidal electric field through the medium some of the energy correspondings to this electric field gets converted to heat or some loss energy, so the real part of permittivity corresponds to the efficiency of a dielectric material to store the field energy and imaginary part accounts for the losses of energy due to the variation of ac electric field in the dielectric material.It indicates the Ohmic resistance of the material, for pure dielectric the imaginary part is zero, and increasing in imaginary part indicates the Ohmic loss. [48]
The real 𝜀′(2.9) and imaginary𝜀′′ (2.10) parts of dielectric constant are calculated using the following relation:
𝜀′= 𝑐. 𝑡 𝜀 0. 𝐴
⁄ (2.9) 𝜀′′ = 𝜀′(𝑡𝑎𝑛𝛿) (2.10)
Where: c= measured capacitance, t= thickness of the dielectric, 𝜀0= permittivity of free space A= cross-sectional
area of the electrode surface, tanδ = dielectric loss Permittivity variation
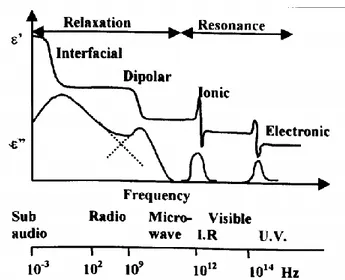
The variation of the real part and imaginary part of the permittivity over a large range of frequency has been represented in (Fig2-16). The complex relative permittivity is defined by:
37
Fig. 2-16 Variation of the real and imaginary part of the permittivity over the frequency domain
The interest in working in the frequency domain is multiple. Most of the application of dielectric materials involves the response to harmonic signals of definite frequencies. Besides, measurements in the frequency domain lead to accurate results since signals can be obtained in a very narrow range of frequencies thus limiting the noise level recorded. [49]
The polarization is defined by the equation:
𝑃(𝜔) = 𝜀0𝑥(𝜔). 𝐸(𝜔) (1.12) The frequency-dependent susceptibility is defined:
𝑥∗(𝜔) = 𝑥′(𝜔) − 𝑖𝑥′′(𝜔) (1.13)
ω= 2πf (where 𝜔 is the circular frequency and f the frequency in Hertz) f(t) is a real function
of time that is equal to the discharge current after a step-down field, x'(ω) and x"(ω) components vary in-phase and quadrature respectively compared to the harmonic signal applied. From this data, other characteristics are accessible such as the impedance, 𝑧∗ and the
capacitance, 𝑐∗ that are useful for the interpretation of the data.[49]The following relations (2.14),(2.15) link them:
𝑍∗(𝜔) = 1 (𝑖𝜔𝐶⁄ ∗(𝜔)) (2.14)
In parallel plate geometry, the capacitance is given by: 𝐶∗(𝜔) = 𝜀
0(𝑋∗(𝜔) + 𝜀∞) 𝐴 𝑑⁄ (2.15)
It can be seen the capacitor characteristics and dielectric components and complex permittivity in LPVT are frequency dependent. Studying and survey on frequency response analysis could
38
be the main way to identify the behavior of LPVT functionality. For this reason for finding frequency response we need to supply the wide spectrum of frequency but this method takes a lot of time unstable parameters and various test experiment conditions and effective parameters during a long time will appear unacceptable and unexpected errors.to cope with this problem Fast Procedure for Low Power Voltage Transformers (LPVT) is recommended, according to the specific feature of impulse signal and imply fast Fourier transformation (FFT) the frequency response can be achieved in acceptable approximation. The next Chapter contains the subjects to clarify these methods and relevant concepts.
39