© The Author 2016. Published by Oxford University Press on behalf of The Gerontological Society of America. All rights reserved.
For permissions, please e-mail: [email protected]. 395
doi:10.1093/gerona/glw188 Advance Access publication October 20, 2016
Research Article
Defining Aging Phenotypes and Related Outcomes: Clues
to Recognize Frailty in Hospitalized Older Patients
Maura
Marcucci,
1,2,*
Carlotta
Franchi,
3,*
Alessandro
Nobili,
3Pier Mannuccio Mannucci,
4and Ilaria Ardoino
2; REPOSI Investigators
1Geriatric Unit, Fondazione IRCCS Ca’ Granda Ospedale Maggiore Policlinico, Milan, Italy. 2Department of Clinical Sciences and Community
Health, University of Milan, Italy. 3Department of Neuroscience, IRCCS—Istituto di Ricerche Farmacologiche “Mario Negri,” Milan, Italy. 4A. Bianchi Bonomi Hemophilia and Thrombosis Center, Fondazione IRCCS Ca’ Granda Ospedale Maggiore Policlinico, Milan, Italy.
*These authors contributed equally to this work.
Address correspondence to Carlotta Franchi, PharmD, Unit of Pharmacoepidemiological Research in Older People, IRCCS—Istituto di Ricerche Farmacologiche “Mario Negri,” Via Giuseppe La Masa, 19 20156 Milan, Italy. E-mail: [email protected]
Received May 27, 2016; Accepted September 7, 2016 Decision Editor: Stephen Kritchevsky, PhD
Abstract
Background: Because frailty is a complex phenomenon associated with poor outcomes, the identification of patient profiles with different care needs might be of greater practical help than to look for a unifying definition. This study aimed at identifying aging phenotypes and their related outcomes in order to recognize frailty in hospitalized older patients.
Methods: Patients aged 65 or older enrolled in internal medicine and geriatric wards participating in the REPOSI registry. Relationships among variables associated to sociodemographic, physical, cognitive, functional, and medical status were explored using a multiple correspondence analysis. The hierarchical cluster analysis was then performed to identify possible patient profiles. Multivariable logistic regression was used to verify the association between clusters and outcomes (in-hospital mortality and 3-month postdischarge mortality and rehospitalization). Results: 2,841 patients were included in the statistical analyses. Four clusters were identified: the healthiest (I); those with multimorbidity (II); the functionally independent women with osteoporosis and arthritis (III); and the functionally dependent oldest old patients with cognitive impairment (IV). There was a significantly higher in-hospital mortality in Cluster II (odds ratio [OR] = 2.27, 95% confidence interval [CI] = 1.15–4.46) and Cluster IV (OR = 5.15, 95% CI = 2.58–10.26) and a higher 3-month mortality in Cluster II (OR = 1.66, 95% CI = 1.13–2.44) and Cluster IV (OR = 1.86, 95% CI = 1.15–3.00) than in Cluster I.
Conclusions: Using alternative analytical techniques among hospitalized older patients, we could distinguish different frailty phenotypes, differently associated with adverse events. The identification of different patient profiles can help defining the best care strategy according to specific patient needs. Keywords: Frailty—Aging phenotypes—Outcomes—Internal medicine and geriatric wards—Cluster analysis
Frailty has been conceptualized as a state of late-life decline and vul-nerability due to a reduced ability to adapt to stressors (eg, acute illness) and is associated with an increased risk of adverse health outcomes and death (1–3). Different definitions of frailty have been proposed in the scientific literature to help clinicians, researchers, and other stakeholders. The most commonly used is the physi-cal frailty phenotype by Fried and colleagues, which is based on criteria related to reduced physical reserves (weight loss, exhaus-tion, weakness, slowness, and reduced physical activity) (1). Other definitions, for example, the Frailty Index (4), the Clinical Frailty
Scale (5), the Groningen or Tilburg Frailty Indicator (6,7), and the Edmonton Frail Scale (8) include additional deficits concerning dif-ferent domains, such as cognition and mood, organ diseases, phar-macotherapy, functional autonomy, and social conditions. Most of the existing frailty tools have been developed and validated in the frame of community-dwelling older adults; only few studies were specifically oriented to predict the outcomes of hospitalized older people (9,10). When applied to the same population, the different existing definitions overlapped only partially in the identification of frail people, although all the definitions helped to predict adverse
outcomes (10–14). Because frailty does not identify a specific dis-ease but is a complex phenomenon with a multifactorial etiology, it is likely that a diagnostic gold standard does not exist. Thus the identification of different frailty profiles with the associated differ-ent care needs might be of greater practical help than to look for a unifying definition, in order to better manage frail people. With this background, we analyzed data from the REPOSI registry on hos-pitalized older patients with the aims (i) to identify patient profiles providing features that describe homogeneous subsets of patients on the basis of clinically relevant variables available in the registry (ie, lifestyle, physical and cognitive status, functional performance, comorbidities, and medications) and (ii) to study the association of the identified phenotypes with clinical outcomes (in-hospital mortal-ity, 3-month postdischarge mortalmortal-ity, and rehospitalization).
Methods
Setting and Participants
The present study is based on data prospectively collected in the frame of the REPOSI project. REPOSI (REgistro POliterapie SIMI) is an ongoing collaboration between the Italian Society of Internal medicine (SIMI), the IRCCS—Istituto di Ricerche Farmacologiche “Mario Negri,” and Fondazione IRCCS Ca’ Granda Ospedale Maggiore Policlinico of Milan, launched in 2008 with the aim to investigate various aspects related to multimorbidity and polyp-harmacy in an older acutely hospitalized population. REPOSI is a multicenter prospective registry designed to collect information on patients aged 65 or older, consecutively admitted to internal medi-cine or geriatric wards of Italian hospitals during 4 index weeks (one for each season). Since 2014, Spanish hospitals also partici-pated in the data collection. A standardized web-based case report form, with detailed instructions for the compilation, was provided to the attending physicians. Specifically, a detailed explanation on how to fill geriatric scales has been also introduced in order to improve the standardization of the compilation at different times and among several centers (internal medicine and geriatric wards). Moreover, a clinical monitor dedicated to the project was always available to support physicians during the compilation of case report form. The principal data collected include sociodemographic factors, clinical and laboratory data, and pharmacological thera-pies. After discharge, additional follow-up data were collected via telephone calls at 3 months. Participation was voluntary, and all participants signed an informed consent. More detailed description of the data set is available in reference (15). For the purpose of this study, data collected in 2010, 2012, and 2014 were analyzed because postdischarge follow-up data were added to the REPOSI data set only since 2010.
The REPOSI project was approved by the local ethical commit-tees of the participating centers.
Variables
The authors prespecified a list of variables that are usually included in the assessment of frailty (4) and looked for those available in the REPOSI registry. In addition, they considered those variables that they considered to be related to an unhealthy condition and avail-able in the frame of hospitalized patients. The retrieved variavail-ables considered for the analyses were grouped as follows:
• Sociodemographic, anthropometric, and lifestyle data: sex, age, body mass index, living condition, smoke, and alcohol consumption.
• Medical history data (at admission) collected according to the Cumulative Illness Rating Scale (CIRS) (16); in particular, pres-ence of hypertension, diabetes, ischemic heart diseases, chronic obstructive pulmonary disease, chronic kidney disease, heart failure, arthropathies and dorsopathies (here named arthritis), neoplasm, osteoporosis (including also fractures and prosthesis), liver diseases, thyroid disorders, depression (excluding bipolar disorders), dementia, sensorial deficits (including hearing and visual impairment); hospitalization during the 6 months preced-ing the index admission; number of diagnoses and drugs. • Functional status: performance in activities of daily living
meas-ured by the Barthel Index (17).
• Cognition and mood: the Short Blessed Test (SBT) (18) and the 4-item Geriatric Depression Scale (GDS-4) (19).
• Clinical and laboratory parameters (at admission): systolic blood pressure, heart rate, mean corpuscular volume, total cholesterol, hemoglobin, and estimated creatinine clearance according to the Chronic Kidney Disease Epidemiology Collaboration (CKD-EPI) formula (20).
Statistical Analysis
Exploring the relationships between variables
Multiple correspondence analysis (MCA) (21) was performed in order to study the relationships between categorical variables. MCA is an explorative multivariate statistical technique that allows to summarize the information contained in a large amount of origi-nally related variables into a small set of unrelated variables, named factorial axes. Results of MCA can be graphically represented on the plane identified by the factorial axes. Original categories are rep-resented on the plane as points with specific coordinates on each axis to form clouds of categories, with the distance between points providing an approximate description of the association/relationship among categories. Also, a cloud of individuals can be represented using coordinates on the newly identified factorial axes, so that patients with similar coordinates share similar profiles.
More details are provided in Supplementary Material. Identification of possible frailty profiles
In order to identify patient profiles potentially related to a frailty condition, an agglomerative hierarchical cluster analysis (HCA) was performed. Clustering techniques allow to classify patients within homogeneous subsets (clusters) through the definition of a distance between individuals on the basis of their characteristics. The score (coordinates) obtained on the first three factorial axes identified through the MCA was used to calculate distances (22). The stability of the clusters identified through the HCA (ie, internal validation) was investigated by means of resampling methods (bootstrap). The similarity between each clustering procedure on the resample data and that on the original data was assessed via the Jaccard’s coef-ficient (23). To this aim 1,000 bootstrap resamples with replacement were randomly generated from the original data. Each participant was then assigned to the cluster in which it was most frequently classified. MCA and HCA were performed on a complete case basis. Association of clusters with adverse outcomes
Multivariable logistic regression analysis was used to evaluate the association among the identified clusters and outcomes (in-hospital and 3-month mortality and rehospitalizations), adjusting by the country (Spain vs Italy) and type of ward (geriatric vs internal medi-cine). Statistical analysis was carried out using software SAS software
Version 9.4 (SAS Institute, Cary, NC) and R (R Development Core Team, 2006), with FactoMineR and ca packages added.
Results
Study Population
Globally 3,915 patients, hospitalized in 116 internal medicine and geriatric wards (15 from Spain), were enrolled in the REPOSI registry in years 2010 (N = 1,380), 2012 (N = 1,323), and 2014 (N = 1,212). Less than 5% of patients were enrolled in Spanish hospital wards. The flow diagram of patients included in the study is reported in Supplementary Figure 1. Patient characteristics at hospital admission are given in Table 1.
Of the patients enrolled, 50% were women; their mean age was 78.7 years (SD = 7.4). According to body mass index cutoffs, 978
(27.7%) patients were underweight and 1,278 (36.2%) were over-weight or obese. Most of the patients presented a good degree of independence according to the Barthel Index (47.1%). The most frequent morbidities were hypertension (76.5%), diabetes (28.6%), and heart diseases (24.7%). According to the SBT, almost half of the patients (44.5%) had a moderate-to-severe cognitive impairment. Overall 2,348 patients (60.0%) were on polypharmacy (≥5 drugs).
The complete case sample was represented by 2,841 patients who were finally included in the MCA and HCA analyses.
Multiple Correspondence Analysis
In a preliminary analysis, the following variables carrying a neg-ligible contribution in the explanation of the factorial axes were discarded: systolic blood pressure, heart rate, mean corpuscular vol-ume, neoplasm, depression, sensorial deficits, total cholesterol, liver,
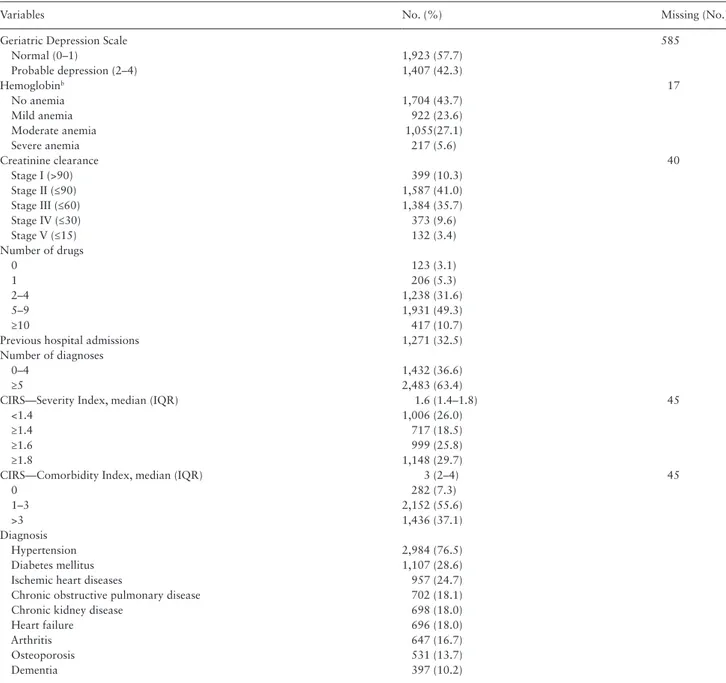
Table 1. Sociodemographic, Clinical, and Laboratory Characteristics at Hospital Admission of 3,915 Patients Enrolled in REPOSI Registry
Variables No. (%) Missing (No.)
Year 2010 1,380 (35.2) 2012 1,323 (33.8) 2014 1,212 (31.0) Country Italy 3,746 (95.7) Spain 169 (4.3) Sex Male 1,956 (50.0) Female 1,959 (50.0) Age, mean (SD) 78.7 (7.4)
Young old (65–75 years) 1,380 (35.2) Middle old (76–84 years) 1,603 (41.0) Oldest old (≥85 years) 932 (23.8)
Body mass index, mean (SD) 25.9 (5.1) 385
Underweight (<23 kg/m2) 978 (27.7) Normal weight (≥23 kg/m2) 1,274 (36.1) Overweight (≥27 kg/m2) 661 (18.7) Obese (≥30 kg/m2) 617(17.5) Living arrangement 137 Alone 831 (22.0) With relatives 2,508 (66.4) Others (caregiver) 206 (5.4) Nursing home 233 (6.2) Alcohol intake 102 Never 1,829 (48.0) Former drinker 288 (7.5) Drinker 737 (19.3) Occasional drinker 959 (25.2) Smoke 94 No 2,068 (54.1) Former smoker 1,422 (37.2) Yes 331 (8.7) Barthel Indexa 64 No or negligible dependence (91–100) 1,815 (47.1) Mild dependence (75–90) 675 (17.6) Moderate dependence (50–74) 494 (12.8) Severe dependence (25–49) 352 (9.1) Total dependence (0–24) 515 (13.4)
Short Blessed Test 355
Normal (0–4) 1,348 (37.9)
Possible cognitive impairment (5–9) 628 (17.6) Moderate cognitive impairment (10–19) 1,135 (31.9) Severe cognitive impairment (20–28) 449 (12.6)
and thyroid disorders. Thus, values concerning 23 variables were used. The CIRS-CI and CIRS-SI were not used to assess MCA solu-tion; however, they were plotted on the cloud of categories (sup-plementary variables—see Sup(sup-plementary Material). The first three factorial axes in the MCA explained almost 71% of the overall variability in the data and were used to calculate the distances in the subsequent HCA.
Supplementary Figure 2 shows the resulting cloud of categories projected on the plane defined by the first and second factorial axes and Supplementary Figure 3 the cloud of categories projected on the plane defined by the second and third axes with detailed description.
Briefly, according to the configuration of the cloud of categories, the first axis could be interpreted as the expression of the burden of disease, the second axis as the expression of musculoskeletal and cognitive morbidity, and the third axis as the expression of cognitive deterioration and functional dependence.
Hierarchical Cluster Analysis
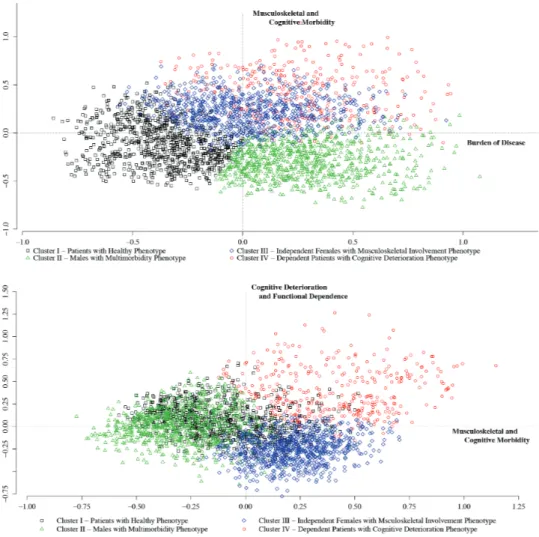
HCA, performed on the scores of the first three components, identi-fied four main clusters of patients. The Bootstrap showed a quite good stability of results (the four means of all Jaccard’s coefficients were about 0.87). Figure 1 represents the cloud of individuals,
Variables No. (%) Missing (No.)
Geriatric Depression Scale 585
Normal (0–1) 1,923 (57.7) Probable depression (2–4) 1,407 (42.3) Hemoglobinb 17 No anemia 1,704 (43.7) Mild anemia 922 (23.6) Moderate anemia 1,055(27.1) Severe anemia 217 (5.6) Creatinine clearance 40 Stage I (>90) 399 (10.3) Stage II (≤90) 1,587 (41.0) Stage III (≤60) 1,384 (35.7) Stage IV (≤30) 373 (9.6) Stage V (≤15) 132 (3.4) Number of drugs 0 123 (3.1) 1 206 (5.3) 2–4 1,238 (31.6) 5–9 1,931 (49.3) ≥10 417 (10.7)
Previous hospital admissions 1,271 (32.5) Number of diagnoses
0–4 1,432 (36.6)
≥5 2,483 (63.4)
CIRS—Severity Index, median (IQR) 1.6 (1.4–1.8) 45
<1.4 1,006 (26.0)
≥1.4 717 (18.5)
≥1.6 999 (25.8)
≥1.8 1,148 (29.7)
CIRS—Comorbidity Index, median (IQR) 3 (2–4) 45
0 282 (7.3) 1–3 2,152 (55.6) >3 1,436 (37.1) Diagnosis Hypertension 2,984 (76.5) Diabetes mellitus 1,107 (28.6)
Ischemic heart diseases 957 (24.7) Chronic obstructive pulmonary disease 702 (18.1) Chronic kidney disease 698 (18.0)
Heart failure 696 (18.0)
Arthritis 647 (16.7)
Osteoporosis 531 (13.7)
Dementia 397 (10.2)
Notes: CIRS = Cumulative Illness Rating Scale; IQR = interquartile range; SD = standard deviation.
aEvaluated during hospital stay.
bNo anemia (male: ≥13 g/dL; female: ≥12 g/dL); mild anemia (male: ≥11 g/dL and <13 g/dL; female: ≥11 g/dL and <12 g/dL); moderate anemia (male and female:
≥8 g/dL and <11g/dL); severe anemia (male and female: <8 g/dL). Hypertension (ICD-9: 401–405); chronic kidney disease (ICD-9: 585); diabetes mellitus (ICD-9: 250); chronic obstructive pulmonary disease (ICD-9: 4912); heart failure (ICD-9: 428); dementia (ICD-9: 290 / 294 / 310 / 331); osteoporosis (ICD-9: 733) in-cluded also fractures and prosthesis (ICD-9: 800–829; V436); cardiac diseases (ICD-9: 410–414); arthritis (ICD-9: 710–724).
Table 1. Continued
according to cluster distribution, projected on the plane defined by the first and the second factorial axes (upper panel) and that identi-fied by the second and the third factorial axes (lower panel). The dis-tribution of patients’ characteristics within each cluster is reported in Supplementary Table 1.
As Supplementary Table 1 shows, Cluster I (924 patients), mainly associated with negative scores of the first axis, included the healthi-est individuals, mainly young old men with low prevalence of severe diseases and less frequently on polypharmacy (patients with healthy phenotype). Cluster II (791), mostly associated with negative scores of the second axis, included patients, mostly men (87.5%), with a severe multimorbidity profile (ie, severe cardiovascular, pulmonary, and renal diseases) and on polypharmacy (90.3%) (men with mul-timorbidity phenotype). Cluster III (785), associated with negative scores of the third axis, was largely represented by middle old women (94.5%) functionally independent in their daily activities (near 42% of them lived alone and 47% had a BI > 91) and characterized by a healthy lifestyle (74% never drank and 88% never smoked). Almost half of patients with a diagnosis of osteoporosis and arthritis (data not shown) are included in this cluster (independent women with musculoskeletal involvement phenotype). Overweight and obese individuals were mostly included in Clusters II and III (68.9%). Cluster IV (341), associated with positive scores of the second and third axes, was composed of the oldest patients, mostly women
(65%), with increasing cognitive impairment and severe-to-total dependence. The underweight condition was highly prevalent in this cluster (42.8%). The majority of patients with a diagnosis of demen-tia (78.6%—data not shown) were included in this cluster (depend-ent pati(depend-ents with cognitive deterioration phenotype).
Association With Outcomes
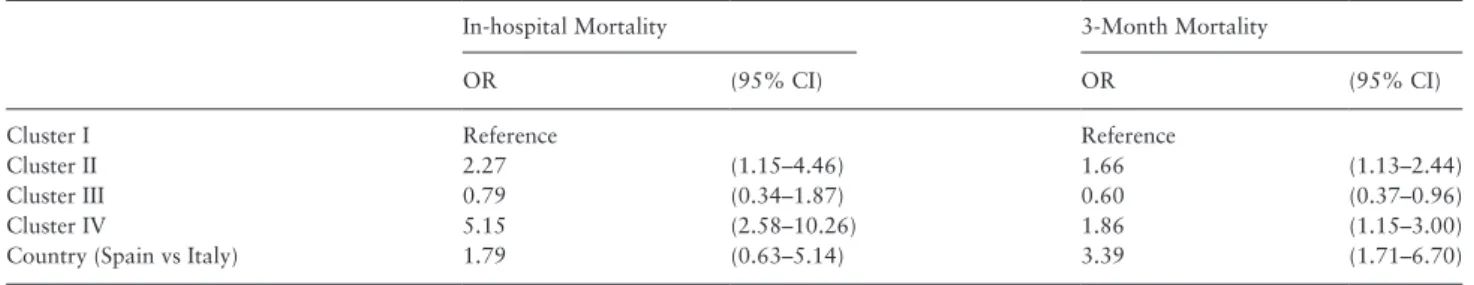
Among the 2,841 patients included in the analyses, for 15 it was not known whether they were discharged alive, so that 2,826 were assess-able. Table 2 shows the prevalence of adverse outcomes (in-hospital mortality, 3-month mortality, and rehospitalization) and the length of hospital stay within each cluster. Globally 71 (2.5%) patients died dur-ing the hospital stay (Supplementary Figure 1). Among 2,008 patients with available follow-up, 181 (9.0%) died within 3 months from discharge. During the 3 months after discharge, overall 552 patients (27.5%) were rehospitalized at least once. Table 3 reports the results of multivariable logistic regression models. There were a significantly higher in-hospital and 3-month mortality in Cluster II and Cluster IV with respect to Cluster I. A higher 3-month mortality was found in Spanish patients. No statistically significant association was found between cluster classification and rehospitalization, but patients in Cluster II had a slightly higher risk of being rehospitalized than those in Cluster I (odds ratio 1.33, 95% confidence interval 1.00–1.76). The type of ward was not associated with adverse outcomes.
Figure 1. Results from hierarchical cluster analysis: the cloud of individuals according to clusters. (Upper panel) The cloud is plotted on the plane determined by
the first and the second factorial axes. (Lower panel) The cloud is plotted on the plane identified by the second and the third factorial axes.
Discussion
Main Study Findings
Using alternative analytical techniques, we explored the relation-ships between commonly and easily assessable variables potentially related to the frailty syndrome in older hospitalized people, and we were able to identify four distinct clusters of patients. Two of these clusters were likely related to a frailty condition, but with different characteristics: The first was mainly composed of middle old men affected by multiple chronic diseases (men with multimorbidity phe-notype) and the second one by the oldest patients, mostly women, with severe cognitive decline and loss of independence (dependent patients with cognitive deterioration phenotype). On the other end, we identified a cluster of healthier individuals with a low prevalence of multimorbidity and polypharmacy (patients with healthy pheno-type). Finally, we identified a fourth cluster composed of middle old women, with the highest prevalence of osteoporosis, arthritis, and related complications (eg, fractures and replacement interventions) but with no significant functional impairment (independent women with musculoskeletal involvement phenotype), often affected by cardiovascular and metabolic morbidities. Our results confirmed an association of the former two clusters with adverse outcomes (in-hospital or 3-month mortality), being the patients with cognitive deterioration phenotype those with the highest in-hospital mortal-ity. The patients with the multimorbidity phenotype had a slightly higher risk of rehospitalization, although not statistically significant.
Interpretation and Practical Implications
Although the physical frailty phenotype has received a wider consen-sus by the scientific community (24), some studies demonstrated that a definition of frailty encompassing a broader spectrum of deficits (such as comorbidities and cognitive and mood decline) could pre-dict the susceptibility to adverse outcomes with higher discrimina-tion than a definidiscrimina-tion limited only to physical dysfuncdiscrimina-tion (25,26).
A previous study showed that measuring frailty in older people admitted to emergency departments for minor injuries helps to screen those at risk of functional decline (27). Thus the characterization of the clinical phenotype among older adults acutely admitted to the
hospital (internal medicine and geriatric wards) and their stratifica-tion according to their risk profile that we propose here could have important implications. It provides clinicians with a useful tool for the stratification of patients on the basis of their specific needs and/ or the screening of patients at risk of frailty with implication on their diagnostic and therapeutic management. Indeed, besides the two phenotypes related to frailty conditions and characterized by a higher risk of adverse outcomes, we identified one cluster of middle old women that, although not associated with a higher incidence of adverse outcomes, could be seen as prefrail, as suggested by the musculoskeletal involvement and the higher prevalence of cardiovas-cular (87.5% of hypertension and 19.7% of ischemic heart disease) and metabolic diseases (29.9% of diabetes). Previous findings estab-lished that declines in executive functioning are associated with risk of frailty onset (28,29) In our study population, the rehospitalization rates within 3 months from discharge were on average high (about 20%) in all four clusters. From a public health perspective, the high prevalence of early rehospitalization even in the healthiest individu-als from Cluster I points out, on one side, the frequent inadequacy of hospital referrals and of the corresponding response from a care setting such as the hospital. Hospitals indeed are traditionally organ-ized as services for the provision of acute cares to organ diseases and not for the management of needs involving the cognitive domain and function. Thus our findings point out the need of a better imple-mentation and integration of social and health care assistance of these patients outside the hospital, in order to improve the postacute phase after hospital discharge, prevent rehospitalization, and delay the progression of frailty.
Limitations and Strengths
The large number of participating centers and their allocation through all Italy and Spain make the study representative of the overall Italian and Spanish settings of internal medicine and geriat-ric wards, even if the latter were less in number. Being the REPOSI a multicenter registry based on voluntary work, missing data are one of the main limitations of the analyses. The assessment of anthropometric and laboratory parameters (eg, body mass index and cholesterol) and geriatric scales (eg, SBT, GDS, and BI) was
Table 3. Results of Multivariable Logistic Regression Models for In-hospital and 3-Month Mortality
In-hospital Mortality 3-Month Mortality
OR (95% CI) OR (95% CI)
Cluster I Reference Reference
Cluster II 2.27 (1.15–4.46) 1.66 (1.13–2.44)
Cluster III 0.79 (0.34–1.87) 0.60 (0.37–0.96)
Cluster IV 5.15 (2.58–10.26) 1.86 (1.15–3.00)
Country (Spain vs Italy) 1.79 (0.63–5.14) 3.39 (1.71–6.70)
Note: CI = confidence interval; OR = odd ratio.
Table 2. Prevalence of Adverse Outcomes and Length of Hospital Stay Within Each Cluster
Cluster I N = 924 Cluster II N = 791 Cluster III N = 785 Cluster IV N = 341 In-hospital mortality, n (%) 13 (1.4) 25 (3.2) 9 (1.2) 24 (7.1) 3-Month mortality, n (%) 49 (7.8) 71 (12.4) 29 (5.0) 32 (14.2) 3-Month rehospitalization, n (%) 121 (19.4) 137 (24.3) 122 (21.1) 465 (20.7) Length of hospital stay, median (IQR) 9 (6–13) 9 (6–14) 9 (6–14) 10 (6–15)
not mandatory at hospital admission, especially during short-term hospitalization. This could partially explain the large amount of missing data for those variables. Comparing the overall population and that included in the analyses, only small differences are noted and none that could be considered clinically significant. Thus miss-ing data have limited impact on the selection of patients included in the analyses. Any difference among Spanish and Italian patients were reflected in the different composition of patient nationality included within each cluster (see Supplementary Table 1). Some possibly relevant variables were either not included (eg, data on the economic status and physical performance) or expected to be underreported (eg, data on hearing and visual impairment and on diagnosis of depression, osteoporosis, dementia, falls, and bed-sores). This represents certainly a limitation in the attempt to char-acterize such a complex phenomenon, as the frailty syndrome, and precludes the possibility to make a comparison with other indica-tors. On the other hand, most of considered variables were com-monly available and easily assessable in daily clinical practice by physicians and other stakeholders. Second, we could not explore the association between phenotypes and the risk of adverse events over a longer time. However, the well-known high rate of short-term adverse event occurring after the hospital admission of an old person (30) makes them a priority of the management plan. Finally, our results were obtained from a hospitalized older cohort so that, although they showed a good degree of stability—internal validation—as proven by the Bootstrap, their generalizability to other settings (ie, community-dwelling people and nursing home residents) should be investigated.
Conclusions
Assessing for frailty at hospital admission has been compared with “predicting speed at traffic lights,” and its clinical utility has been debated if the information on how and how much the patient sta-tus had changed over a certain time before the admission is lack-ing (31). However, it is well known that hospitalization per se represents an accelerating event, a critical turning point at which the slope, whatever the trajectory is, becomes sharper (30,32). Therefore, it is especially in the setting of older inpatients, among whom the chance of adverse events is high, that the identification of different patient profiles, rather than the distinction between those at risk and those not at risk, can help to define the best man-agement according to specific patient needs. This could be helpful both for the clinician and for those involved in the organization of care provision.
Supplementary Material
Supplementary material can be found at: http://biomedgerontology. oxfordjournals.org/
Funding
No funding was received for the conduct of this study or preparation of this manuscript.
Acknowledgments
We acknowledge the clinicians who contributed to the REPOSI registry collec-tion of data (Supplementary Table 2). We acknowledge Patrizia Boracchi, Elia Biganzoli, Emma Riva, Paola Santalucia, and Elena Colombo for their support and useful discussion.
References
1. Fried LP, Tangen CM, Walston J, et al.; Cardiovascular Health Study Col-laborative Research Group. Frailty in older adults: evidence for a pheno-type. J Gerontol A Biol Sci Med Sci. 2001;56:M146–M156. doi:10.1093/ gerona/56.3.M146
2. Fang X, Shi J, Song X, et al. Frailty in relation to the risk of falls, fractures, and mortality in older Chinese adults: results from the Beijing Longitudi-nal Study of Aging. J Nutr Health Aging. 2012;16:903–907. doi:10.1007/ s12603-012-0368-6
3. Song X, Mitnitski A, Rockwood K. Prevalence and 10-year outcomes of frailty in older adults in relation to deficit accumulation. J Am Geriatr Soc. 2010;58:681–687. doi:10.1111/j.1532-5415.2010.02764.x
4. Rockwood K, Mitnitski A. Frailty in relation to the accumulation of defi-cits. J Gerontol A Biol Sci Med Sci. 2007;62:722–727.
5. Rockwood K, Song X, MacKnight C, et al. A global clinical measure of fitness and frailty in elderly people. Can Med Assoc J. 2005;173:489–495. doi:10.1503/cmaj.050051
6. Schuurmans H, Steverink N, Lindenberg S, et al. Old or frail: What tells us more? J Gerontol A Biol Sci Med Sci. 2004;59:M962–M965. doi:10.1093/ gerona/59.9.M962
7. Gobbens RJ1, van Assen MA, Luijkx KG, et al. The Tilburg frailty indi-cator: psychometric properties. J Am Med Dir Assoc. 2010;11:344–355. doi:10.1016/j.jamda.2009.11.003
8. Rolfson DB, Majumdar SR, Tsuyuki RT, et al. Validity and reliability of the Edmonton Frail Scale. Age Ageing. 2006;35:526–529. doi:10.1093/ ageing/afl041
9. Pilotto A, Ferrucci L, Franceschi M, et al. Development and validation of a multidimensional prognostic index for one-year mortality from compre-hensive geriatric assessment in hospitalized older patients. Rejuvenation Res. 2008;11:151–161. doi:10.1089/rej.2007.0569
10. Heim N, van Fenema EM, Weverling-Rijnsburger AW, et al. Optimal screening for increased risk for adverse outcomes in hospitalized older adults. Age Ageing. 2015;44:239–244. doi:10.1093/ageing/afu187 11. Pilotto A, Rengo F, Marchionni N, et al.; FIRI-SIGG Study Group.
Com-paring the prognostic accuracy for all-cause mortality of frailty instru-ments: a multicentre 1-year follow-up in hospitalized older patients. PLoS One. 2012;7:e29090. doi:10.1371/journal.pone.0029090
12. Cigolle CT, Ofstedal MB, Tian Z, Blaum CS. Comparing models of frailty: the Health and Retirement Study. J Am Geriatr Soc. 2009;57:830–839. doi: 10.1111/j.1532-5415.2009.02225.x
13. Theou O, Brothers TD, Mitnitski A, Rockwood K. Operationalization of frailty using eight commonly used scales and comparison of their abil-ity to predict all-cause mortalabil-ity. J Am Geriatr Soc. 2013;61:1537–1551. doi:10.1111/jgs.12420
14. Pérez-Zepeda MU, Cesari M, García-Peña C. Predictive value of frailty indi-ces for adverse outcomes in older adults. Rev Invest Clin. 2016;68:92–98. 15. Nobili A, Licata G, Salerno F, et al.; SIMI Investigators. Polypharmacy,
length of hospital stay, and in-hospital mortality among elderly patients in internal medicine wards. The REPOSI study. Eur J Clin Pharmacol. 2011;67:507–519. doi:10.1007/s00228-010-0977-0
16. Miller MD, Towers A. Manual of Guidelines for Scoring the Cumulative Illness Rating Scale for Geriatrics (CIRS-G). Pittsburg, PA: University of Pittsburgh; 1991.
17. Mahoney FI, Barthel DW. Functional evaluation: the Barthel Index. Md State Med J. 1965;14:61–65.
18. Katzman R, Brown T, Fuld P, et al. Validation of a short orientation-memory-concentration test of cognitive impairment. Am J Psychiatry. 1983;140:734–739. doi:10.1176/ajp.140.6.734
19. Hickie C, Snowdon J. Depression scales for the elderly: GDS, Gilleard, Zung. Clin Gerontol. 1987;6:51–53.
20. De La Higuera L, Riva E Djade CD, et al. Prognostic value of estimated glomerular filtration rate in hospitalized elderly patients. Intern Emerg Med. 2014;9:735–747. doi:10.1007/s11739-013-1028-5
21. Greenacre MJ. Correspondence Analysis in Practice. London, UK: Aca-demic; 1993:32–37.
22. Husson F, Lê S, Pagès J. Exploratory Multivariate Analysis by Example Using R. Boca Raton, FL: Chapman & Hall/CRC; 2011.
23. Hennig C. Cluster wise assessment of cluster stability. Comput Stat Data Anal. 2007;52:258–271. doi:10.1016/j.csda.2006.11.025
24. Morley JE, Vellas B, van Kan GA, et al. Frailty consensus: a call to action. J Am Med Dir Assoc. 2013;14:392–397. doi:10.1016/j. jamda.2013.03.022
25. Kulminski AM, Ukraintseva SV, Kulminskaya IV, et al. Cumulative deficits better characterize susceptibility to death in elderly people than pheno-typic frailty: lessons from the Cardiovascular Health Study. J Am Geriatr Soc. 2008;56:898–903. doi:10.1111/j.1532-5415.2008.01656.x 26. Abellan van Kan G, Rolland YM, Morley JE, Vellas B. Frailty: toward
a clinical definition. J Am Med Dir Assoc. 2008;9:71–72. doi:10.1016/j. jamda.2007.11.005
27. Sirois MJ, Griffith L, Perry J, et al. Measuring frailty can help emergency departments identify independent seniors at risk of functional decline after minor injuries. J Gerontol A Biol Sci Med Sci. In press. doi:10.1093/ gerona/glv152
28. Gross AL, Xue QL, Bandeen-Roche K, et al. Declines and impairment in executive function predict onset of physical frailty. J Gerontol A Biol Sci Med Sci. In press. doi:10.1093/gerona/glw067
29. Fried LP, Bandeen-Roche K, Chaves PH, Johnson BA. Preclinical mobility disability predicts incident mobility disability in older women. J Gerontol A Biol Sci Med Sci. 2000;55:M43–M52. doi:10.1093/gerona/55.1.M43 30. Sager MA, Franke T, Inouye SK, et al. Functional outcomes of acute
medical illness and hospitalization in older persons. Arch Intern Med. 1996;156:645–652. doi:10.1001/archinte.1996.00440060067008 31. Subbe CP, Jones S. Predicting speed at traffic lights—the problem with
static assessments of frailty. Age Ageing. 2015;44:180–181. doi:10.1093/ ageing/afu204
32. Covinsky KE, Palmer RM, Fortinsky RH, et al. Loss of independence in activities of daily living in older adults hospitalized with medical illnesses: increased vulnerability with age. J Am Geriatr Soc. 2003;51:451–458. doi:10.1046/j.1532-5415.2003.51152.x