Clinical Epidemiology
Dove
press
R E V I E Wopen access to scientific and medical research Open Access Full Text Article
Apathy and depressive symptoms in older people
and incident myocardial infarction, stroke, and
mortality: a systematic review and meta-analysis
of individual participant data
Lisa SM Eurelings1,*
Jan Willem van Dalen1,*
Gerben ter Riet2
Eric P Moll van Charante2
Edo Richard1,3
Willem A van Gool1
On behalf of the ICARA Study Group
1Department of Neurology,
Academic Medical Center, University of Amsterdam, Amsterdam, the Netherlands; 2Department of General
Practice, Academic Medical Center, University of Amsterdam, Amsterdam, the Netherlands; 3Donders Institute
for Brain, Cognition and Behaviour, Department of Neurology, Radboud University Medical Centre, Nijmegen, the Netherlands
*These authors contributed equally to this work
Background: Previous findings suggest that apathy symptoms independently of depressive
symptoms measured using the Geriatric Depression Scale (GDS) are associated with cardio-vascular disease (CVD) in older individuals.
Aims: To study whether apathy and depressive symptoms in older people are associated with
future CVD, stroke, and mortality using individual patient-data meta-analysis.
Methods: Medline, Embase, and PsycInfo databases up to September 3, 2013, were
systemati-cally searched without language restrictions. We sought prospective studies with older (mean age ≥65 years) community-dwelling populations in which the GDS was employed and subsequent stroke and/or CVD were recorded to provide individual participant data. Apathy symptoms were defined as the three apathy-related subitems of the GDS, with depressive symptoms the remaining items. We used myocardial infarction (MI), stroke, and all-cause mortality as main outcomes. Analyses were adjusted for age, sex, and MI/stroke history. An adaptation of the Newcastle–Ottawa scale was used to evaluate bias. Hazard ratios were calculated using one-stage random-effect Cox regression models.
Results: Of the 52 eligible studies, 21 (40.4%) were included, comprising 47,625 older people
(mean age [standard deviation] 74 [7.4] years), over a median follow-up of 8.8 years. Participants with apathy symptoms had a 21% higher risk of MI (95% confidence interval [CI] 1.08–1.36), a 37% higher risk of stroke (95% CI 1.18–1.59), and a 47% higher risk of all-cause mortality (95% CI 1.38–1.56). Participants with depressive symptoms had a comparably higher risk of stroke (HR 1.36, 95% CI 1.18–1.56) and all-cause mortality (HR 1.44, 95% CI 1.35–1.53), but not of MI (HR 1.08, 95% CI 0.91–1.29). Associations for isolated apathy and isolated depressive symptoms were comparable. Sensitivity analyses according to risk of bias yielded similar results.
Conclusion: Our findings stress the clinical importance of recognizing apathy independently
of depressive symptoms, and could help physicians identify persons at increased risk of vas-cular disease.
Keywords: apathy, older people, depression, cardiovascular disease, meta-analysis, stroke,
myocardial infarction
Introduction
A number of meta-analyses have reported that depression in older people is associated
with an increased risk of cardiovascular disease (CVD).1–4 From a clinical point of view,
it is important that specific symptom clusters within depression might be differentially
related to incident CVD.5–7 One such symptom cluster is apathy, generally defined
Correspondence: Jan Willem van Dalen Department of Neurology, Academic Medical Center, University of
Amsterdam, 9 Meibergdreef, Amsterdam 1100 DD, the Netherlands
Tel +31 20 566 6889 Fax +31 20 566 9290 Email [email protected]
Journal name: Clinical Epidemiology Article Designation: REVIEW Year: 2018
Volume: 10
Running head verso: Eurelings et al
Running head recto: Apathy, depression, and adverse events in elderly DOI: http://dx.doi.org/10.2147/CLEP.S150915
Clinical Epidemiology downloaded from https://www.dovepress.com/ by 2.232.73.53 on 08-May-2020
For personal use only.
This article was published in the following Dove Press journal: Clinical Epidemiology
Dovepress
Eurelings et al
as disrupted motivation, resulting in reduced goal-driven behavior, cognition, and emotion, although exact definitions vary. We found that in community-dwelling older people, a cluster of three motivational symptoms related to apathy
within the 15-item Geriatric Depression Scale (GDS15)8–10
was associated with an increased risk of incident CVD. There was no such association for the 12 remaining symptoms
within the GDS15.11
This finding corroborated previously reported associa-tions of apathy symptoms with a history of stroke, CVD,
and concurrent cardiovascular (CV) risk factors.8,12 These
findings are consistent with the “vascular apathy” hypothesis, which supposes vascular factors play an important role in
the etiology of apathy in later life.12 Apathy symptoms can
occur in both the context of depression and independently
as an isolated syndrome of disturbed motivation,13
report-edly occurring in around 10%–20% of community-dwelling
older people.8,14–16 However, apathy currently receives little
prominence in diagnostic practice. Determining whether community-dwelling older people with apathy symptoms have an increased risk of CV events is important, since these individuals may be disinclined to engage actively in healthy behavior and be easily overlooked in general practice, because of a tendency to withdraw from medical care due to the nature of the condition.
To corroborate our findings regarding the relation between incident CVD and apathy symptoms, external validation is essential. For this purpose, the Initiative on Cardiovascular Disease Risk and Apathy (ICARA) was set up, which aimed to study the independent relationships of apathy and depres-sive symptoms with myocardial infarction (MI), stroke, and mortality risk, by pooling data from longitudinal cohort stud-ies in community-dwelling older people worldwide. Given our previous findings and the vascular apathy hypothesis, we hypothesized that apathy and depressive symptoms would be independently and differentially associated with MI, stroke, and mortality risk.
Methods
We conducted a participant-data meta-analysis in accor-dance with the Preferred Reporting Items for Systematic Reviews and Meta-analyses of Individual Participant Data (PRISMA-IPD) guidelines and the recommendations
made by Riley et al for conducting IPD analyses.17,18 The
IPD protocol was registered in the PROSPERO database (http://www.crd.york.ac.uk/PROSPERO/display_record. asp?ID=CRD42014013087#.VWSK447tlBc, Supplementary materials). This study was judged exempt from review by
the Amsterdam Academic Medical Center Medical Ethics Committee.
Search strategy and selection criteria
Using the Ovid platform, we searched the Medline, Embase, and PsycInfo databases up to and including September 3, 2013. We did not apply any language restrictions or restric-tions on publication type or year. The full search strategy is described in the Supplementary material. In short, we used relevant keywords to search for longitudinal studies employing any version of the GDS and containing longi-tudinal data on CVD (including peripheral arterial disease [PAD], angina pectoris, and MI) and/or stroke (including transient ischemic attack [TIA]). Furthermore, we screened the bibliographies of selected papers and contacted inves-tigators of a potentially eligible study known through acquaintance.
We included published original research papers that studied samples of community-dwelling older people (mean
age ≥65 years) representative of the general population,
employed a GDS version in which the three apathy items previously identified through several principal-component
analyses were included,8,9 and investigated occurrence of
stroke and/or CVD. There were no restrictions regarding duration of follow-up. Studies that included both community-dwelling and institutionalized participants were eligible only if they were able to distinguish between the two. We tried to maximize representation for the general population by excluding studies that selected participants based on frailty, disability, CV-risk profile, or any specific disease. We also excluded case–control studies, since the control groups of these studies are likely to form a particular selection, rather than a cohort representative of the general population. To balance the required demands of reference screening, study coordination, and data harmonization with the relevance of the data contribution we excluded dissertations, conference
abstracts and studies with a sample size ≤100.
Titles and abstracts of identified papers were screened independently by two reviewers (LE, JWD). Full texts of selected articles were retrieved and papers reporting on the same single study collated. Studies were assessed for eligi-bility independently by both reviewers. Discrepancies were resolved by consensus. A third reviewer was available for consultation where agreement could not be reached (ER). For studies that were cross-sectional but otherwise eligible, PubMed and the Internet were searched for any indication of longitudinal follow-up being available for the study population in question. If so, studies were considered eligible.
Clinical Epidemiology downloaded from https://www.dovepress.com/ by 2.232.73.53 on 08-May-2020
Dovepress Apathy, depression, and adverse events in elderly
Authors of eligible studies were invited to contribute data for our analyses. A reminder was sent after 1 month.
Data, definitions, and statistics
The variables requested and methods used to check data integrity are described in the Supplementary materi-als. Unless reported there, all statistical analyses were prespecified.
Apathy and depressive symptoms
We defined apathy symptoms as a score ≥2 on the three
apa-thy items of the GDS15 apaapa-thy subscale (GDS3A): “Have you dropped many of your activities and interests?”, “Do you prefer to stay at home, rather than going out and doing new things?”, and “Do you feel full of energy?”
(reverse-coded).8,9 These items have been reported to have a sensitivity
of 69% and a specificity of 85% to detect apathy based on
the customary cutoff (>13) of the 14-item apathy scale in
older adults.12 We defined depressive symptoms as a score
≥2 on the 12 remaining items of the GDS15 (GDS12D). For
studies employing GDS versions with >15 items, we selected
the appropriate three and 12 items. We performed separate analyses for apathy symptoms, isolated apathy symptoms
(concurrent GDS3A ≥2 and GDS12D ≤1), depressive
symptoms, and isolated depressive symptoms (concurrent
GDS12D ≥2 and GDS3A ≤1). These cutoffs were based
on analyses in previous studies.11 We conducted sensitivity
analyses in which the more specific ≥5 cutoff for GDS12D
depressive symptoms was used and isolated symptoms were
defined as a score ≥2 on one subscale and a score of 0 on the
other. We excluded individuals with more than one missing item on the GDS3A and/or more than two missing items on the GDS12D from the analyses. Post hoc, a sensitivity analysis was performed with apathy and depressive scores as continuous predictors.
Outcomes
We used time to first fatal or nonfatal MI, first fatal or nonfatal stroke (TIA excluded), and mortality as primary outcomes. Regarding MI and stroke events, these could be both first ever (i.e. incident) or recurrent. Mixed-model Cox proportional-hazard regression was used to calculate hazard ratios (HRs). Mixed-model logistic regression analyses were used to repeat the primary analyses on MI and stroke with the inclusion of studies in which dates of events were unavailable. A sensitivity analysis was conducted, including TIA. Finally, in order to compare results with those of our previous studies, a composite CVD outcome comprising
myocardial infarction (MI), angina pectoris (AP) and
peripheral arterial disease (PAD) was analyzed.11 Because
an exact date of onset may be difficult to establish in cases of AP and PAD, these analyses were performed using logistic regression models. Subanalyses were conducted for CV mortality (primary CV cause of death according to the ICD9 [390–459] or -10 [I00–I99]) and non-CV mortal-ity (all other causes) separately. A detailed description of how vascular variables were harmonized is provided in the Supplementary material. To assess how HRs differed among studies, we plotted and pooled the separate results of fixed-effect Cox analyses in each study for all primary outcomes, using inverse variance-weighted DerSimonian and Laird random-effect models. To quantify heterogeneity,
I2 statistics were used.
Confounders and interaction
Three models were assessed for each outcome. Model 1 was unadjusted, model 2 adjusted for age and sex (in logis-tic regression additionally for study follow-up duration), and model 3 additionally adjusted for history of MI and/or stroke, because these may be confounders in the relationship
of apathy and depressive symptoms with each outcome.11
Interaction analyses were performed to evaluate possible moderation by age, sex, and history of MI and/or stroke. To examine the effect of age on the observed relations in more detail, we performed subgroup analyses within tertiles based on age. Furthermore, subgroup analyses were performed in individuals without a history of MI and/or stroke to facilitate
comparison with our previous analyses.11
Statistical analysis
Random-effect Cox proportional-hazard regression analy-ses were performed in R (version 3.2) using the Coxme
package.19,20 Overall HRs for the IPD meta-analyses were
calculated using a one-stage random-effect model, with independent random slopes in each study for each predictor to account for clustering of participants (ie, clusters based
on study).21 For binary logistic regression analyses, similar
models were used, employing the Lme4 package.22 The R
codes used are described in more detail in the Supplementary material. Statistical analyses were two-tailed, and significance
was set at α=0.05. We plotted and pooled HRs within
indi-vidual studies using the Meta package.23
Bias assessment
We assessed availability bias by comparing distributions of age, sex, and population sizes of participating and
nonpartici-Clinical Epidemiology downloaded from https://www.dovepress.com/ by 2.232.73.53 on 08-May-2020
Dovepress
Eurelings et al
pating studies. Risk of bias was evaluated per study using an adapted version of the Newcastle–Ottawa quality-assessment
scale for cohort studies,24 based on the following
characteris-tics: method of outcome assessment for MI and stroke (self-report only vs other methods); proportion with missing status with regard to occurrence of MI, stroke, and mortality (lower vs higher than the median proportion for that outcome); study design (observational vs experimental); and selected vs general populations according to independent evaluation by
two reviewers (LE, JWD), with selection based on age (≥80
years only), sex, and/or recruitment strategy (specific sample types) (Table S1). Discrepancies were resolved by consensus and consultation with a third author (WAG) if necessary. Sensitivity analyses comparing studies with lower vs higher risk of bias were performed for each primary outcome for each criterion.
Results
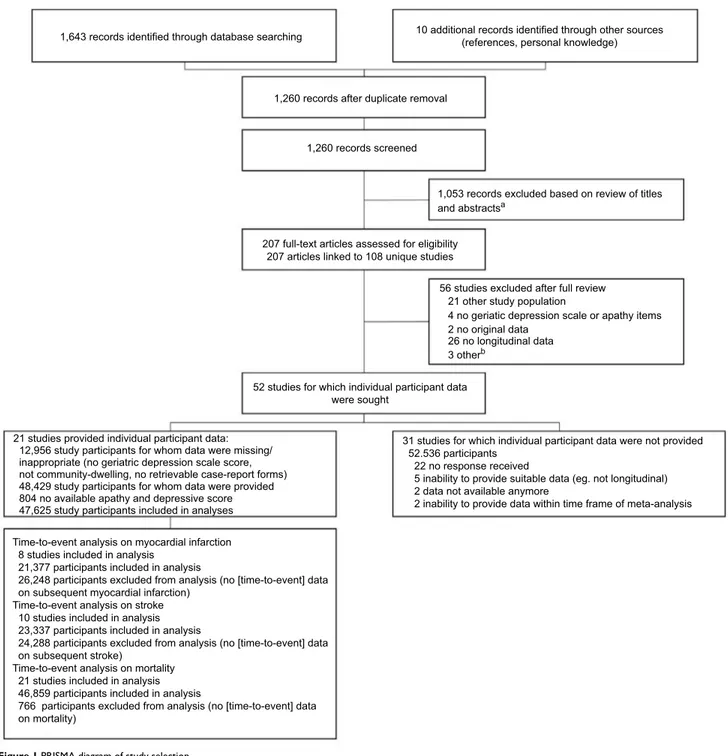
Search results are depicted in Figure 1. A total of 21 (40.4%
of eligible) studies participated,25–45 comprising data from
Figure 1 PRISMA diagram of study selection.
Notes: aDissertation/conference abstract, ≤100 study participants, no longitudinal data, case–control study, no original data, no geriatric depression scale or geriatric depression scale version without apathy items; bone dissertation, one study with ≤100 participants, and full text not available for one study.
1,643 records identified through database searching
1,260 records after duplicate removal
1,260 records screened
1,053 records excluded based on review of titles and abstractsa
207 full-text articles assessed for eligibility 207 articles linked to 108 unique studies
56 studies excluded after full review
52 studies for which individual participant data were sought
21 studies provided individual participant data: 12,956 study participants for whom data were missing/ inappropriate (no geriatric depression scale score, not community-dwelling, no retrievable case-report forms) 48,429 study participants for whom data were provided 804 no available apathy and depressive score 47,625 study participants included in analyses
31 studies for which individual participant data were not provided 52.536 participants
22 no response received
5 inability to provide suitable data (eg. not longitudinal) 2 data not available anymore
2 inability to provide data within time frame of meta-analysis Time-to-event analysis on myocardial infarction
8 studies included in analysis 21,377 participants included in analysis
26,248 participants excluded from analysis (no [time-to-event] data on subsequent myocardial infarction)
Time-to-event analysis on stroke 10 studies included in analysis 23,337 participants included in analysis
24,288 participants excluded from analysis (no [time-to-event] data on subsequent stroke)
Time-to-event analysis on mortality 21 studies included in analysis 46,859 participants included in analysis
766 participants excluded from analysis (no [time-to-event] data on mortality)
21 other study population
4 no geriatic depression scale or apathy items 2 no original data
26 no longitudinal data 3 otherb
10 additional records identified through other sources (references, personal knowledge)
Clinical Epidemiology downloaded from https://www.dovepress.com/ by 2.232.73.53 on 08-May-2020
Dovepress Apathy, depression, and adverse events in elderly
48,429 community-dwelling older people. One study used a slightly modified apathy item on the GDS15. Another study could only provide data on apathy, not on the depression items of the GDS15 (Supplementary material). After exclud-ing participants with neither apathy nor depression scores
(n=804), the final sample consisted of 47,625 older (mean
age 74±7.4 [range 53–105] years) community-dwelling
people (51.5% women). The median follow-up for mortal-ity was 8.8 years, yielding 360,306 person-years in total. In total, 31.1% (14,788 of 47,566) of participants had apathy symptoms, 32.4% (15,093 of 46,624) depressive symptoms, 13.8% (6,541 of 47,243) isolated apathy symptoms, 15.3% (7,169 of 46,947) isolated depressive symptoms, and 16.7% (7,911 of 47,276) both. Table 1 describes the general char-acteristics of the individual study and total ICARA samples. Table S1 describes details on study design, in/exclusion criteria, recruitment strategy, and MI and stroke assessment.
Outcomes
Time-to-event data were available for stroke in ten (n=23,337)
and for MI in eight (n=21,377) studies. MI occurred in 5.7%
(1,217) and stroke in 6.2% (1,452) of individuals. For par-ticipants with and without apathy symptoms, average 5-year risk was 27% vs 16.3% for mortality, 6% vs 3.9% for MI, and 7.4% vs 4.2% for stroke, respectively. Average 5-year risk comparing participants with and without depressive symptoms was 24.7% vs 17.3% for mortality, 4.5% vs 4.6% for MI, and 6.4% vs 4.8% for depressive symptoms, respec-tively. Data on fatal and nonfatal events were provided by all except two studies, which only supplied data on nonfatal
events.27,45 No violations of the proportional-hazard
assump-tion were identified through evaluaassump-tion of survival curves and Schönfeld residuals. Adjusted for age, sex, and history of MI and/or stroke, presence of apathy symptoms increased the hazard of future MI by 21% (HR 1.21, 95% confidence interval [CI] 1.08–1.36) and future stroke by 37% (HR 1.37, 95% CI 1.18–1.59) (Table 2). Depressive symptoms similarly increased the hazard of future stroke by 36% (HR 1.36, 95% CI 1.18–1.56), but increased the hazard of MI less substantially by 8%, with CIs overlapping 0 (HR 1.08, 95% CI 0.91–1.29). Results for isolated apathy and isolated depressive symptoms were comparable to those for apathy and depressive symptoms, respectively.
Sensitivity analyses including TIA in analyses of stroke gave similar results (Table S2). Results of analyses using logistic regression instead of Cox regression models (allow-ing for four additional studies for MI and two for stroke) were also comparable (Table S3). The association between stroke
and depressive symptoms was slightly attenuated when the
GDS12D ≥5 cutoff for depressive symptoms was applied.
A stricter definition for isolated symptoms (0 points on the other subscale) slightly attenuated the association for isolated apathy symptoms with future MI and stroke (Tables S4 and S5). The hazard for the composite outcome of occurrence of MI, AP, and/or PAD was 33% (95% CI 1.20-–1.49) higher for participants with apathy symptoms compared to those without and 8% for participants with depressive symptoms, with CIs overlapping 0 (95% CI 0.85–1.37) (Table S6).
Time-to-event data with regard to all-cause mortality were
provided by all studies (n=46,859). During follow-up, 33.3%
(15,626) of participants died. In the fully adjusted models, both apathy symptoms (HR 1.47, 95% CI 1.38–1.56) and depressive symptoms (HR 1.44, 95% CI 1.35–1.53) increased the hazard of mortality by nearly 50% (Table 2). Associations for isolated apathy and depressive symptom were similar.
Sensitivity analyses using the stricter isolated symptom
definition and those using the GDS12D ≥5 cutoff for
depres-sive symptoms gave comparable results regarding mortality (Tables S7 and S8). ICD codes regarding cause of death were provided by 12 studies. HRs for apathy and depres-sive symptoms seemed slightly higher for non-CV (apathy HR 1.45 [95% CI 1.34–1.57]; depressive HR 1.50 [95% CI 1.35–1.66]) compared to CV mortality (apathy HR 1.38 [95% CI 1.16–1.66]; depressive HR 1.33 [95% CI 1.18–1.51]), and CIs of the estimates overlapped (Table S9).
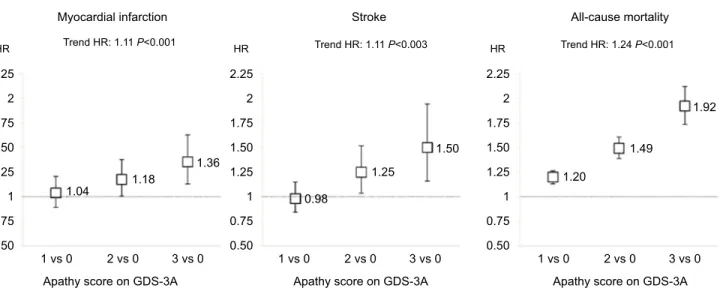
When apathy symptoms were explored as categorical predictors, a dose–response relationship between increasing apathy scores and increasing HRs was found for all outcomes (Figure 2). Pooled analyses of HRs in individual studies gave similar results to the one-stage approach (summarized in Table 3, forest plots in Figures S1–S3). Heterogeneity was
low in analyses of MI (apathy I2=13%, depressive I2=12%,
isolated apathy I2=37%, isolated depressive I2=0), low in
analyses of stroke (all I2=0), and moderate in analyses of
mortality for overall symptoms (apathy I2=47%, depressive
I2=50%), while low for isolated symptoms (both I2=0). Funnel
plots of these analyses showed no indication of publication bias (Figures S4–S6).
Interaction
We observed interactions between age and (isolated) depres-sive symptoms (HR 0.98, 95% CI 0.96–0.99; isolated symp-toms, HR 0.97, 95% CI 0.94–0.99) in their relationship with stroke. This suggests that the relation between (isolated) depressive symptoms and future stroke is stronger in younger participants. These interactions were consistently present
Clinical Epidemiology downloaded from https://www.dovepress.com/ by 2.232.73.53 on 08-May-2020
Dovepress
Eurelings et al
across studies (I2=0). Interaction effects between age and
both apathy and depressive symptoms (both HRs 0.99, 95% CI 0.98–0.99) were present for mortality, suggesting the relationships were stronger in younger individuals. These interactions were also consistent across studies (apathy
symp-toms, I2=32.4%; depressive symptoms, I2=22.9%). Inclusion
of these interaction terms into the fully adjusted models did not meaningfully alter any of the conclusions (data not
shown). In subgroup analyses within tertiles based on age
(<72, 72–77, >77 years), the relationship between apathy
and both MI and stroke was stronger in older subgroups. The relationship between depressive symptoms and stroke appeared stronger in younger subgroups (Tables S10–S12) Subanalyses in participants without a history of MI and/or stroke gave results similar to the main analyses (Tables S13 and S14).
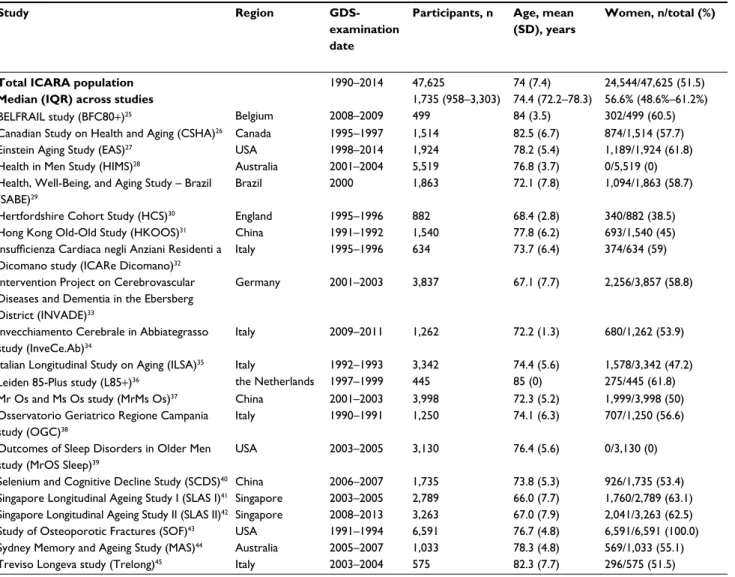
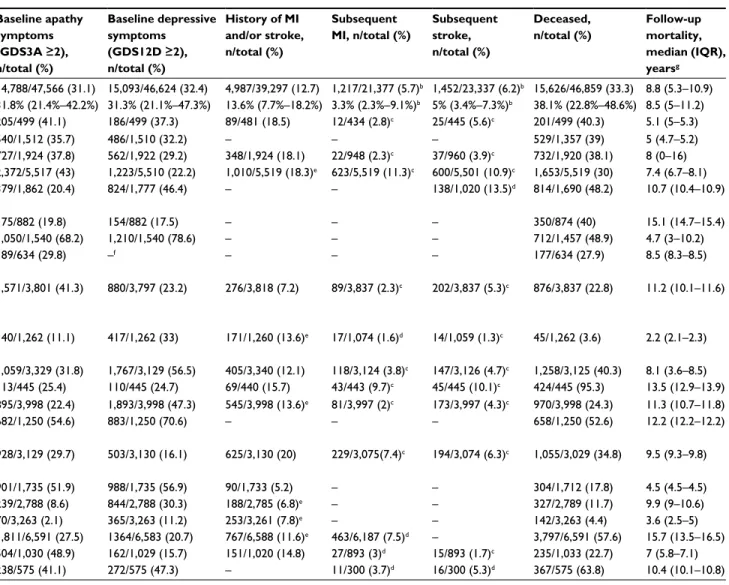
Table 1 Characteristics of total ICARA population and individual study samples included in ICARAa
Study Region
GDS-examination date
Participants, n Age, mean (SD), years
Women, n/total (%) Baseline apathy symptoms (GDS3A ≥2), n/total (%) Baseline depressive symptoms (GDS12D ≥2), n/total (%) History of MI and/or stroke, n/total (%) Subsequent MI, n/total (%) Subsequent stroke, n/total (%) Deceased, n/total (%) Follow-up mortality, median (IQR), yearsg
Total ICARA population 1990–2014 47,625 74 (7.4) 24,544/47,625 (51.5) 14,788/47,566 (31.1) 15,093/46,624 (32.4) 4,987/39,297 (12.7) 1,217/21,377 (5.7)b 1,452/23,337 (6.2)b 15,626/46,859 (33.3) 8.8 (5.3–10.9)
Median (IQR) across studies 1,735 (958–3,303) 74.4 (72.2–78.3) 56.6% (48.6%–61.2%) 31.8% (21.4%–42.2%) 31.3% (21.1%–47.3%) 13.6% (7.7%–18.2%) 3.3% (2.3%–9.1%)b 5% (3.4%–7.3%)b 38.1% (22.8%–48.6%) 8.5 (5–11.2)
BELFRAIL study (BFC80+)25 Belgium 2008–2009 499 84 (3.5) 302/499 (60.5) 205/499 (41.1) 186/499 (37.3) 89/481 (18.5) 12/434 (2.8)c 25/445 (5.6)c 201/499 (40.3) 5.1 (5–5.3)
Canadian Study on Health and Aging (CSHA)26 Canada 1995–1997 1,514 82.5 (6.7) 874/1,514 (57.7) 540/1,512 (35.7) 486/1,510 (32.2) – – – 529/1,357 (39) 5 (4.7–5.2)
Einstein Aging Study (EAS)27 USA 1998–2014 1,924 78.2 (5.4) 1,189/1,924 (61.8) 727/1,924 (37.8) 562/1,922 (29.2) 348/1,924 (18.1) 22/948 (2.3)c 37/960 (3.9)c 732/1,920 (38.1) 8 (0–16)
Health in Men Study (HIMS)28 Australia 2001–2004 5,519 76.8 (3.7) 0/5,519 (0) 2,372/5,517 (43) 1,223/5,510 (22.2) 1,010/5,519 (18.3)e 623/5,519 (11.3)c 600/5,501 (10.9)c 1,653/5,519 (30) 7.4 (6.7–8.1)
Health, Well-Being, and Aging Study – Brazil (SABE)29
Brazil 2000 1,863 72.1 (7.8) 1,094/1,863 (58.7) 379/1,862 (20.4) 824/1,777 (46.4) – – 138/1,020 (13.5)d 814/1,690 (48.2) 10.7 (10.4–10.9)
Hertfordshire Cohort Study (HCS)30 England 1995–1996 882 68.4 (2.8) 340/882 (38.5) 175/882 (19.8) 154/882 (17.5) – – – 350/874 (40) 15.1 (14.7–15.4)
Hong Kong Old-Old Study (HKOOS)31 China 1991–1992 1,540 77.8 (6.2) 693/1,540 (45) 1,050/1,540 (68.2) 1,210/1,540 (78.6) – – – 712/1,457 (48.9) 4.7 (3–10.2)
Insufficienza Cardiaca negli Anziani Residenti a Dicomano study (ICARe Dicomano)32
Italy 1995–1996 634 73.7 (6.4) 374/634 (59) 189/634 (29.8) –f – – – 177/634 (27.9) 8.5 (8.3–8.5)
Intervention Project on Cerebrovascular Diseases and Dementia in the Ebersberg District (INVADE)33
Germany 2001–2003 3,837 67.1 (7.7) 2,256/3,857 (58.8) 1,571/3,801 (41.3) 880/3,797 (23.2) 276/3,818 (7.2) 89/3,837 (2.3)c 202/3,837 (5.3)c 876/3,837 (22.8) 11.2 (10.1–11.6)
Invecchiamento Cerebrale in Abbiategrasso study (InveCe.Ab)34
Italy 2009–2011 1,262 72.2 (1.3) 680/1,262 (53.9) 140/1,262 (11.1) 417/1,262 (33) 171/1,260 (13.6)e 17/1,074 (1.6)d 14/1,059 (1.3)c 45/1,262 (3.6) 2.2 (2.1–2.3)
Italian Longitudinal Study on Aging (ILSA)35 Italy 1992–1993 3,342 74.4 (5.6) 1,578/3,342 (47.2) 1,059/3,329 (31.8) 1,767/3,129 (56.5) 405/3,340 (12.1) 118/3,124 (3.8)c 147/3,126 (4.7)c 1,258/3,125 (40.3) 8.1 (3.6–8.5)
Leiden 85-Plus study (L85+)36 the Netherlands 1997–1999 445 85 (0) 275/445 (61.8) 113/445 (25.4) 110/445 (24.7) 69/440 (15.7) 43/443 (9.7)c 45/445 (10.1)c 424/445 (95.3) 13.5 (12.9–13.9)
Mr Os and Ms Os study (MrMs Os)37 China 2001–2003 3,998 72.3 (5.2) 1,999/3,998 (50) 895/3,998 (22.4) 1,893/3,998 (47.3) 545/3,998 (13.6)e 81/3,997 (2)c 173/3,997 (4.3)c 970/3,998 (24.3) 11.3 (10.7–11.8)
Osservatorio Geriatrico Regione Campania study (OGC)38
Italy 1990–1991 1,250 74.1 (6.3) 707/1,250 (56.6) 682/1,250 (54.6) 883/1,250 (70.6) – – – 658/1,250 (52.6) 12.2 (12.2–12.2)
Outcomes of Sleep Disorders in Older Men study (MrOS Sleep)39
USA 2003–2005 3,130 76.4 (5.6) 0/3,130 (0) 928/3,129 (29.7) 503/3,130 (16.1) 625/3,130 (20) 229/3,075(7.4)c 194/3,074 (6.3)c 1,055/3,029 (34.8) 9.5 (9.3–9.8)
Selenium and Cognitive Decline Study (SCDS)40 China 2006–2007 1,735 73.8 (5.3) 926/1,735 (53.4) 901/1,735 (51.9) 988/1,735 (56.9) 90/1,733 (5.2) – – 304/1,712 (17.8) 4.5 (4.5–4.5)
Singapore Longitudinal Ageing Study I (SLAS I)41 Singapore 2003–2005 2,789 66.0 (7.7) 1,760/2,789 (63.1) 239/2,788 (8.6) 844/2,788 (30.3) 188/2,785 (6.8)e – – 327/2,789 (11.7) 9.9 (9–10.6)
Singapore Longitudinal Ageing Study II (SLAS II)42 Singapore 2008–2013 3,263 67.0 (7.9) 2,041/3,263 (62.5) 70/3,263 (2.1) 365/3,263 (11.2) 253/3,261 (7.8)e – – 142/3,263 (4.4) 3.6 (2.5–5)
Study of Osteoporotic Fractures (SOF)43 USA 1991–1994 6,591 76.7 (4.8) 6,591/6,591 (100.0) 1,811/6,591 (27.5) 1364/6,583 (20.7) 767/6,588 (11.6)e 463/6,187 (7.5)d – 3,797/6,591 (57.6) 15.7 (13.5–16.5)
Sydney Memory and Ageing Study (MAS)44 Australia 2005–2007 1,033 78.3 (4.8) 569/1,033 (55.1) 504/1,030 (48.9) 162/1,029 (15.7) 151/1,020 (14.8) 27/893 (3)d 15/893 (1.7)c 235/1,033 (22.7) 7 (5.8–7.1)
Treviso Longeva study (Trelong)45 Italy 2003–2004 575 82.3 (7.7) 296/575 (51.5) 238/575 (41.1) 272/575 (47.3) – 11/300 (3.7)d 16/300 (5.3)d 367/575 (63.8) 10.4 (10.1–10.8)
Notes: aStudy samples included in the meta-analyses consisted of community-dwelling individuals with an available apathy and/or depression score. All samples population-based. bNumbers concern only studies included in time-to-event analysis. cStudy included in time-to-event analysis and logistic regression analysis. dStudy included in logistic regression analysis only. eIf a history of stroke excluding TIA was not available to create the composite variable history of MI and/or stroke, a history of stroke including TIA was used instead if available. fDue to time constraints in digitalizing individual GDS items from paper case-record forms, the ICARe Dicomano study provided data on the GDS3A items only within the time frame of this meta-analysis. gMedian of mortality follow-up calculated excluding deceased individuals. Number of participants with missing data within each study sample: age – CSHA 6; baseline apathy score – CSHA 2, HIMS 2, ILSA 13, INVADE 36, MAS 3, MrOS Sleep 1, SABE-Brazil 1, SLAS I 1; baseline depression score – CSHA 4, EAS 2, HIMS 9, ICARe Dicomano634 (not available [NA]), ILSA 213, INVADE 40, MAS 4, SABE 86, SLAS I 1, SOF 8; history of MI and/or stroke – BFC80+ 18, CSHA 1,514 (NA), HCS 882 (NA), HKOOS 1,540 (NA), ICARe Dicomano 634 (NA), ILSA 2, INVADE 19, InveCe.Ab 2, L85+ 5, MAS 13, OGC 1,250 (NA), SABE-1,863 (NA), SCDS 2, SLAS1 4, SLAS2 2, SOF 3, Trelong 575 (NA); subsequent MI – BFC80+ 65 (time to event [TTE] and logistic [L]), CSHA 1,514 (NA), EAS 976 (TTE + L), HCS 882 (NA), HKOOS 1,540 (NA), ICARe Dicomano 634 (NA), ILSA 218 (TTE + L), InveCe.Ab 188 (L), L85+ 2 (TTE + L), MAS 140 (L), MrMs Os 1 (TTE + L), MrOS Sleep 55 (TTE + L), OGC 1,250 (NA), SABE 1,863 (NA), SCDS 1,735 (NA), SLAS1 2,789 (NA), SLAS2 3,263 (NA), SOF 404 (L), Trelong 275 (L); subsequent stroke – BFC80+ 54 (TTE + L), CSHA 1,514 (NA), EAS 964 (TTE+L), HCS 882 (NA), HIMS 18 (TTE + L), HKOOS 1,540 (NA), ICARe Dicomano 634 (NA), ILSA 216 (TTE + L), InveCe.Ab 203 (TTE + L), MAS 140 (TTE + L), MrMs Os 1 (TTE + L), MrOS Sleep 56 (TTE + L), OGC 1,250 (NA), SCDS 1,735 (NA), SABE 843 (L), SLAS1 2,789 (NA), SLAS2 3,263 (NA), SOF 6,591 (NA), Trelong 275 (L); number deceased – CSHA 1,57, EAS 4, HCS 8, HKOOS 83, ILSA 217, MrOS Sleep 101, SABE 173, SCDS23. Abbreviations: GDS, Geriatric Depression Scale; MI, myocardial infarction; TIA, transient ischemic attack; ICARA, Initiative on Cardiovascular Disease Risk and Apathy.
Clinical Epidemiology downloaded from https://www.dovepress.com/ by 2.232.73.53 on 08-May-2020
Dovepress Apathy, depression, and adverse events in elderly
Risk of bias
Overall, studies that did not participate in ICARA (n=31)
were smaller than those included (n=21), had slightly older
study populations, and included relatively more women (Supplementary material). Sensitivity analyses comparing studies with higher versus lower risk of bias generally did not give any substantial deviations from the main analysis results, with association magnitudes being similar (Tables S15–S21). However, the evidence was poor in some categorizations, due to substantially smaller sample sizes (eg, experimental study designs [Table S15], self-reported outcomes [Table S19], and high percentage of missing outcomes [Table S20]). Sensitiv-ity analyses with apathy and depressive-symptom scores as continuous predictors (Table S22) showed similar results: in models adjusted for age, sex, and history of MI and/or stroke, the hazard for participants with apathy symptoms for future MI increased, with an 11% per point increase (HR 1.11, 95%
CI 1.04–1.17), for stroke with a 15% per point increase (HR 1.15, 95% CI 1.05–1.26), and for mortality with a 24% per point increase (HR 1.24, 95% CI 1.20-–1.28). Associations were comparable for isolated apathy symptoms. Depressive symptoms gave a 5% increase per point for future stroke (HR 1.05, 95% CI 1.00–1.10) and 9% for mortality (HR 1.09, 95% CI 1.07–1.11). The hazard of MI increased less substantially, by 3% per point increase, with CIs overlapping 0 (HR 1.03, 95% CI 0.99–1.08).
Availability of data
The data used in this paper are available from each individual participating study. However, restrictions apply to the avail-ability of these data, which are not publicly available and were used under license for the current study. Data are however available from the authors upon reasonable request and with the permission of each individual study included.
Table 1 Characteristics of total ICARA population and individual study samples included in ICARAa
Study Region
GDS-examination date
Participants, n Age, mean (SD), years
Women, n/total (%) Baseline apathy symptoms (GDS3A ≥2), n/total (%) Baseline depressive symptoms (GDS12D ≥2), n/total (%) History of MI and/or stroke, n/total (%) Subsequent MI, n/total (%) Subsequent stroke, n/total (%) Deceased, n/total (%) Follow-up mortality, median (IQR), yearsg
Total ICARA population 1990–2014 47,625 74 (7.4) 24,544/47,625 (51.5) 14,788/47,566 (31.1) 15,093/46,624 (32.4) 4,987/39,297 (12.7) 1,217/21,377 (5.7)b 1,452/23,337 (6.2)b 15,626/46,859 (33.3) 8.8 (5.3–10.9)
Median (IQR) across studies 1,735 (958–3,303) 74.4 (72.2–78.3) 56.6% (48.6%–61.2%) 31.8% (21.4%–42.2%) 31.3% (21.1%–47.3%) 13.6% (7.7%–18.2%) 3.3% (2.3%–9.1%)b 5% (3.4%–7.3%)b 38.1% (22.8%–48.6%) 8.5 (5–11.2)
BELFRAIL study (BFC80+)25 Belgium 2008–2009 499 84 (3.5) 302/499 (60.5) 205/499 (41.1) 186/499 (37.3) 89/481 (18.5) 12/434 (2.8)c 25/445 (5.6)c 201/499 (40.3) 5.1 (5–5.3)
Canadian Study on Health and Aging (CSHA)26 Canada 1995–1997 1,514 82.5 (6.7) 874/1,514 (57.7) 540/1,512 (35.7) 486/1,510 (32.2) – – – 529/1,357 (39) 5 (4.7–5.2)
Einstein Aging Study (EAS)27 USA 1998–2014 1,924 78.2 (5.4) 1,189/1,924 (61.8) 727/1,924 (37.8) 562/1,922 (29.2) 348/1,924 (18.1) 22/948 (2.3)c 37/960 (3.9)c 732/1,920 (38.1) 8 (0–16)
Health in Men Study (HIMS)28 Australia 2001–2004 5,519 76.8 (3.7) 0/5,519 (0) 2,372/5,517 (43) 1,223/5,510 (22.2) 1,010/5,519 (18.3)e 623/5,519 (11.3)c 600/5,501 (10.9)c 1,653/5,519 (30) 7.4 (6.7–8.1)
Health, Well-Being, and Aging Study – Brazil (SABE)29
Brazil 2000 1,863 72.1 (7.8) 1,094/1,863 (58.7) 379/1,862 (20.4) 824/1,777 (46.4) – – 138/1,020 (13.5)d 814/1,690 (48.2) 10.7 (10.4–10.9)
Hertfordshire Cohort Study (HCS)30 England 1995–1996 882 68.4 (2.8) 340/882 (38.5) 175/882 (19.8) 154/882 (17.5) – – – 350/874 (40) 15.1 (14.7–15.4)
Hong Kong Old-Old Study (HKOOS)31 China 1991–1992 1,540 77.8 (6.2) 693/1,540 (45) 1,050/1,540 (68.2) 1,210/1,540 (78.6) – – – 712/1,457 (48.9) 4.7 (3–10.2)
Insufficienza Cardiaca negli Anziani Residenti a Dicomano study (ICARe Dicomano)32
Italy 1995–1996 634 73.7 (6.4) 374/634 (59) 189/634 (29.8) –f – – – 177/634 (27.9) 8.5 (8.3–8.5)
Intervention Project on Cerebrovascular Diseases and Dementia in the Ebersberg District (INVADE)33
Germany 2001–2003 3,837 67.1 (7.7) 2,256/3,857 (58.8) 1,571/3,801 (41.3) 880/3,797 (23.2) 276/3,818 (7.2) 89/3,837 (2.3)c 202/3,837 (5.3)c 876/3,837 (22.8) 11.2 (10.1–11.6)
Invecchiamento Cerebrale in Abbiategrasso study (InveCe.Ab)34
Italy 2009–2011 1,262 72.2 (1.3) 680/1,262 (53.9) 140/1,262 (11.1) 417/1,262 (33) 171/1,260 (13.6)e 17/1,074 (1.6)d 14/1,059 (1.3)c 45/1,262 (3.6) 2.2 (2.1–2.3)
Italian Longitudinal Study on Aging (ILSA)35 Italy 1992–1993 3,342 74.4 (5.6) 1,578/3,342 (47.2) 1,059/3,329 (31.8) 1,767/3,129 (56.5) 405/3,340 (12.1) 118/3,124 (3.8)c 147/3,126 (4.7)c 1,258/3,125 (40.3) 8.1 (3.6–8.5)
Leiden 85-Plus study (L85+)36 the Netherlands 1997–1999 445 85 (0) 275/445 (61.8) 113/445 (25.4) 110/445 (24.7) 69/440 (15.7) 43/443 (9.7)c 45/445 (10.1)c 424/445 (95.3) 13.5 (12.9–13.9)
Mr Os and Ms Os study (MrMs Os)37 China 2001–2003 3,998 72.3 (5.2) 1,999/3,998 (50) 895/3,998 (22.4) 1,893/3,998 (47.3) 545/3,998 (13.6)e 81/3,997 (2)c 173/3,997 (4.3)c 970/3,998 (24.3) 11.3 (10.7–11.8)
Osservatorio Geriatrico Regione Campania study (OGC)38
Italy 1990–1991 1,250 74.1 (6.3) 707/1,250 (56.6) 682/1,250 (54.6) 883/1,250 (70.6) – – – 658/1,250 (52.6) 12.2 (12.2–12.2)
Outcomes of Sleep Disorders in Older Men study (MrOS Sleep)39
USA 2003–2005 3,130 76.4 (5.6) 0/3,130 (0) 928/3,129 (29.7) 503/3,130 (16.1) 625/3,130 (20) 229/3,075(7.4)c 194/3,074 (6.3)c 1,055/3,029 (34.8) 9.5 (9.3–9.8)
Selenium and Cognitive Decline Study (SCDS)40 China 2006–2007 1,735 73.8 (5.3) 926/1,735 (53.4) 901/1,735 (51.9) 988/1,735 (56.9) 90/1,733 (5.2) – – 304/1,712 (17.8) 4.5 (4.5–4.5)
Singapore Longitudinal Ageing Study I (SLAS I)41 Singapore 2003–2005 2,789 66.0 (7.7) 1,760/2,789 (63.1) 239/2,788 (8.6) 844/2,788 (30.3) 188/2,785 (6.8)e – – 327/2,789 (11.7) 9.9 (9–10.6)
Singapore Longitudinal Ageing Study II (SLAS II)42 Singapore 2008–2013 3,263 67.0 (7.9) 2,041/3,263 (62.5) 70/3,263 (2.1) 365/3,263 (11.2) 253/3,261 (7.8)e – – 142/3,263 (4.4) 3.6 (2.5–5)
Study of Osteoporotic Fractures (SOF)43 USA 1991–1994 6,591 76.7 (4.8) 6,591/6,591 (100.0) 1,811/6,591 (27.5) 1364/6,583 (20.7) 767/6,588 (11.6)e 463/6,187 (7.5)d – 3,797/6,591 (57.6) 15.7 (13.5–16.5)
Sydney Memory and Ageing Study (MAS)44 Australia 2005–2007 1,033 78.3 (4.8) 569/1,033 (55.1) 504/1,030 (48.9) 162/1,029 (15.7) 151/1,020 (14.8) 27/893 (3)d 15/893 (1.7)c 235/1,033 (22.7) 7 (5.8–7.1)
Treviso Longeva study (Trelong)45 Italy 2003–2004 575 82.3 (7.7) 296/575 (51.5) 238/575 (41.1) 272/575 (47.3) – 11/300 (3.7)d 16/300 (5.3)d 367/575 (63.8) 10.4 (10.1–10.8)
Notes: aStudy samples included in the meta-analyses consisted of community-dwelling individuals with an available apathy and/or depression score. All samples population-based. bNumbers concern only studies included in time-to-event analysis. cStudy included in time-to-event analysis and logistic regression analysis. dStudy included in logistic regression analysis only. eIf a history of stroke excluding TIA was not available to create the composite variable history of MI and/or stroke, a history of stroke including TIA was used instead if available. fDue to time constraints in digitalizing individual GDS items from paper case-record forms, the ICARe Dicomano study provided data on the GDS3A items only within the time frame of this meta-analysis. gMedian of mortality follow-up calculated excluding deceased individuals. Number of participants with missing data within each study sample: age – CSHA 6; baseline apathy score – CSHA 2, HIMS 2, ILSA 13, INVADE 36, MAS 3, MrOS Sleep 1, SABE-Brazil 1, SLAS I 1; baseline depression score – CSHA 4, EAS 2, HIMS 9, ICARe Dicomano634 (not available [NA]), ILSA 213, INVADE 40, MAS 4, SABE 86, SLAS I 1, SOF 8; history of MI and/or stroke – BFC80+ 18, CSHA 1,514 (NA), HCS 882 (NA), HKOOS 1,540 (NA), ICARe Dicomano 634 (NA), ILSA 2, INVADE 19, InveCe.Ab 2, L85+ 5, MAS 13, OGC 1,250 (NA), SABE-1,863 (NA), SCDS 2, SLAS1 4, SLAS2 2, SOF 3, Trelong 575 (NA); subsequent MI – BFC80+ 65 (time to event [TTE] and logistic [L]), CSHA 1,514 (NA), EAS 976 (TTE + L), HCS 882 (NA), HKOOS 1,540 (NA), ICARe Dicomano 634 (NA), ILSA 218 (TTE + L), InveCe.Ab 188 (L), L85+ 2 (TTE + L), MAS 140 (L), MrMs Os 1 (TTE + L), MrOS Sleep 55 (TTE + L), OGC 1,250 (NA), SABE 1,863 (NA), SCDS 1,735 (NA), SLAS1 2,789 (NA), SLAS2 3,263 (NA), SOF 404 (L), Trelong 275 (L); subsequent stroke – BFC80+ 54 (TTE + L), CSHA 1,514 (NA), EAS 964 (TTE+L), HCS 882 (NA), HIMS 18 (TTE + L), HKOOS 1,540 (NA), ICARe Dicomano 634 (NA), ILSA 216 (TTE + L), InveCe.Ab 203 (TTE + L), MAS 140 (TTE + L), MrMs Os 1 (TTE + L), MrOS Sleep 56 (TTE + L), OGC 1,250 (NA), SCDS 1,735 (NA), SABE 843 (L), SLAS1 2,789 (NA), SLAS2 3,263 (NA), SOF 6,591 (NA), Trelong 275 (L); number deceased – CSHA 1,57, EAS 4, HCS 8, HKOOS 83, ILSA 217, MrOS Sleep 101, SABE 173, SCDS23. Abbreviations: GDS, Geriatric Depression Scale; MI, myocardial infarction; TIA, transient ischemic attack; ICARA, Initiative on Cardiovascular Disease Risk and Apathy.
Clinical Epidemiology downloaded from https://www.dovepress.com/ by 2.232.73.53 on 08-May-2020
Dovepress
Eurelings et al
Table 2 Associations of apathy and depressive symptoms with subsequent myocardial infarction, stroke, and all-cause mortality Myocardial infarction*
Model 1e Model 2f Model 3g
Events/total, n HR (95% CI) Events/total, n HR (95% CI) Events/total, n HR (95% CI) Apathya 1,213/21,326 1.41 (1.25–1.58) 1,213/21,326 1.29 (1.15–1.45) 1,211/21,290 1.21 (1.08–1.36)
Apathy, isolatedb 861/14,467 1.46 (1.26–1.69) 861/14,467 1.31 (1.13–1.51) 859/14,446 1.24 (1.08–1.44)
Depressionc 1,204/21,129 1.14 (0.94–1.37) 1,204/21,129 1.11 (0.92–1.34) 1,202/21,094 1.08 (0.91–1.29)
Depression, isolatedd 682/13,870 1.17 (0.95–1.44) 682/13,870 1.17 (0.95–1.44) 681/13,852 1.14 (0.93–1.40)
Stroke**
Model 1e Model 2f Model 3g
Events/total, n HR (95% CI) Events/total, n HR (95% CI) Events/total, n HR (95% CI) Apathya 1,449/23,284 1.62 (1.40–1.87) 1,449/23,284 1.43 (1.23–1.67) 1,449/23,232 1.37 (1.18–1.59)
Apathy, isolatedb 928/15,928 1.57 (1.37–1.80) 928/15,928 1.38 (1.2–1.58) 928/15,892 1.33 (1.15–1.52)
Depressionc 1,430/23,086 1.46 (1.26–1.70) 1,430/23,086 1.39 (1.20–1.61) 1,430/23,035 1.36 (1.18–1.56)
Depression, isolatedd 762/15,291 1.25 (1.04–1.50) 762/15,291 1.22 (1.01–1.46) 762/15,263 1.18 (0.99–1.42)
All-cause mortality***
Model 1e Model 2f Model 3g
Events/total, n HR (95% CI) Events/total, n HR (95% CI) Events/total, n HR (95% CI) Apathya 15,615/46,802 1.75 (1.63–1.87) 15,612/46,796 1.52 (1.44–1.61) 11,984/38,898 1.47 (1.38–1.56)
Apathy, isolatedb 9,198/31,119 1.73 (1.65–1.82) 9,198/31,118 1.46 (1.40–1.53) 7,733/27,576 1.44 (1.36–1.51)
Depressionc 15,268/45,877 1.55 (1.43–1.67) 15,265/45,871 1.46 (1.37–1.56) 11,861/38,691 1.44 (1.35–1.53)
Depression, isolatedd 8,774/31,647 1.38 (1.27–1.50) 8,771/31,642 1.33 (1.25–1.42) 7,042/27,380 1.36 (1.28–1.44)
Notes: aScore ≥2 on the three-item apathy subscale of the Geriatric Depression Scale (GDS3A) and any depression score; bscore ≥2 on the GDS3A in participants with one or no depressive symptoms; cscore ≥2 on the 12-item depression subscale of the GDS (GDS12D) and any apathy score; dscore ≥2 on the GDS12D in participants with one or no apathy symptoms; eunadjusted; fadjusted for baseline age and sex; gadjusted for baseline age, sex, and history of myocardial infarction and/or stroke. Included in analysis: *models 1–3 – BFC80+, EAS, HIMS, ILSA, INVADE, L85+, MrMs Os, MrOS Sleep; **models 1–3 – BFC80+, EAS, HIMS, ILSA, INVADE, InveCe.Ab, L85+, MAS, MrMs Os, MrOS Sleep; ***models 1 and 2 – BFC80+, CSHA, EAS, HCS, HIMS, HKOOS, ICARe Dicomano (apathy analysis only because of unavailable depression scores), ILSA, INVADE, InveCe.Ab, L85+, MAS, MrMs Os, MrOS Sleep, OGC, SABE, SLAS1, SLAS2, SCDS, SOF, Trelong; model 3 – BFC80+, EAS, HIMS, ILSA, INVADE, InveCe.Ab, L85+, MAS, MrMs Os, MrOs Sleep, SCDS, SLAS1, SLAS2, SOF (unavailable history of myocardial infarction and/or stroke for the other studies).
Abbreviations: CI, confidence interval; HR, hazard ratio.
Figure 2 HRs for myocardial infarction, stroke, and all-cause mortality by apathy score in individuals without depressive symptoms.
Notes: Results from Cox proportional-hazard analyses with GDS3A score as predictor adjusted for baseline age, sex, and history of myocardial infarction and/or stroke in individuals without depressive symptoms (GDS12 score ≤1).
Abbreviation: GDS, Geriatric Depression Scale.
Trend HR: 1.11 P<0.001 Trend HR: 1.11 P<0.003 Trend HR: 1.24 P<0.001
HR
0.50
1 vs 0 2 vs 0
Apathy score on GDS-3A Apathy score on GDS-3A
3 vs 0 1 vs 0 2 vs 0 3 vs 0
Apathy score on GDS-3A
1 vs 0 2 vs 0 3 vs 0 0.75 1 1.25 1.50 1.75 2 2.25 HR 0.50 0.75 1 1.25 1.04 1.18 1.36 0.98 1.25 1.50 1.20 1.49 1.92 1.50 1.75 2 2.25 HR 0.50 0.75 1 1.25 1.50 1.75 2 2.25
Myocardial infarction Stroke All-cause mortality
Clinical Epidemiology downloaded from https://www.dovepress.com/ by 2.232.73.53 on 08-May-2020
Dovepress Apathy, depression, and adverse events in elderly
Discussion
In this IPD meta-analysis of a large sample of community-dwelling older people, we found that apathy symptoms, irrespectively of concurrent depressive symptoms, were associated with a higher risk of MI, stroke, and all-cause CV and non-CV mortality. Depressive symptoms were related to a similarly increased risk of stroke and mortality outcomes, but not of MI. These observed associations were independent of age, sex, and history of MI/stroke.
The current study has several strengths. Large-scale meta-analysis of IP data is considered the “gold standard”
for meta-analyses,18 reducing the potential for ecological bias
compared to meta-analyses synthesizing individual study
results.46 An assortment of studies were included with regard
to country of origin and demographic characteristics, increas-ing the generalizability of our findincreas-ings. The risk of publication bias seems limited, given that none of the included studies originally aimed to assess the association between apathy symptoms and vascular outcomes or mortality. Nevertheless, publication bias of the relationship between depression and
CVD could have indirectly influenced our results. Funnel plots of within-study associations, however, suggested the risk of publication bias playing a role in our findings is low. One-stage analyses were performed, which are recommended above two-stage methods, since their statistical approach is more exact, have more power for detection of interaction, and allow for better control of confounding and accounting for heterogeneity by allowing controlling for covariates at
both the participant and study level.21,46 Finally, the data were
extensively explored in a range of sensitivity and interaction analyses.
Although it may be considered a limitation that the apathy and depression subscales have not been validated against a
clinical diagnosis,10 the intention of our study was not to
formally diagnose apathy and/or depression, but rather to explore whether degrees of apathy and depressive symptoms were differentially associated with future vascular disease and mortality. It is important to note that our results pertain to the symptoms in the GDS15, and may not be generalizable to all depressive and apathy symptoms in a clinical interview.
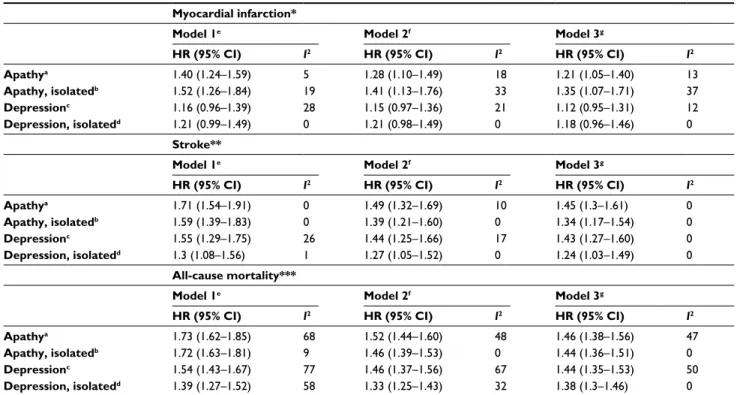
Table 3 Two-stage analyses of associations of apathy and depressive symptoms with subsequent myocardial infarction, stroke, and
all-cause mortality
Myocardial infarction*
Model 1e Model 2f Model 3g
HR (95% CI) I2 HR (95% CI) I2 HR (95% CI) I2
Apathya 1.40 (1.24–1.59) 5 1.28 (1.10–1.49) 18 1.21 (1.05–1.40) 13
Apathy, isolatedb 1.52 (1.26–1.84) 19 1.41 (1.13–1.76) 33 1.35 (1.07–1.71) 37
Depressionc 1.16 (0.96–1.39) 28 1.15 (0.97–1.36) 21 1.12 (0.95–1.31) 12
Depression, isolatedd 1.21 (0.99–1.49) 0 1.21 (0.98–1.49) 0 1.18 (0.96–1.46) 0
Stroke**
Model 1e Model 2f Model 3g
HR (95% CI) I2 HR (95% CI) I2 HR (95% CI) I2
Apathya 1.71 (1.54–1.91) 0 1.49 (1.32–1.69) 10 1.45 (1.3–1.61) 0
Apathy, isolatedb 1.59 (1.39–1.83) 0 1.39 (1.21–1.60) 0 1.34 (1.17–1.54) 0
Depressionc 1.55 (1.29–1.75) 26 1.44 (1.25–1.66) 17 1.43 (1.27–1.60) 0
Depression, isolatedd 1.3 (1.08–1.56) 1 1.27 (1.05–1.52) 0 1.24 (1.03–1.49) 0
All-cause mortality***
Model 1e Model 2f Model 3g
HR (95% CI) I2 HR (95% CI) I2 HR (95% CI) I2
Apathya 1.73 (1.62–1.85) 68 1.52 (1.44–1.60) 48 1.46 (1.38–1.56) 47
Apathy, isolatedb 1.72 (1.63–1.81) 9 1.46 (1.39–1.53) 0 1.44 (1.36–1.51) 0
Depressionc 1.54 (1.43–1.67) 77 1.46 (1.37–1.56) 67 1.44 (1.35–1.53) 50
Depression, isolatedd 1.39 (1.27–1.52) 58 1.33 (1.25–1.43) 32 1.38 (1.3–1.46) 0
Notes: Results from two-stage analyses by pooling results of Cox proportional-hazard analyses within individual studies using DerSimonian and Laird random-effect models (forest plots in Figures S1–S3). aScore ≥2 on the three-item apathy subscale of the Geriatric Depression Scale (GDS3A) and any depression score; bscore ≥2 on the GDS3A in participants with one or no depressive symptoms; cscore ≥2 on the 12-item depression subscale of the GDS (GDS12D) and any apathy score; dscore ≥2 on the GDS12D in participants with one or no apathy symptoms; eunadjusted; fadjusted for baseline age and sex; gadjusted for baseline age, sex, and history of myocardial infarction and/ or stroke. Included in analysis: *models 1–3 – BFC80+, EAS, HIMS, ILSA, INVADE, L85+, MrMs Os, MrOS Sleep; **models 1–3 – BFC80+, EAS, HIMS, ILSA, INVADE, InveCe.Ab, L85+, MAS, MrMs Os, MrOS Sleep; ***models 1 and 2 – BFC80+, CSHA, EAS, HCS, HIMS, HKOOS, ICARe Dicomano (apathy analysis only because of unavailable depression scores), ILSA, INVADE, InveCe.Ab, L85+, MAS, MrMs Os, MrOS Sleep, OGC, SABE-Brazil, SLAS1, SLAS2, SCDS, SOF, Trelong; model 3 – BFC80+, EAS, HIMS, ILSA, INVADE, InveCe.Ab, L85+, MAS, MrMs Os, MrOs Sleep, SCDS, SLAS1, SLAS2, SOF (unavailable history of myocardial infarction and/or stroke for the other studies). Abbreviation: GDS, Geriatric Depression Scale
Clinical Epidemiology downloaded from https://www.dovepress.com/ by 2.232.73.53 on 08-May-2020
Dovepress
Eurelings et al
We could not adjust for all potential confounders, including (chronic) vascular comorbidity, functional and cognitive impairment, socioeconomic status, and education, potentially leading to residual confounding. However, adjustment for some of these characteristics could have led to overadjust-ment, since they could also function as mediators. We tried to reduce the risk that individuals with severe cognitive and functional impairment were included in our analyses by excluding institutionalized individuals. In addition, several studies have found associations of apathy in older people with adverse outcomes independently of disability and
cognition.11,16,47
Although we were able to acquire IPD for a large number of older people, more than half the eligible studies did not participate. These studies seemed to have slightly different population characteristics, suggesting that not including their data may have had some impact on our results. Non-participating studies were smaller, had more women, and slightly older populations. Since older age was a mediator of the associations with apathy symptoms, inclusion of these older cohorts could have decreased the magnitude of the unadjusted associations. Furthermore, although we incorporated studies from all over the world, more variety in population provenance may have allowed investigation into how geography affects these relations, since it has been shown that the exact construct of apathy symptoms within the GDS
may differ among cultures.48 Finally, since we did not have
longitudinal data regarding the development of apathy and depressive symptoms over time, we cannot ascertain whether their stability has an influence on the risk of subsequent unfavorable clinical outcomes.
That apathy symptoms in this IPD meta-analysis were associated with subsequent MI (and also PA and PAD) inde-pendently of depressive symptoms corroborates our previous report of a specific association for apathy symptoms with an
increased risk of CVD11 and concurs with the vascular apathy
hypothesis.12 This IPD meta-analysis is (to our knowledge)
the first to study the association between apathy symptoms and subsequent MI systematically. Previous studies assessing the reverse association consistently reported that a history of vascular disease predicted greater apathy, but not depression
scores.12,49 That apathy symptoms are specifically associated
with future MI is in line with findings in other studies that suggest that motivation-related somatic rather than mood-related depressive symptoms are mood-related to adverse CV
outcomes in older individuals.6,50,51 We found no association
between depressive symptoms and future MI, which may be
contrary to results of several traditional meta-analyses.1–4
However, since no discrimination was made between apathy and depressive symptomatology in these studies, it is possible that those associations were at least partly driven by apathy.
Both apathy and depressive symptoms were associated with a an approximately 37%-higher risk of future stroke. This is contrary to our previous single-cohort study, in which no associations between either apathy or depressive
symptoms and higher future stroke risk were found.11 This
discrepancy can most likely be explained by the far greater statistical power of the current analysis. In addition, the pres-ent study population was slightly younger on average, and both our own results and the previous literature suggest that the relationship between depressive symptoms and future
stroke is stronger in younger people.52,53 The association
of depressive symptoms with future stroke is in line with several meta-analyses that – although not distinguishing between apathy and depressive symptoms – have shown that depression and somewhat less so depressive symptoms are independent risk factors for stroke, increasing the risk
by 20%–45%.52–55
We found an approximately 45% higher hazard for both apathy and depressive symptoms with all-cause mortality. A similarly increased risk of mortality in people with depression
has been demonstrated by several studies.56–59 Studies that
have examined the relation between apathy symptoms and mortality in general community-dwelling older populations are sparse, employed different methods of apathy assessment, and mostly studied specific populations, eg, those with frailty,
heart disease, or dementia.60–64
The mechanisms by which apathy and depressive symp-toms are related to future adverse vascular outcomes are unknown. Conceivably, both causal and noncausal effects play a role. Deleterious health behaviors and CV-risk fac-tors may be induced by apathy and depression and thus partly mediate the reported associations with unfavorable
outcomes.65–70 Other mediators may also be of influence, eg,
reduced compliance with CV-risk management.70
Alterna-tively, the observed associations may be due to a common etiology underlying vascular disease, apathy, and depressive symptoms. It is imaginable that apathy and/or depressive symptoms are markers of underlying subclinical (cerebral) atherosclerosis, which is a strong risk factor for vascular
events.70 Previous studies have associated apathy and
depres-sive symptoms with the presence of white-matter lesions
in older individuals, also without clinical depression.71–75
Although our previous research suggests that the
relation-Clinical Epidemiology downloaded from https://www.dovepress.com/ by 2.232.73.53 on 08-May-2020
Dovepress Apathy, depression, and adverse events in elderly
ship between apathy symptoms and future vascular events
is independent of CV-risk factors,11,67 conceivably apathy
symptoms reflect cerebrovascular damage by long-standing elevated CV risk, eg, midlife hypertension. If apathy is indeed a marker of cerebrovascular damage, such risk factors could be considered confounders underlying the relation between apathy and incident disease. Furthermore, although apathy predicts future vascular events independently of vascular event history, vascular events are a risk factor for apathy. This suggests that the temporal relationship between apathy and vascular events could be bidirectional, corresponding with previous findings that apathy symptoms can also be
preceded by CVD.12
Our finding that symptoms of apathy gave an approxi-mately 20% increased hazard of MI, while depressive symptoms did not seem clearly to increase this hazard, may have several explanations. Apathy symptoms may be more specific markers of underlying cerebrovascular disease, as suggested by the stronger relation with incident stroke, and thus more strongly associated with other incident vascular disease. Alternatively, apathy symptoms may be more sensi-tive to prodromal CV disease, since individuals with poor CV condition may tend to be less outgoing and feel less energetic. The relationship among apathy and depressive symptoms and mortality may be mediated by the increased occurrence of major vascular events, including MI and stroke, which
are among the most important causes of death worldwide.76
Alternatively, both types of symptoms could be manifesta-tions of other underlying condimanifesta-tions that give a higher risk of mortality.
The dose-response relationship between apathy symp-toms and subsequent stroke, MI and mortality, independent of depressive symptoms, together with previous analyses suggesting that apathy predicts CVD over and above the
presence of CV-risk factors,67 stress that recognition of apathy
symptoms in older people is important, regardless of depres-sive symptoms. Although apathy symptoms may manifest themselves in the context of depression, our research adds to the expanding body of evidence highlighting apathy as an
important standalone syndrome.8,12,49,67,77–81 Distinct
associa-tions were found between apathy symptoms and a number of patient-important CV outcomes, including MI, AP, and PAD. Participants with two or more apathy symptoms had a 20%–30%-increased risk of these outcomes, independently of concurrent depressive symptoms. Individuals with a maximum apathy score (10.6% of our study population) had an 88% increased hazard of mortality. These findings imply that more attention on recognizing, detecting, and managing
apathy in general practice is warranted. This is especially relevant, since patients with apathy are less likely to engage
actively in CV-risk prevention and health care.82
It is also important to recognize apathy as an entity distinct from depression, since treatment with selective serotonin-reuptake inhibitors (SSRIs) has not only been found to be ineffective but could also potentially aggravate
apathy.83–85 Given the common and potentially serious side
effects of SSRI treatment in older people, this is especially
undesirable.86,87 If treatment of symptoms could mitigate
the increased risks, based on the risks in the symptom-free populations and fully adjusted models, successful apathy treatment could decrease the absolute 5-year risks for these individuals from 4.7% to 3.9% for MI and from 5.8% to 4.2% for stroke. Depressive-symptom treatment would decrease these risks by 5.0% to 4.6% for MI and from 6.5% to 4.8% for stroke. Increased awareness of apathy in research settings is instrumental in elucidating its specific etiological role in CV disease and increasing the knowledge of its clinical correlates.
In conclusion, this IPD meta-analysis provides substantial evidence that apathy symptoms in community-dwelling older people are associated with an increased risk of future stroke, MI, and mortality, independently of concurrent depressive symptoms. It suggests depressive symptoms are associated with a similarly increased risk of stroke and mortality, but not substantially of MI. These independent associations between apathy symptoms and patient-important outcomes stress the necessity of recognizing apathy in older people independently of depressive symptoms. Future studies may investigate whether these associations are specific for apathy symptoms according to the GDS or also apply similarly to apathy and depressive symptoms according to other scales. Future research could evaluate the effects of change in the presence of these symptoms over time, aim at unraveling the mechanisms underlying their associations with adverse outcomes in later life, and examine whether interventions can prevent or reduce their occurrence and clinical consequences.
ICARA study-group authors and
collaborators
The ICARA study-group authors are as follows: Osvaldo P Almeida, MD, PhD, Tiago S Alexandre, PhD, Bernhard T Baune, MD, PhD, Horst Bickel, PhD, Francesco Cacciatore, MD, PhD, Cyrus Cooper, FMedSci, Ton (A)JM de Craen,
PhD†, Jean-Marie Degryse, MD, PhD, Mauro Di Bari, MD,
PhD, Yeda A Duarte, PhD, Liang Feng, PhD, Nicola Ferrara, MD, Leon Flicker, MB, BS, PhD, FRACP, Maurizio Gallucci,
Clinical Epidemiology downloaded from https://www.dovepress.com/ by 2.232.73.53 on 08-May-2020