1
Facoltà di Farmacia e Scienze della Nutrizione e della Salute
DIPARTIMENTO FARMACO –BIOLOGICO (
MED/04 PATOLOGIA GENERALE)
Dottorato di Ricerca in “Biochimica Cellulare ed Attività dei
Farmaci in Oncologia” (XXIII ciclo)
Estrogens modulate the expression of the
deleted gene homolog phosphatase and
tensin on chromosome 10 (PTEN) in human
seminoma cells TCam2
Docente Tutor Dottoranda
Ch.mo Prof. Sebastiano Andò Carmela Guido
Coordinatore
Prof. Diego Sisci
2
INDEX
Summary………pag. 5
Introduction 8
Materials and Methods 16
Cell cultures 16
Chemicals 16
Plasmids 17
Immunoblotting 17
Reverse Transcription-Polymerase Chain Reaction assay 18
Transient transfection assay 18
Chromatin immunoprecipitation and Re-ChIP assays 19
Electrophoretic Mobility Shift Assay (EMSA) 20
Cell viability assay 21
DNA Fragmentation assay 22
Monodansylcadaverine (MDC) Staining 23
Trasmission Electron Microscopy (TEM) 23
Statistical Analysis 24
Results. . . 25
ERs expression in human seminoma cells
25
PTEN protein and mRNA increased in response to E2
26
E2 Transactivates the PTEN Promoter
28
Functional interaction of ERβ with PTEN by chromatin
immuno-precipitation (ChIP) assay
31
ERβ interacts with PTEN promoter gene through Sp1 site in EMSA 32
3
ERβ is Required for E2-Mediated effects in TCAM2 cells
35
E2 effects on some markers related to the apoptosis
. 37
E2 induces autophagy in TCAM2 cells
40
Discussion 46
References 54
Scientific Publications
Estrogen receptor alpha (ER
) and estrogen receptor
beta (ER
) influence human sperm metabolism and
interact with cytoskeletal proteins: evidence on the
pathophysiology
of
varicocele-associated
male
infertility." (revision 1 on Journal of Cellular
Physiology)
Conventional progesterone receptors (PR) B and PRA
are expressed in human spermatozoa and may be
involved in the pathophysiology of varicocoele: a role
for progesterone in metabolism. Accepted 08.08.2010 on
Int J Androl. 2010
Rimonabant (SR141716) induces metabolism and
acquisition of fertilizing ability in human sperm. Br J
Pharmacol. 2010 159(4):831-41
Human sperm anatomy: ultrastructural localization of
the cannabinoid1 receptor and a potential role of
anandamide in sperm survival and acrosome reaction.
Anat Rec (Hoboken). 2010 293(2):298-309.
Human male gamete endocrinology: 1alpha,
25-dihydroxyvitamin D3 (1,25(OH)2D3) regulates different
aspects of human sperm biology and metabolism. Reprod
Biol
Endocrinol.
2009
30;7:140
These
authors
contributed equally to this work
Insulin and IR-beta in pig spermatozoa: a role of the
hormone in the acquisition of fertilizing ability. Int J
Androl. 2010 33(3):554-62.
4
A new role of anandamide in human sperm: focus on
metabolism. J Cell Physiol. 2009 221(1):147-53.
Leptin and its receptor are expressed in the testis and in
the epididymis of young and adult pigs. Anat Rec
(Hoboken). 2009 292(5):736-45.
Human sperm anatomy: ultrastructural localization of
1alpha,25-dihydroxyvitamin D receptor and its possible
role in the human male gamete. J Anat. 2008
213(5):555-64.
Leptin and leptin receptor in pig spermatozoa: evidence
of their involvement in sperm capacitation and survival.
Reproduction. 2008 136(1):23-32.
5
SUMMARY
Testicular germ cell tumors of adults and adolescents (TGCTs) are the
most common tumor in male. TGCTs can be classified into two main
histological subtypes, seminoma (SE) and nonseminoma (NS). Here the
focus is on SE, by using the TCam-2 cell lines, containing typical
features of human seminoma and originated from a primary testicular
seminoma of a 35-year-old patient. Testicular cancer research continues
to investigate and study therapies aimed to induce cell death in tumor
cells. Estrogens (E2) are regulators of testicular physiology and
function. PTEN, a factor involved in the mechanisms that induce
apoptosis, appears to be essential for the differentiation of testicular
germ cell tumor. The aim of this study was to investigate a potential
functional crosstalk between E2 and PTEN in human seminoma cells, to
improve our understanding in the biology of
testicular
tumor and in the
regulation of the PTEN gene
. First, as the presence of the main mediators
of E2 action, estrogen receptor ERα and ERβ, in our cell type was never
reported, we evidenced that the TCAM2 cells express the ERβ and not
the classical ERα. Upon increasing E2, by western blot and RT-PCR we
observed an increase of PTEN both at protein and mRNA levels.
To evidence if this effect occurs at genomic level, we used a series of
constructs expressing either full length or different deleted regions of the
PTEN promoter gene. Using these mutants, by in vitro trasfection assays,
we identified the sequences required for the modulation of PTEN gene
by E2/ER. Besides, based on the informations concerning the structure
of human PTEN promoter gene we functionally characterized the PTEN
promoter gene region responsive to E2, evidencing that it contains many
Sp1 transcription factor sites.
6
The second specific aim of this research was to study the molecular
interactions among the transcription factors that are involved in PTEN
gene transactivation by E2/ER. By EMSA assay and the ChIp assay we
evidenced that the binding of E2/ER at the promoter gene region of
PTEN identified occurs through Sp1. Furthermore, by ChIp assay we
investigated the expression of RNA pol II, evidencing an increase in the
E2-induced PTEN transcriptional activity. Besides, overexpressing the
dominant negative of ERβ we confirmed that the regulation of PTEN by
E2 occurs through the ERβ in human seminoma cells.
PTEN is the main regulator of the PI3K/AKT pathway that regulates
different cell activities including the cell survival. To test our hypothesis
that the biological significance of the link among E2/ER/PTEN in our
cells is an induction of the cell death, by trypan blue assay we revealed
that this was the case, since TCAM2 cells treated with increasing E2
showed a significantly reduction of cell viability. E2 10 nM in
combination with ICI reverted the effect indicating the ERβ
involvement as our cells do not express the classical ERα. It was also
interesting to show that the effect is potentiated by using a specific
agonist of ERβ, the diarylpropionitrile (DPN).
To gain more insight in the biology of testicular tumors by western
blotting, we first studied the effect of increasing E2 concentrations on
the PI3K/AKT pathway to evaluate if the cell death occurs through the
apoptosis. Our data evidenced that E2 was able to decrease AKT
expression, concomitantly the FHKR and BAD increased suggesting an
apoptotic role of the hormone through the ERβ. However, a faint
increase of caspase-9 and PARP-1 cleavages was obtained and DNA
fragmentation did not occur presenting instead a smear upon E2 10nM.
These results led us to consider other types of cell death.
7
Since PI3K/AKT pathway is shared with the molecular mechanisms that
regulate another type of cell death, ie, autophagy, we wanted to test the
influence of E2 on different proteins that are mainly involved in the
process of autophagy, such as PI3KIII, Beclin-1, AMBRA and UVRAG.
Our results evidenced that E2 increased all these proteins and the effect
was abolished by ICI addressing that E2/ER can induce autophagy in our
cell type.
The biological counterpart of the autophagy in our context was
confirmed by the monodansylcadaverine (MDC) assay and the
transmission electron microscopy (TEM).
Our study suggesting a tumor suppressor role for the ERβ in human
seminoma, indicates that the mechanisms through which E2 induces cell
death in TCAM2 occur mainly through autophagy and not by apoptosis.
Concluding, these data support estrogen-dependency of human testicular
seminoma and candidate the ERβ-ligands for a therapeutic use in the
treatment of this pathological condition.
8
INTRODUCTION
The most abundant malignancies among male population between the ages
of 17 and 45 years are germ cell tumors (GCTs)
and its incidence has
increased 3-4 fold in the last 50 years.
They comprise a heterogeneous
group of neoplasms in terms of their histology, marker expression, and age
of manifestation.
Testicular germ cell tumors of adolescents and adults
(TGCTs) can be classified into seminomatous (SE) and nonseminomatous
tumors (NSE).
Within the testis, three types of GCTs can be diagnosed:
type I (teratomas and yolk-sac tumors of neonates and infants); type II
(seminomas and nonseminomas); type III (spermatocytic seminomas).
Testicular cancer research continues to modify current therapies aimed to
induce cancer cell death and one important cell survival signalling pathway
is mediated by phosphoinositide 3-OH kinase (PI3K) and its downstream
target AKT that is a serine/threonine protein kinase also known as PKB. A
key negative regulator of PI3K/AKT pathway is the tumor suppressor gene
phosphatase and tensin homolog deleted on chromosome ten (PTEN),
(Downes et al., 2007; Stiles et al., 2004), encoding a protein with
phospholipid and protein phosphatase activity (Maehama et al., 2001;
Simpson and Parsons 2001; Waite and Eng 2002).
PTEN negatively regulates the PI3K (Leslie et al., 2002) through the
dephosphorylation in position D3 of phosphatidylinositol
3,4,5-triphosphate (PIP3) and then generating inactive PIP2. PIP3 regulates
PDK1, a kinase that in turn phosphorylates and activates AKT (FIG. 1).
9
FIG.1: The PI3K/AKT/PTEN pathway
Loss of PTEN function in embryonic stem cells and human cancer cell
lines results therefore in PIP3 accumulation and the activation of its
downstream signalling molecule, AKT/PKB. Subsequently, activation of
the PI3K/AKT pathway by the loss of PTEN stimulates various biological
functions, such as cell cycle progression, cell survival and cell migration
The tumor suppressor gene PTEN, is frequently mutated in human cancers,
including brain, breast, endometrial, prostate, and kidney tumors (Cantley
and Neel 1999; Simpson and Parsons 2001) and it is abundantly expressed
in germ cells whereas it was virtually absent from 56% of seminomas as
well as from 86% of embryonal carcinomas, leading to an uncontrolled
stimulation of growth and survival signals.
PTEN appears to be essential for germ cell differentiation and an important
factor in testicular germ cell tumor formation and primordial germ cells
(PGCs), which are the embryonic precursors of gametes (Kimura et al.,
10
2003). Increased mitotic levels, higher percentages of apoptotic cells, and
teratoma formation were observed in vivo for PTEN mutant male gonads.
Despite extensive characterization of PTEN mutations in human cancers
and relatively good understanding of the molecular roles of PTEN in the
control of cellular processes, little is known about the modes of PTEN gene
regulation. Recently, scientists have paid more attention to the regulation of
PTEN expression and it was reported that the transcription of PTEN could
be regulated by p53 and Sp1 (Stambolic et al., 2001; Han et al., 2003).
Salvesen et al., found that PTEN promoter methylation was relatively
frequent in endometrial carcinoma (Salvesen et al, 2001). Till now, the
regulation of PTEN expression is still unclear especially in testicular tumor
cells.
SE resembles primordial germ cells or early gonocytes, the cells from
which all TGCTs are thought to be derived. The most widely accepted
model of TGCTs development proposes an initial tumorigenic event in
utero and the development of a precursor lesion known as intratubular germ
cell neoplasia undifferentiated (ITGCNU), also known as carcinoma in situ
(Skakkebaek, 1972). This is followed by a period of dormancy until after
puberty when TGCTs emerge and this suggests that the TGCTs
development is hormone dependant.
In addition to the role of androgens, recent studies have demonstrated the
importance of estrogen in influencing the male reproductive function (Hess
et al., 1997, Sharpe, 1998). It is well-known capacity of the testis to convert
androgens into estrogens by the enzyme P450 aromatase. The localization
of this enzyme and the role of estrogen in the testis were the subject of
considerable interest during the last decade (Carreau et al., 1998). The
testicular expression of this enzyme has been demonstrated in several
species both in somatic (Sertoli cells and Leydig cells) and in germ cells. It
was shown that estrogens are able to stimulate proliferation of rat neonatal
11
gonocytes in vitro, to induce spermatogenesis in the hypogonadal mouse
(Li et al., 1997, Ebling et al., 2000). Interestingly, 17ß-estradiol (E2)
appears
to be a potent germ cell survival factor in the human testis since is
able to prevent apoptosis of human adult postmeiotic germ cells cultivated
in preserved seminiferous tubules (low concentrations of 17ß-estradiol,
10
-9and 10
-10mol/L, effectively inhibited male germ cell
apoptosis).
Conversely, it was shown that E2 is able to inhibit human
embryonal
carcinoma
cell proliferation in vitro through an estrogen receptor
(ER)β-dependent mechanism suggesting that ERβ acts on germ cells as a tumor
suppressor (Roger et al., 2005) according to the observations made in ERβ
knockout mice by Delbes et al. on neonatal gonocytes (Delbes et al., 2004).
In human testis, gonocytes (Gaskell et al., 2003) and most adult germ cells
(Mäkinen et al., 2001) express mainly ERβ. However, the precise role of
estrogens/ERs (Dupont et al., 2000) and the underlying mechanism(s) in
the control and in the biology of testicular tumors remain to be determined.
PI3K/AKT pathway is shared with the molecular mechanisms that regulate
another type of cell death. Recent reports show that some previously
known oncogenes and tumor suppressor genes impinge upon autophagic
pathways in addition to their other well-known functions. Thus, some steps
in the malignant transformation could result from the deregulation of these
autophagy-related aspects in their mode of action. The PTEN tumor
suppressor gene, class I PI 3-kinase and AKT oncogenes fall into this
category. The tumor suppressor PTEN, has been recently shown to promote
autophagy in HT-29 colon cancer cells (Arico et al., 2001), where PTEN
activity blocked the AKT survival pathway and induced autophagy. This
type of programmed cell death, the autophagy, is becoming an important
area in cancer research. Autophagy is a physiologic process that is involved
in degradation and in the turnover of cytoplasmic organelles. However,
12
progressive autophagy can be cytotoxic and it can substitute, under certain
settings, the apoptosis in induction of cell death.
The process of autophagy has been extensively reviewed elsewhere.
Briefly, a double membrane vesicle forms in the cytosol that encapsulates
whole organelles and bulk cytoplasm. This autophagosome then fuses with
the lysosome where the contents are degraded and recycled (FIG. 2).
13
FIG. 3: Schematic regulation of vesicle nucleation.
Moreover, loss of autophagy is correlated with tumorigenesis and several
inducers of autophagy are tumor-suppressor genes.
Autophagy induction and autophagosome maturation are greatly altered in
cancer tissue. The tumor microenvironment is commonly poor in nutrients
and oxygen, favouring autophagy induction (Mathew et al., 2007).
However, human cancers frequently display inactivating mutations in
pro-autophagy genes (e.g. PTEN, p53, TSC1, TSC2, Beclin 1, UVRAG, Bif-1)
and the activation of anti-autophagy genes (e.g. PI3KCI, AKT, Ras, Bcl-2),
suggesting that autophagy functions as an important barrier for cellular
transformation (Kroemer and Jaattela 2005, Mathew et al., 2007,
Gozuacik
D and Kimchi A 2004) (FIG. 3 and 4). However, the relation of autophagy
to cancer development is complex and multifaceted, depending on the
genetic composition of the cell as well as on the extra-cellular stresses.
14
FIG 4: Autophagy signalling
Many lines of evidence also describe a role for autophagy in antagonizing
cell survival and promoting cell death, classified as autophagic, or type II,
cell death. This discrepancy is partially resolved by the presumption that
extensive activation of autophagy might lead to the disintegration of major
cellular systems, such that ‘‘the point of no return’’ is crossed and recovery
of the cell is unattainable.
In this project we will focalize on SE, by using the TCam-2 cell lines,
containing typical features of human seminoma (
Eckert et al., 2008
)
. As a
functional crosstalk between the ER and PTEN was never reported in the
literature, we will test increasing E2 concentrations to evaluate eventual
effects on the PTEN expression as well as the biological significance of this
potential link. Three different concentration of E2 will be tested as well as
the combination of E2 with ICI 182,780 (ICI) to evaluate the more
efficacious dose able to induce the eventual cell death and if the effect is
15
ER-mediated in human seminoma cell line. Diarylpropionitrile (DPN),
specific agonist of ERβ, will be also used.
Results of this study will begin to determine the regulatory mechanisms
involved in the progression of the testicular tumors, expanding our existing
knowledge concerning the mechanisms which govern estrogen action and
the regulation of the PTEN gene.
16
MATERIALS AND METHODS
Mizuno and coworkers reported isolation and characterization of a cell line
named TCAM-2
(Mizuno et al., 1993)
. T
his cell line originated from
a
primary lesion of a left testicular seminoma (typical pure type seminoma)
of an 35 aged male patient
and was generated initially by in vitro culture,
and also propagated as xenografts in SCID mice.
Using a multidisciplinary
approach, it was concluded that TCAM-2 is representative for seminoma
(
de Jong J. et al., 2008)
.
Cell cultures - Human TCAM-2 seminoma cell line (a gift from Dr.
Leendert H. J. Looijenga
Department of Pathology, Erasmus
MC-University Medical Center Rotterdam, Josephine Nefkens Institute,
TCAM-2 cells were obtained from Sohei Kitazawa (Division of Molecular
Pathology, Kobe University, Japan
) were grown in
RPMI plus 10% fetal
bovine serum (FBS), 1% penicillin/streptomycin, 200 mM glutamine,
at 37
°C in a humidified cell culture incubator with 5% carbon dioxide.
Chemicals - Estradiol (oestra-1,3,5,(10)-triene-3,17-diol) (E2), the Sp1
specific inhibitor mithramycin A and all other chemicals were purchased
from Sigma Chemical (Milan, Italy). Acrylamide bisacrylamide was from
Labtek Eurobio (Milan, Italy). Eosin Y was from Farmitalia Carlo Erba.
2,3-bis (4-hydroxyphenyl)-propionitrile - Diarylpropionitrile (DPN) and ICI
182,780 (ICI) were purchased from Tocris chemical (Bristol, UK).
Monoclonal mouse antibodies (Abs) to human ER (F-10), to human
Beclin1, to human AMBRA, to human UVRAG, to human PI3KCIII, to
human RIP1, rabbit polyclonal Abs to human ER (D-20), ER (H-150),
-actin (AC-15), AKT, FKHR, Poly ADP-ribose polymerase-1(PARP-1),
normal mouse and rabbit IgG, peroxidase-coupled rabbit and
anti-mouse IgG were from Santa Cruz Biotechnology (Heidelberg, Germany).
Anti-caspase 9 Ab was from Cell Signaling (Milan, Italy).Salmon sperm
17
DNA/protein A agarose (UBI, DBA Srl, Milan - Italy) Fugene 6 reagent
was from Roche Diagnostics (Mannheim, Germany). ECL system
(Amersham Pharmacia, Buckinghamshire, UK). Total
RNA Isolation
System kit, enzymes, buffers, nucleotides, and
100-bp ladder used for
RT-PCR were purchased from Promega Corp.
(Milan, Italy). TRIZOL reagent
(Invitrogen) Bradford
protein assay was performed using a kit from
Bio-Rad Laboratories,
Inc. (Milan, Italy). E2 and ICI were dissolved in ethanol
(0.02% final concentration) and used as solvent controls did not induce any
positive result in all in vitro assays (data not shown).
Plasmids - The firefly luciferase reporter plasmid containing the full-length
of the PTEN promoter region [pGL3-2768 (-2 927/-160)] and the different
deletion constructs of PTEN [pGL3-612 (-1 389/-778), pGL3-341 (-1
118/-778), pGL3-139 (-916/-778)] were kind gifts from Prof. Xi-Liang Zha,
(Shanghai Medical College, Fudan University, Shanghai). The ERβ
antisense plasmid (AS/ERβ) contains, in reverse orientation, a 1170 bp
fragment of the coding sequence of the human ERβ cloned in pIRESpuro2
vector (Clontech). The wild type human ERα expression vector (HEGO)
consists of the full-length ERα cDNA fused with the SV40 early promoter
and expressed in the pSG5 vector (HeG0, Tora et al.1989). The Renilla
reniformis luciferase expression vector used was pRL-Tk (Promega, USA).
Immunoblotting – TCAM2 cells were grown in 10 cm dishes to 70-80 %
confluence and exposed to treatments as indicated in 5% dextran coated
charcoal (DCC). Cells were then harvested
in cold phosphate-buffered
saline (PBS) and resuspended
in lysis buffer containing 20 mM HEPES pH
8, 0.1mM EDTA, 5mM MgCl2, 0.5M NaCl, 20 % glycerol, 1 % NP-40,
inhibitors (0.1mM Na3VO4, 1 % PMSF, 20 mg/ml aprotinin). Protein
concentration was determined by Bio-Rad Protein Assay (Bio-Rad
Laboratories, Hercules, CA USA). A 70µg portion of protein lysates was
used for Western Blotting (WB), resolved on a 12 % SDS-polyacrylamide
18
gel, transferred to a nitrocellulose membrane and probed with the indicated
Abs. As internal control, all membranes were subsequently stripped
(glycine 0.2 M, pH 2.6 for 30 minutes at room temperature) of the first
antibody and reprobed with anti-β-actin Ab.
The antigen-antibody complex was detected by incubation of the
membranes for 1 hour at room temperature with the appropriated secondary
antibodies peroxidase-coupled and revealed using the enhanced
chemiluminescence system. Blots were then exposed to film. The intensity
of bands representing relevant proteins was measured by Scion Image laser
densitometry scanning program.
Reverse Transcription-Polymerase Chain Reaction (RT-PCR) assay
TCAM2 cells were grown in 10 cm dishes to 70-80 % confluence and
exposed to treatments for 24 hours in 5% DCC. Total cellular RNA was
extracted using TRIZOL reagent as suggested by the manufacturer. The
purity and integrity were checked spectroscopically and by gel
electrophoresis before carrying out the analytical procedures. The
evaluation of gene expression was performed by RT-PCR method as
previously described. For PTEN and the internal control gene 36B4, the
primers were: 5'CCACCACAGCTAGAACTTATC -3′ (PTEN forward)
and 5'ATCTGCACGCTCTATACTGC3′ (PTEN reverse), 5’-CTC AAC
ATC TCC CCC TTC TC-3’ (36B4 forward) and 5’-CAA ATC CCA TAT
CCT CGT CC-3’ (36B4 reverse) to yield respectively products of 700 bp
with 25 cycles and 408 bp with 12 cycles. The results obtained as optical
density arbitrary values were transformed to percentage of the control
(percent control) taking the samples from untreated cells as 100 %.
Transient transfection assay
TCAM2 cells were transferred into 24-well plates with 500 µl of regular
growth medium/well the day before transfection. The medium was replaced
with 5% dextran coated charcoal (DCC) on the day of transfection, which
19
was performed using Fugene 6 reagent as recommended by the
manufacturer with a mixture containing 0.5 µg of promoter-luciferase
reporter plasmids. After 24 hours transfection, treatments were added in
5% DCC as indicated and cells were incubated for further 24 hours. In a set
of experimets a pre-treatment for 2 hours was performed in the presence of
mithramycin and ICI. Empty vectors were used to ensure that DNA
concentrations were constant in each transfection and pRL-Tk (25 ng/well)
was used to normalize the transfection efficiency. Firefly and Renilla
luciferase activities were measured using the Dual Luciferase Kit
(Promega). The firefly luciferase values of each sample were normalized
by Renilla luciferase activity and data were reported as Relative Light
Units (RLU) values. All the luciferase assays were carried out at least in
triplicate, and the experiments were repeated thrice.
Chromatin immunoprecipitation (ChIP) and Re-ChIP assays
For ChIP assay, TCAM2 cells were grown in 10 cm dishes to 50-60 %
confluence, shifted to 5% DCC for 24 hours and then treated with 10 nM
E2 for 1 hour or pre-incubated with mithramycin for 1 hour where required.
Thereafter, cells were washed twice with PBS and crosslinked with 1 %
formaldehyde at 37 °C for 10 minutes. Next, cells were washed twice with
PBS at 4 °C, collected and resuspended in 200 µl of lysis buffer (1% SDS,
10 mM EDTA, 50 mM Tris-HCl pH 8.1) and left on ice for 10 minutes.
Then, cells were sonicated four times for 10 seconds at 30 % of maximal
power (Sonics, Vibra Cell 500 W) and collected by centrifugation at 4 °C
for 10 minutes at 14,000 rpm. The supernatants were diluted in 1.3 ml of IP
buffer (0.01 % SDS, 1.1 % Triton X-100, 1.2 mM EDTA, 16.7 mM
Tris-HCl pH 8.1, 16.7 mM NaCl) followed by immunoclearing with 80 µl of
sonicated salmon sperm DNA/protein A agarose for 1 hour at 4 °C. The
precleared chromatin was immunoprecipitated with anti-ER Ab and
re-immunoprecipitated with anti-RNA Pol II Ab (Santa Cruz Biotechnology).
20
At this point, 60 µl salmon sperm DNA/protein A agarose were added and
precipitation was further continued for 2 hours at 4 °C. After pelleting,
precipitates were washed sequentially for 5 minutes with the following
buffers: Wash A (0.1 % SDS, 1 % Triton X-100, 2 mM EDTA, 20 mM
Tris-HCl pH 8.1, 150 mM NaCl), Wash B (0.1 % SDS, 1 % Triton X-100,
2 mM EDTA, 20 mM Tris-HCl pH 8.1, 500 mM NaCl), and Wash C (0.25
M LiCl, 1 % NP-40, 1 % sodium deoxycholate, 1 mM EDTA, 10 mM
Tris-HCl pH 8.1), and then twice with TE buffer (10 mM Tris, 1 mM EDTA).
The immunocomplexes were eluted with elution buffer (1 % SDS, 0.1 M
NaHCO3). The eluates were reverse crosslinked by heating at 65 °C and
digested with proteinase K (0.5 mg/ml) at 45 °C for 1 hour. DNA was
obtained by phenol/chloroform/isoamyl alcohol extraction. 2 µl of 10
mg/ml yeast tRNA (Sigma) were added to each sample and DNA was
precipitated with 70 % ethanol for 24 hours at –20 °C, and then washed
with 95 % ethanol and resuspended in 20 µl of TE buffer. A 5 µl volume of
each sample was used for PCR amplification with the following primers
flanking a sequence of PTEN promoter: 5’- CAC GCT CGG CTG AGA
GCT TTC AT -3’ (forward) and 5’- CTT CCC CCA AAT CTG TGT CCT
CA – 3’(reverse) corresponding to the -1398 to -1111 region (Gene Bank,
accession number: AF067844). The PCR conditions were 45 seconds at 94
°C, 40 seconds at 58 °C, and 90 seconds at 72 °C. The amplification
products obtained in 30 cycles were analysed in a 2 % agarose gel and
visualized by ethidium bromide staining. The negative control was
provided by PCR amplification without DNA sample. Samples pretreated
with mytramicin or trasfected with DN/ERb were also used as control.
Electrophoretic Mobility Shift Assay (EMSA)
TCAM2 cells plated into 10 cm dishes were grown to 70-80 % confluence
shifted to SFM for 24 hours and then treated with
increasing concentrations
of E2 (1 nM, 10 nM, and 100 nM) or with 100nM ICI or with 100nM ICI
21
combined with 10 nM E2, for 6 hours. Thereafter, cells were scraped into
1.5 ml of cold PBS. Cells were pelleted for 10 seconds and resuspended in
400 µl cold buffer A (10 mM HEPES-KOH pH 7.9 at 4 °C, 1.5mM MgCl2,
10 mM KCl, 0.5 mM dithiothreitol, 0.2 mM PMSF, 1 mM leupeptin) by
flicking the tube. The cells were allowed to swell on ice for 10 minutes and
then vortexed for 10 seconds. Samples were centrifuged for 10 seconds and
the supernatant fraction discarded. The pellet was resuspended in 50 µl of
cold Buffer B (20 mM HEPES-KOH pH 7.9, 25 % glycerol, 1.5 mM
MgCl2, 420 mM NaCl, 0.2 mM EDTA, 0.5 mM dithiothreitol, 0.2 mM
PMSF, 1 mM leupeptin) and incubated in ice for 20 minutes for high-salt
extraction. Cellular debris were removed by centrifugation for 2 minutes at
4 °C and the supernatant fraction (containing DNA binding proteins) was
stored at –70 °C. The probe was generated by annealing single stranded
oligonucleotides and labeled with
32P-ATP (Amersham Pharmacia) and T4
polynucleotide kinase (Promega) and then purified using Sephadex G50
spin columns (Amersham Pharmacia). The DNA sequence, containing
multiple Sp1sites, obtained from the native PTEN promoter gene used as
probe or as cold competitor is the following: F 5’- GAG AGG TGG GGC
GCT GCA AGG GAG CCG GA and R 5’-TCC GGC TCC CTT GCA
GCG CCC CAC CTC TC. The protein binding reactions were carried out
in 20 µl of buffer 20 mM Hepes pH 8, 1 mM EDTA, 50 mM KCl, 10 mM
DTT, 10% glicerol, 1mg/ml BSA, 50 µg/ml poly dI/dC with 50,000 cpm of
labeled probe, 5 µg of TCAM2 nuclear protein and 5 µg of poly (dI-dC).
The mixtures were incubated at room temperature for 20 minutes in the
presence or absence of unlabeled competitors oligonucleotides. For the
experiments involving the anti-ERβ, anti-ERα and anti-Sp1 Abs (Santa
Cruz Biotechnology), the reaction mixture was incubated with Ab at 4 °C
for 30 minutes before addition of labeled probe. The entire reaction mixture
was electrophoresed through a 6 % polyacrylamide gel in 0 .25 X Tris
22
borate-EDTA for 3 hours at 150 V. Gel was dried and subjected to
autoradiography at –70 °C.
Cell viability assay
TCAM2 were seeded (100 000 cells/well) in a complete
RPMI
medium in
six-well plates and become attached to the bottom of the well overnight. On
the second day, the medium was changed and shifted for 24 h with 5%
DCC. At the end of this time, the cells were treated with
increasing
concentrations of E2 (1 nM, 10 nM, and 100 nM) or with 100 nM ICI or
with 100 nM ICI combined with 10 nM E2, and incubated for 24 h in the
incubator at 37 °C. At the end of this period the cells were harvested by
trypsinization and counted in a hemocytometer using trypan blue exclusion
assay (0.2% trypan blue). The results were expressed as percentage of the
controls, determined by standardizing untreated cells to 100%.
DNA Fragmentation assay
DNA fragmentation was determined by gel electrophoresis. TCAM2
cells
were grown in 10-cm dishes to 80% confluence and treated
with with
increasing concentrations of E2 (1 nM, 10 nM, and 100 nM) or with 100
nM ICI or with 100 nM ICI combined with 10 nM E2. After 24 h cells
were collected and washed with PBS and pelletted
at 1800 rpm for 5 min.
The samples were resuspended in 0.5 ml
of extraction buffer (50 mM
Tris-HCl, pH 8; 10 mM EDTA, 0.5%
SDS) for 20 min in rotation at 4 C. DNA
was extracted with phenol-chloroform
three times and once with
chloroform. The aqueous phase was
used to precipitate acids nucleic with
0.1 vol or of 3 M sodium
acetate and 2.5 volumes cold EtOH overnight at –
20 C.
The DNA pellet was resuspended in 15 µl of H2O treated
with RNAse
A for 30 min at 37 C. The absorbance of the DNA solution
at 260 and 280
23
was subjected to electrophoresis on 1.5%
agarose gels. The gels were
stained with ethidium bromide and
then photographed.
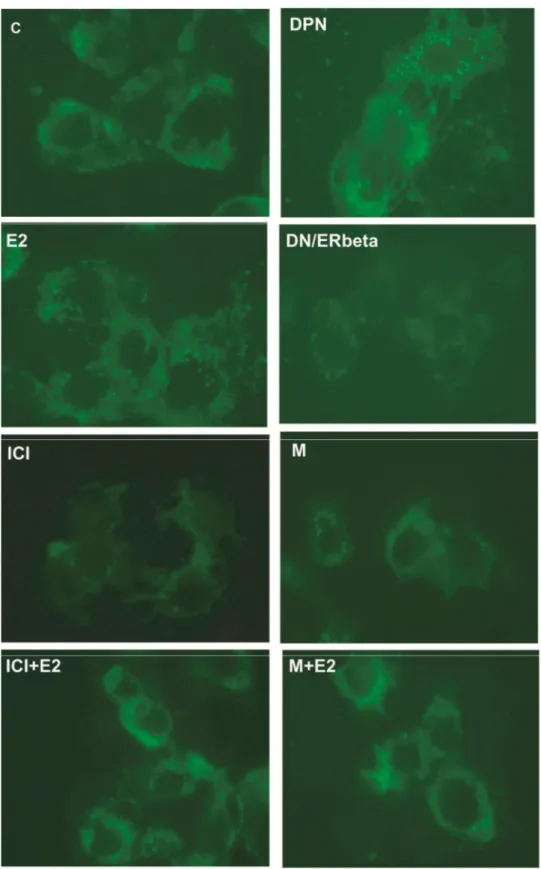
Monodansylcadaverine (MDC) Staining
The MDC is an autofluorescence substance able to selectively mark the
autophagosomes. A 10 mM stock solution of MDC was prepared in PBS.
Following treatment with with increasing concentrations of E2 (1 nM, 10
nM, and 100 nM) or with 100nM ICI or with 100nM ICI combined with
10 nM E2, for 24 h, cells were stained with MDC at a final concentration
of 10 µM for 10 min at 37 °C, and fixed using 3% paraformaldehyde
solution in PBS for 30min. Cells were washed and then examined by
fluorescence microscopy (Leica AF2006).
Trasmission Electron Microscopy (TEM)
The transmission electron microscopy (TEM) allows the study of
ultrastructural details of a biological sample. For routine transmission
electron microscopy, cells were fixed in 3% glutaraldehyde solution in 0.1
M phosphate buffer (pH. 7.4) for 2 h at 4 °C. Then the samples were
postfixed in osmium tetroxide (3%) for 2 h, dehydrated in graded acetone,
and embedded in Araldite (Fluka, Buchs, Switzerland). Ultrathin sections
were prepared using a diamond knife, collected on copper grids and
contrasted using both lead citrate and uranyl acetate. The grids were
examined in a “Zeiss EM 10” electron microscope.
24
STATISTICAL ANALYSIS
The
data
obtained
(six
replicate
experiments
using
duplicate
determinations) are presented as the mean±SEM. The differences in mean
values were calculated using
ANOVA
with Newman–Keuls post hoc test.
Values of P<0.05 were taken to show a significant difference between
means.
25
RESULTS
ERs expression in human seminoma cells
Although an extensive characterization of the TCam-2 cell line to prove
that it is representative for human seminoma was performed, the presence
of the ERs was never reported. As it concerns the classical
ERα, the protein
was not detectable in our cells compared with MCF-7, a human breast
cancer cell line used as positive control, neither by using an anti-ERα Ab
raised against the carboxy-terminal part of ERα (Fig. 5A), nor with an Ab
recognizing the amino-terminal part of ERα Fig 5B. On the contrary, an
intense band was detected by Western blotting at 60 kDa (Fig. 5C)
corresponding to the molecular mass of the ERβ long form.
FIG.5:Immunoblots of estrogen receptors (ERα, ERβ) from protein extracts of
TCam2
Western blot analysis of proteins showed expression of the estrogen receptors (ERs).
Extracts of Tcam2 protein were subjected to electrophoresis on 12%
SDS-polyacrylamide gels, blotted onto nitrocellulose membranes and probed with mouse Ab
to human ERα (A ), rabbit polyclonal Abs to human ERα (B) and ERβ (C). MCF-7
extracts were used as controls. The number on the left corresponds to molecular masses
(kilodaltons) of the marker proteins. The experiments were repeated at least six times,
and the autoradiographs of the figure show the results of one representative experiment.
26
PTEN protein and mRNA increased in response to E2
The precise role of estrogens/ERs and the underlying mechanism(s) in the
control and in the biology of testicular tumors remain to be determined
(Dupont et al. 2000). Despite a relatively good understanding of the
molecular roles of PTEN in the control of cellular processes, little is known
about modes of PTEN gene regulation. In order to evaluate a potential
functional cross-talk between E2/ERs and PTEN we studied the effect of
increasing concentrations of E2 on PTEN expression. Interestingly, E2
upregulated the PTEN protein expression in a dose-dependent manner from
1 nM to 10 nM, while 100 nM did not give significantly effects (Fig.6 A).
Next, we investigated the mRNA expression of PTEN, and it was induced
by E2 in a similar pattern as it was obtained for the protein (Fig. 6 B). ICI
failed to cause an increase in PTEN protein and mRNA levels, suggesting a
direct involvement of the ER in mediating this effect.
27
FIG. 6: E2 up-regulates PTEN protein and mRNA expression in TCAm2 cells.
(A) Immunoblots of PTEN from TCam2 cells treated for 24 h with vehicle (-),
increasing E2 (1,10,100 nM) concentrations, 1µM ICI alone or in combination with 10
nM E2. b-actin was used as loading control. The side panel shows the quantitative
representation of data (mean ± S.E.M.) of three independent experiments including that
of A. (B) Semiquantitative RT-PCR evaluation of PTEN mRNA expression. TCam2
cells were treated as in A. 36B4 mRNA levels were determined as control. The side
panel shows the quantitative representation of data (mean ± SEM) of six independent
experiments including that of B after densitometry and correction for 36B4 expression.
*P<0.05 E2-treated vs untreated cells; **P<0.01 E2-treated vs. untreated cells
28
E2 Transactivates the PTEN Promoter
To investigate whether one of the mechanisms involved in the
ER-mediated increase of PTEN expression could be a direct modulation of the
transcriptional activity of its promoter, transient trasfection assays were
performed in TCAM2 cells. Luciferase reporter constructs containing a
series of deletion mutants of the human PTEN promoter gene were used to
more precisely define the effect of E2 on PTEN transcription. A construct
contains the fragment of the 5’-flanking region from human PTEN gene,
corresponding to the region spanning from bases -2927/-160 bp
(pG13-2768, full length). Further deletions of the 5’-flanking region and a deletion
of the 5’-untranslated region from PTEN gene were present in the
following constructs: 1389/778 (pG13612), 1118/778 (pG13341),
-916/-778 (pG3-139) (Fig. 7A).
The results shown in Fig. 7B indicated that transcription from the construct
pG13-2768 was detectable, particularly it was enhanced by 1 nM E2 while
it decreased upon 10 nM and 100 nM E2. The plasmid pGL3-2768 (-2
927/-160), which contained full-length promoter, appeared to have lower
activity than that of pGL3-612 (-1 389/-778), suggesting the presence of
potential negative regulatory regions located within the sequence spanning
from -777/-160. In fact, by using the pG13-612 construct, the promoter
activity increased upon E2 treatment in a dose-dependent manner, while
this effect was abrogated by ICI, indicating that PTEN promoter activation
by E2 requires the presence of a functional ER (Fig. 7B). E2 failed to
enhance the transcriptional activity of the PTEN promoter when cells were
transfected with pG13-341 and pG3-139 constructs, suggesting that the
segment located between -1398 and –1118 relative to the translation
initiation site is important for E2-responsiveness.
By analyzing this DNA sequence to search potential binding sites for
transcription factors nucleotide sequences, we observed that the
29
aforementiond region contains several DNA motifs known to bind the
transcription factor Sp1. Mithramycin is a drug able to bind to GC boxes
and then to inhibit Sp1 binding selectively blocking mRNA synthesis from
genes that contain functional
recognition sites both in vitro and in vivo (Blume et al., 1991). As shown in
Fig. 7C, in TCAM2 cells transfected with pG13-612 construct and treated
with mithramycin, the PTEN transactivation upon 10 nM E2 was
prevented. Altogether these data strongly suggest that Sp1 plays an
important role in the transcriptional regulation of PTEN by E2/ER.
30
FIG. 7: E2 transactivates PTEN promoter gene in TCam2 cells.
Schematic map of the PTEN promoter fragments used in this study. (B) TCam2 cells
were treated for 24 h with vehicle (-), increasing E2concentrations, 1µM ICI alone or in
combination with 10 nM E2. (C)TCam2 cells were treated for 24 h with vehicle (-), 10
nM E2, 100 nM mithramycin (M) alone or in combination with 10 nM E2. The
luciferase activities were normalized to the Renilla luciferase as internal transfection
control and data were reported as RLU values. Columns are mean ± SEM of six
independent experiments performed for six times. *P<0.05 E2-treated vs untreated cells,
**P<0.01 E2-treated vs untreated cells. RLU, Relative Light Units.
31
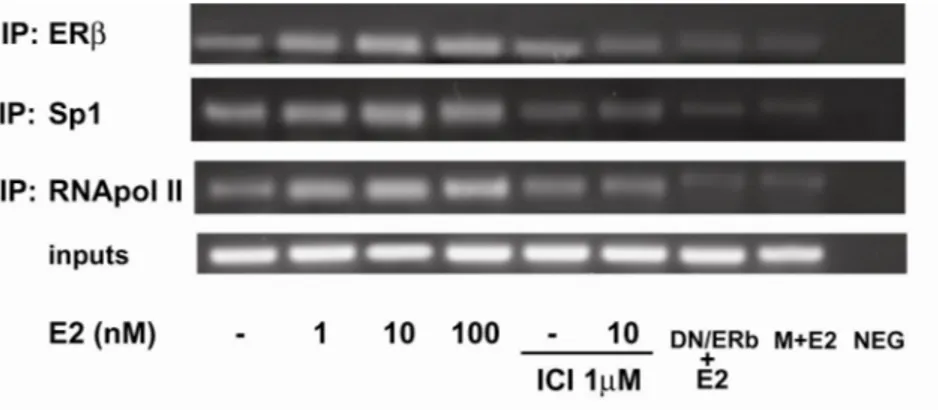
Functional interaction of ERβ with PTEN by chromatin
immuno-precipitation (ChIP) assay
The interaction of ERβ with the PTEN gene promoter was further
investigated by ChIP assay. TCam2 chromatin was immunoprecipitated
with the anti-ERβ Ab and then reprecipitated with the anti-RNA-Pol II or
anti-Sp1 Abs. PCR was used to determine the recruitment of ERβ to the
PTEN region containing the Sp1 sites. The results indicated that ERβ was
weakly constitutively bound to the PTEN promoter in untreated cells and
this recruitment was increased upon E2 treatment (Fig.8). In addition, by
Re-ChIP assays an increased association of Sp1 was obtained. Particularly
the augmented RNA-Pol II recruitment indicated that a positive regulation
of PTEN transcriptional activity was induced by E2 (Fig.10). The physical
interaction of ERβ and Sp1 proteins to our sequence was strengthened by
the absence of amplification in samples trasfected with the DN/ERβ or
treated with mytramicin (Fig.8).
The negative control was performed by
PCR amplification without DNA sample.
FIG. 8: Functional interaction between ERβ and PTEN promoter.
TCam2 cells were treated as indicated, then cross-linked with formaldehyde and lysed.
The soluble chromatin was immunoprecipitated with the anti-ERβ Ab, (Re-ChIP with
the anti-RNA Pol II and anti-Sp1 Abs). The PTEN promoter sequence containing Sp1
was detected by PCR with specific primers, as described in Materials and Methods. To
control input DNA, PTEN promoter was amplified from 30 µl of initial preparations of
soluble chromatin (before immunoprecipitations). M: mithramycin. NEG is a negative
control provided by PCR amplification without DNA sample.
32
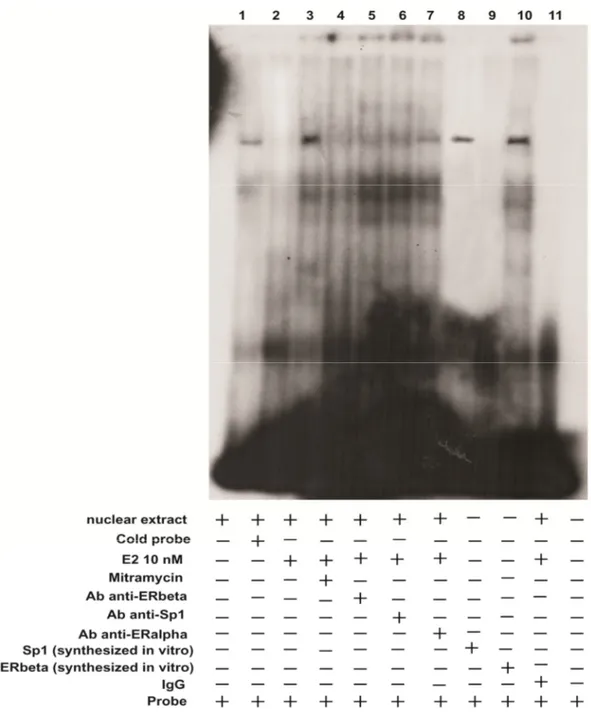
ERβ interacts with PTEN promoter gene through Sp1 site in EMSA
To gain further insight into the mechanism involved in the PTEN
transactivation induced by E2, we performed EMSA using a synthetic
oligodeoxyribonucleotide which contains the E2-responsive region of the
PTEN promoter identified and containing the Sp1 binding motifs. We
tested if E2-action on the above identified PTEN promoter region occurs
through the interactions of ERβ and /or Sp1.
In nuclear extracts from TCam2 cells we observed the formation of a
specific complex (Fig 9, lane 1) which was increased upon 10 nM E2
treatment (lane 3). The binding was abrogated by 100 fold molar excess of
unlabelled probe (lane 2), demonstrating the specifity of the DNA-binding
complex.
To confirm that PTEN transcription induced by E2 in TCam2 cells is
regulated by Sp1, nuclear extracts were incubated with mithramycin and in
the reaction mixture strongly reduced the intensity of the bands (Fig. 9 lane
4). The involvement of ERβ and Sp1 in the DNA-binding complexes was
confirmed by using the specific anti-ERβ (lane 5) and anti-Sp1 Abs (lane
6), since both induced supershift and immunodepletion of the bands. By
using the anti-ERα Ab no difference with respect the non treated sample
was observed (lane 7). The ERβ and the Sp1 synthesized in vitro (lanes 8
and 9 respectively) demonstrated that the binding to our probe occurs
through the Sp1.
In control samples (IgG),normal mouse or rabbit IgG,
respectively, was used instead of the primary Abs as control of Ab
specificity. Lane 11 containing probe alone did not show any complex
33
FIG. 9: ERβ binds through the Sp1 within the PTEN promoter region in EMSA.
Nuclear extracts from TCam2 cells (lane 1) were incubated with a labeled probe or not
labeled used as cold competitor containing bases, obtained from the native PTEN
promoter gene from: F 5’- GAG AGG TGG GGC GCT GCA AGG GAG CCG GA and
R 5’-TCC GGC TCC CTT GCA GCG CCC CAC CTC TC and subjected to
electrophoresis in a 6% polyacrylamide gel. In lane 3, nuclear extracts from PTEN were
treated with 10 nM E2. Competition experiments were performed adding as competitor
a 100-fold molar excess of unlabeled PTEN probe (lane 2) or 100 nM mithramycin
(lane 4). Anti-ERβ and anti-Sp1 Abs were incubated with nuclear extracts from TCam2
cells treated with 10 nM E2 (lanes 5 and 6, respectively). In lanes 8 and 9 the ERβ and
the Sp1 synthesized in vitro respectively, were incubated with the probe alone. In
control samples (IgG),normal mouse or rabbit IgG, respectively, was used instead of the
primary Abs as control of Ab specificity. Lane 11 contains probe alone.
34
E2 induces cell death in TCAM2 cells
PTEN negatively regulates cell growth and survival in different cell types.
Therefore, we studied if the functional significance of the E2/ERβ/PTEN
link may consist in the modulation of TCAM2 cell survival by trypan blue
exclusion assay. Our cells exposed to increasing E2 exhibited a dose–
responsive decrease in cell viability after 24 hours. Lower E2 concentration
did not induce significant changes, while 10 nM and 100 nM E2 produced
a significant decrease (Fig. 10). Cells treated with increasing concentration
of a specific ER agonist, DPN evidenced an earlier decrease of the cell
viability from 1 nM DPN.
FIG. 10: E2 induces cell death in TCAM2 cells and DPN potentiates the effect.
The viability of TCam2 cells decreased significantly at 10 and 100 nM of E2. The
effect results higher with increasing concentration of DPN. Treatment of cells with ICI
alone or in combination with E2 as like as DN/ERβ trasfected cells and mytramicin in
combination with E2 does not affect the cell viability. Columns are mean ± SEM of six
independent experiments. *P<0.05 E2-treated vs untreated cells, **P=0.01 E2-treated vs
untreated cells. ***P<0.01 E2-treated vs untreated cells.
35
ERβ is Required for E2-Mediated effects in TCAM2 cells
The PTEN protein dephosphorylates position D3 of phosphatidylinositol
3,4,5-triphosphate (PIP3) and generates inactive PIP2. PIP3 is a direct
product of PI3K that regulates and activates AKT, and then PTEN is a key
negative regulator of the AKT activity. Therefore, we first studied whether
E2 stimulation of TCAM2 has some effect on AKT expression.
As shown in Fig. 11 the AKT content diminished particularly at 10 nM E2,
while the combination of ICI and E2 restored AKT levels, addressing an
ER-mediated effect. In this manuscript we demonstrated that TCAM2 cells
express ERβ and not the classical ERα, however to sustain that the E2
action in this context is mediated by ERβ we transfected the cells with
DN/ERβ and then treated for 24 hours as previously indicated. As expected
in the absence of ERβ no difference in the AKT content was observed (Fig.
11) among the different treatments. On the contrary, in the presence of
ectopic classic ERα (cells trasfected with HEGO), a dose-dependent
increase in the Akt content was obtained upon E2.
36
FIG. 11: E2 effects on AKT
Immunoblots of AKT from TCam2 cells treated for 24 h with vehicle (-), increasing E2
(1,10,100 nM) concentrations, 1µM ICI alone or in combination with 10 nM E2. β-actin
was used as loading control. AKT not revealed difference in TCam 2 cells transfected
with DN/ERβ while results increased in cells transfected with pSG5-HEGO encoding
ERα. The lower panel shows the quantitative representation of data (mean ± S.E.M.) of
six independent experiments . Columns are mean ± SEM of six independent
experiments. *P<0.05 E2-treated vs untreated cells, **P=0.01 E2-treated vs untreated
cells. ***P<0.01 E2-treated vs untreated cells.
37
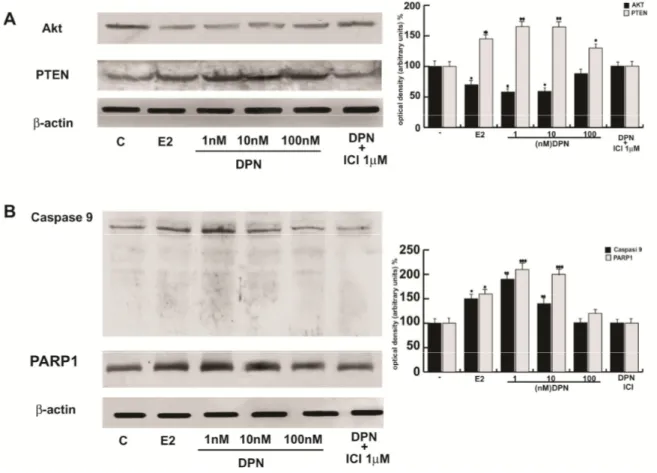
E2 effects on some markers related to the apoptosis.
PTEN acts as a tumor suppressor
by antagonizing PI3K, which activates
the
AKT that in turn activates proliferative
and antiapoptotic signaling
pathways. A number of downstream targets of AKT have been described,
including the proapoptotic proteins BAD and FKHR. The amount of these
two proteins increased upon E2 treatment and the effect was abrogated by
ICI (Fig. 12A). These data may indicate that E2 induces apoptosis in
TCAM2 cells, therefore we evaluated the effects of the steroid on different
markers of the apoptosis such as caspase9, PARP1 and DNA
fragmentation. During apoptosis, caspase-7 and caspase-3 cleave PARP1
into two fragments: p85 and p24, inactivating the protein (Tewari et al.,
1995; Germain et al., 1999). PARP1 cleavage aims at preventing the
activation of PARP1 by the ensuing DNA fragmentation and thereby
preserving cellular energy for certain ATP sensitive steps of apoptosis.
It appears from the panel A and B in the Fig. 12 C that faint cleavages
occurred both for caspase9 and PARP1 upon E2 treatments. DNA
degradation is considered a diagnostic hallmark of cells undergoing
apoptosis. Unfortunately, no DNA fragmentation was obtained under E2
treatment in TCam2 cells instead a DNA smear occurred. The smear was
not observed when we treated the cells with ICI or mytramicin.
38
FIG. 12: E2 did not induces apoptosis in TCAM2 cells.
TCam2 cells were treated for 24 h as indicated. Fkhr and BAD (A) protein expression
(evaluated by WB) in TCam2 cells increased upon increasing concentration of E2.
b-actin was used as loading control. Caspase 9 and PARP 1 and their faint cleavage
product are evidenced upon E2 (B).One of three similar experiments is presented.
β-actin was used as loading control on the same stripped blot. The side panels show the
quantitative representation of data (mean ± SEM) of six independent experiments.
Columns are mean ± SEM of six independent experiments (C) DNA laddering was
performed in TCAM2 cells treated for 24h as indicated.. *P<0.05 E2-treated vs
untreated cells, **P<0.01 E2-treated vs untreated cells.
39
However to investigate if the selective ligand of ER was able to enhance
cell death in human seminoma cells, we used increasing DPN. In Fig. 13 it
is possible to note that DPN potentiated the effect of E2 both on AKT and
PTEN expression, this also occurs in the panel B with casapse 9 and
PARP1.
FIG. 13: DPN potentiates the effect of E2 in human seminoma cells
By
Western Blot on protein extracts from TCam2 cells as previously described and
treated as indicated, selective ERβ agonist DPN potentiate the effect of E2 both on AKT
and PTEN expression (A), this also occurs in the panel B with caspase9 and PARP1 (B).
To verify equal loading, the membranes were stripped and probed with an antibody
against β-actin. The side panels show the quantitative representation of data (mean ±
SEM) of six independent experiments. Columns are mean ± SEM of six independent
experiments. *P<0.05 E2-treated vs untreated cells, **P=0.01 E2-treated vs untreated
cells. ***P<0.01 E2-treated vs untreated cells,
40
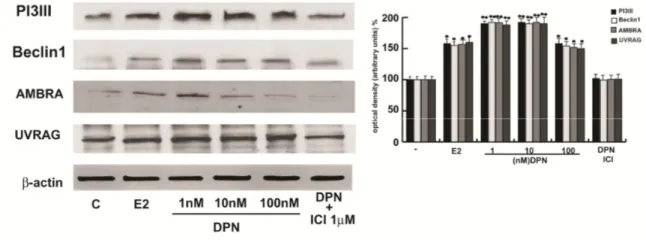
E2 induces autophagy in TCAM2 cells
In order to define the type of cell death in our context and as the autophagy
converge also at the PI3K/AKT signalling we examined if E2/ERβ induced
autophagy in TCAM2 cells. First, we evaluated the occurrence of this other
programmed cell death at molecular level, by analyzing important marker
such as PI3KIII, Beclin1, UVRAG and AMBRA that have a prevalent role
in the first phases of the autophagic process. TCAM 2 were treated for 24
hs with increasing concentration of E2 (1, 10, 100 nM) and with 1 M ICI
alone or in combination with 10nM E2. All the proteins involved in the
autophagic pathway increase upon E2. As control we treated cells
trasfected with DN/ERβ evidencing that the effect did not occur (Fig. 14).
41
FIG. 14: E2 induces some hallmarkers proteins of autophagy
Western blot analysis of PI3KIII, Beclin1, UVRAG and AMBRA from TCam2 cells
treated for 24 h with vehicle s (-), increasing E2 (1,10,100 nM) concentrations, 1µM ICI
alone or in combination with 10 nM E2 and cells trasfected with DN/ERβ. b-actin was
used as loading control. The lower panel shows the quantitative representation of data
(mean ± SEM) of six independent experiments. Columns are mean ± SEM of six
independent experiments. *P<0.05 E2-treated vs untreated cells, **P=0.01 E2-treated vs
untreated cells. ***P<0.01 E2-treated vs untreated cells,
42
An increased effect by DPN with respect to E2 was also tested on
authophagy (Fig. 15).
FIG. 15: DPN potentiates the effect of E2 on autophagy in human seminoma cells
By Western Blot on protein extracts from TCam2 cells as previously described and treated as indicated, selective ERβ agonist DPN potentiate the effect of E2. To verify equal loading, the membranes were stripped and probed with an antibody against β-actin. The side panels show the quantitative representation of data (mean ± SEM) of six independent experiments. Columns are mean ± SEM of six independent experiments. *P<0.05 E2-treated vs untreated cells, **P=0.01 E2-treated vs untreated cells. ***P<0.01 E2-treated vs untreated cells,