UNIVERSITÀ POLITECNICA DELLE MARCHE
ENGINEERING FACULTY
PhD Course in Information Engineering
Curriculum “Biomedical, Electronics and Telecommunication Engineering” SSD: ING-INF/06
Biostatistics of Cardiac Signals:
Theory & Applications
Supervisor
:
Doctoral Dissertation of:
Prof. Laura Burattini
Agnese Sbrollini
Co-Supervisor
:
Prof. Cees A. Swenne
“Pure mathematics is, in its way, the poetry of logical ideas.” Albert Einstein
Abstract
Aims of bioengineering is to investigate phenomena of life sciences and to formalize their physiological mechanisms. Considering that statistic is an excellent tool for modeling, analyzing, characterizing and interpreting phenomena, aim of this doctoral thesis is to merge the major biostatistical techniques and the bioengineering processing of cardiac signals.
The major cardiac signals are the electrocardiogram, the vectorcardiogram, the phonocardiogram and the tachogram. These signals are directly generated by heart and they can be directly acquired placing electrodes on the body surface. The statistical characterization of these signals passes by through some steps, that are statistical signal modelling, signal preprocessing, feature extraction and classification analysis. Biomedical signal modeling is the statistical theme that aims to propose mathematical models to represent biomedical signals and their characteristics. For examples, electrocardiogram can be modeled as a deterministic waveform, while the tachogram can be modeled as a point process. The signal preprocessing is a step of signals processing that aims to remove noises from signals, enhancing them. Some statistical methods can be used as cardiac preprocessing techniques, and they are the averaging and the principal component analysis. Feature extraction is a phase in which the selection and extraction of features are applied. A variable is defined as feature if it is of interest. The selection, the extraction and the evaluation of cardiac features is one of the essential phases in cardiologic diagnosis process. Classification analysis is a procedure in which features of signals are divided in different categories, according with their differences. Classification is the basis of clinical interpretation and clinical decision.
The real importance of statistics in cardiac bioengineering can be deeply understand only through its application; thus, four real applications were presented. The first application is the Adaptive Thresholding Identification Algorithm (AThrIA), born to identify and to segment electrocardiographic P waves. AThrIA is the perfect example of how much preprocessing is important in cardiac clinical practice. Being standard preprocessing insufficient, a specific statistical preprocessing based on the combination of standard preprocessing and principal component analysis was design to remove noise and enhance this low-amplitude wave. Specifically, it is the combination of standard preprocessing and principal components analysis. The second application is CTG Analyzer, a graphical user
interface, born developed to support clinicians during the critical phases of delivery and labor. After a specific evaluation of cardiotocographic signals, CTG Analyzer extracts all CTG clinical features according with international guidelines. About CTG Analyzer feature extraction, biostatistics is a fundamental instrument to evaluate the correctness of the features and to compare the automated extracted features with the standard ones provided by a clinician. The third application is eCTG, born to solve a practical clinical issue: the digitalization of cardiotocographic signals. The basis of eCTG signal extraction is the Otsu’s methods, a pixel clustering procedure that is the basis of the extraction procedure. Combining the analysis of distributions and classification, eCTG is an important example of statistics in image and signal processing. Finally, the fourth application is the creation of deep-learning serial ECG classifiers, specific multilayer perceptron to detect cardiac emerging pathology. Based on serial electrocardiography, these new and innovative classifiers represent samples of the real importance of classification in cardiac clinical practice.
In conclusion, this doctoral thesis underlines the importance of statistic in bioengineering, specifically in cardiac signals processing. Considering the results of the presented applications and their clinical meaning, the combination of cardiac bioengineering and statistics is a valid point of view to support the scientific research. Linked by the same aim, they are able to quantitative/qualitative characterize the phenomena of life sciences, becoming a single science, biostatistics.
Contents
Introduction ... I
PART I BIOSTATISTICS OF CARDIAC SIGNALS: THEORY ... 1
Chapter 1 Origin and Processing of Cardiac Signals ... 2
1.1 Heart Anatomy and Physiology ... 2
1.2 Major Cardiac Signals... 14
1.3 Interference Affecting Cardiac Signals ... 31
1.4 Processing of Cardiac Signals ... 35
Chapter 2 Statistical Signal Modelling and Sample Cardiac Applications ... 37
2.1 Statistical Modelling of Biological Signals ... 37
2.2 Statistical Modelling of Cardiac Signals ... 43
Chapter 3 Signal Preprocessing and Sample Cardiac Applications ... 46
3.1 Standard Preprocessing of Signals ... 46
3.2 Statistical Preprocessing of Signals ... 50
Chapter 4 Feature Extraction and Sample Cardiac Applications ... 56
4.1 Feature Extraction ... 56
4.2 Statistical Feature Comparison ... 64
4.3 Statistical Feature Association ... 68
Chapter 5Classification Analysis and Sample Cardiac Applications ... 72
5.1 Statistics for Classification ... 72
5.2 Classifier Construction ... 78
5.3 Examples of Classifiers ... 79
PART II BIOSTATISTICS OF CARDIAC SIGNALS: APPLICATIONS ... 89
Chapter 6 AThrIA: Adaptive Thresholding Identification Algorithm ... 91
6.1 Background... 91
6.2 Methods ... 95
6.3 Materials ... 100
6.5 Results ... 102
6.6 Discussion & Conclusion ... 105
Chapter 7 CTG Analyzer Graphical User Interface ... 108
7.1 Clinical Background ... 108
7.2 CTG Analyzer Graphical User Interface ... 116
7.3 CTG Analyzer 2.0 Graphical User Interface ... 119
7.4 Features Dependency from Sampling Frequency ... 121
7.5 Discussion & Conclusion ... 124
Chapter 8 eCTG Software ... 126
8.1 Technical Background ... 126
8.2 Methods ... 127
8.3 Materials ... 130
8.4 Statistics ... 131
8.5 Results ... 131
8.6 Discussion & Conclusion ... 132
Chapter 9 DLSEC: Deep-Learning Serial ECG Classifiers ... 136
9.1 Clinical Background ... 136
9.2 Methods ... 140
9.3 Materials ... 145
9.4 Statistics ... 146
9.5 Results ... 146
9.6 Discussion & Conclusion ... 149
Discussion & Conclusions ... III References ... 141
Abbreviations
• AC: cardiotocographic Acceleration;
• ACC: Accuracy;
• AF: Atrial Fibrillation;
• ANCOVA: Analysis of Covariances;
• ANOVA: Analysis of Variances;
• ANS: Autonomic Nervous System;
• AT: Atrial Tachycardia;
• AThrIA: Adaptive Thresholding Identification Algorithm;
• AUC: Area Under the Curve;
• AV node: Atrioventricular node;
• AVB: Atrioventricular Block;
• BC: cardiotocographic Bradycardia; • BL: cardiotocographic baseline; • BL-ECG: Baseline Electrocardiogram; • BLV: cardiotocographic baseline variability; • CTG: Cardiotocography; • DC: cardiotocographic Deceleration; • ECG: Electrocardiogram;
• EDC: Early cardiotocographic Deceleration;
• EN: Effective Negatives;
• EP: Effective Positives;
• ERP: Effective Refractory Period;
• F1: F1 Score;
• FDR: False Discovery Rate;
• FHR: Fetal Heart Rate series;
• FN: False Negatives;
• FNR: False Negative Rate;
• FOR: False Omission Rate;
• FP: False Positives;
• FPR: False Positive Rate;
• FU-ECG: Follow-up
Electrocardiogram;
• HF: High Frequency;
• HR: Heart Rate;
• HRV: Heart Rate Variability;
• IQR: Interquartile Range;
• JT: Junctional Tachycardia;
• LDC: Late cardiotocographic Deceleration;
• LF: Low Frequency;
• LR: Logistic Regression;
• LR-: Negative Likelihood Ratio;
• LR+: Positive Likelihood Ratio;
• MANOVA: Multivariate analysis of variance;
• MdN: Median;
• MLP: Multilayer Perceptron;
• NN: Neural Networks;
• NPV: Negative Predicted Value;
• ODR: Diagnostic Odds Ratio;
• PCA: Principal Component Analysis;
• PDC: Prolonged cardiotocographic Deceleration;
• PN: Predicted Negatives;
• PP: Predicted Positives;
• PPV: Positive Predictive Value;
• Pr: Prevalence;
• PVC: Premature Ventricular Contraction;
• QTc: corrected QT interval;
• RMSSD: Root Mean Square of the Square of Differences;
• ROC: Receiver Operating Characteristic;
• RRP: Relative Refractory Period;
• RS&LP: Repeated Structuring & Learning Procedure;
• S1: First Heart Sound;
• S2: Second Heart Sound;
• S3: Third Heart Sound;
• S4: Fourth Heart Sound;
• SA node: Sinus Atrial node;
• SDNN: Standard Deviation of NN intervals; • SE: Sensitivity; • SNR: Signal-to-Noise Ratio; • SP: Specificity (SP); • SVT: Supraventricular Tachycardia; • TC: cardiotocographic Tachycardia; • TN: True Negatives; • TP: True Positives;
• UC: Uterine Contractions signal;
• UCT: Uterine Contractions;
• VCG: Vectorcardiogram;
• VDC: Variable cardiotocographic Deceleration;
• VLF: Very Low Frequency;
Introduction
Bioengineering is a discipline that applies engineering methods and technologies to investigate issues related to life sciences. Aim of bioengineering is the study of the processes that underline physiological systems. Compared to standard biological and medical sciences, the main difference refers to tools and instruments that bioengineering uses. Indeed, its application is linked to engineering techniques, such as mathematics, physics, mechanics, fluid dynamics, computer science and, last but not least, statistics.
Mathematically, statistics has the purpose to quantitative and qualitative study a particular phenomenon under conditions of uncertainty or non-determinism. It is an instrument of the scientific method: it uses mathematics and experimental methodology to study how a collective phenomenon can be synthesized and understood. Statistical investigation starts from data collection, that will be statistically processed. Features will be extracted and classified in order to investigate the proprieties of the considered dataset. All this process is finalized to characterize unknown phenomena.
Considering the aims of bioengineering (to characterize the phenomena of life sciences) and of statistics (to find a quantitative/qualitative method to characterize a phenomenon), these two sciences are strongly linked. In fact, statistics is an excellent tool for modeling, analyzing, characterizing and interpreting biological phenomena. Converted in a new term, biostatistics, this science aims to quantitative and qualitative study of biological and medical phenomena under conditions of uncertainty or non-determinism.
In this general consideration, biostatistics techniques can be used in every field of medicine and biology. In particular, it is protagonist in medical and biological scientific research, supporting epidemiological studies with its methods. In fact, its methods and techniques are widely used to formalize a process (signal modeling), to test indices or procedures (comparison) or to classify and/or discriminate individuals or observations (classification).
One of the main filed in which bioengineering and biostatistics can be applied is the cardiac signal investigation. This application studies all the signals generated by the heart, specifically the electrocardiogram, the vectorcardiogram, the phonocardiogram and the heart-rate series. These signals can be analyzed in order to investigate the major cardiological disease: electrocardiogram/vectorcardiogram provides information about
cardiac electrical diseases (e.g. arrhythmias ), phonocardiogram provides information about mechanical heart diseases (e.g. atrial valve stenosis) and the heart-rate series provides information about the control of the autonomous nervous system on the heart.
Despite being one of the oldest themes of bioengineering, the study of cardiac signals is still promising. Indeed, cardiological challenges are still unsolved. Examples of cardiac signals research are the analysis of the cardiac electrical atrial activity, the analysis of the fetal heart rate signal and the use of the serial electrocardiography for the diagnosis of emerging pathologies. Application of biostatistical techniques could be a good solution to investigate these unsolved issues.
Aim of this doctoral thesis is to merge the major biostatistical techniques and the analysis of cardiac signals. Specifically, it is divided into two major part. The first is the theory dissertation about the origins of cardiac signals and about the main biostatistical techniques that can be applied in the study of cardiac signals. With a specific attention to the signals processing steps, the theory part is divided into modelling, preprocessing, feature extraction and classification. The second part presents four practical application of biostatistical techniques in the cardiac signals research field, which are: the adaptive threshold identification algorithm (AThrIA), CTG Analyzer graphical user interface, eCTG software, and the innovative construction of deep-learning serial electrocardiography classifiers.
PART I
BIOSTATISTICS OF
CARDIAC SIGNALS:
THEORY
In order to understand the combination of biostatistics and cardiac signal processing, an overview of all cardiac signals and statistical techniques is essential.
In the first part of this doctoral thesis, the basis of cardiac signals and statistical techniques are introduced. Specifically, the cardiac signals considered here are electrocardiogram, vectorcardiogram, phonocardiogram and tachogram. The real comprehension of these signals can be understood only through the study of their genesis, acquisition and interference. Moreover, the flow of the cardiac signal processing is presented.
After contextualizing the field of applications, an overview of all statistical techniques for cardiac signal analysis is proposed. The main techniques are grouped in four main themes, that are statistical signal modelling, signal preprocessing, feature extraction and classification analysis. For clarity and to show the utility of biostatistics, sample applications in cardiac bioengineering are presented for each of these themes.
Chapter 1. Origin and Processing of Cardiac Signals
Chapter 1
Origin and Processing of Cardiac Signals
1.1 Heart Anatomy and Physiology
1.1.1 Anatomy
The heart is the main organ of the circulatory system. It is located in the middle of the thorax, specifically in the anterior mediastinum between the two lungs, behind the sternum and the ribs, in front of the vertebral column, and over the diaphragm. It has a conical shape: its elongated base is turned back and to the right, while its apex is facing forward and to the left. In adults, it weighs about 250-300 g; it has a length of 13-15 cm, a width of 9-10 cm and a thickness of 6 cm. Its weight and dimension can vary with age, sex and physical constitution.
The organ (Fig.1.1) is divided into two sections, the right heart (Fig. 1.1-blue section) and the left heart (Fig.1.1-red section). Each of these sections is composed of a superior cavity,
Figure 1.1. Anatomy of the heart. The blue section represents the right heart, while the red section represents the left heart. The arrows show the flux direction inside the four chambers, crossing the four valves (1. Tricuspid valve, 2. Pulmonary valve, 3. Mitral valve and 4. Aortic valve).
Chapter 1. Origin and Processing of Cardiac Signals
the atrium, and an inferior cavity, the ventricle. The right heart is perfectly separated from the left heart: an interatrial septum separates the atria, while an interventricular septum separates the ventricles. Each atrium is connected to its ventricle through an atrioventricular orifice, protected by a valve. Specifically, the tricuspid valve (Fig.1.1 (1)) and the mitral valve (Fig.1.1 (3)) are located in the right and left atrioventricular orifices, respectively. Both ventricles present semilunar valves that connected ventricles with arteries. In particular, the pulmonary valve (Fig.1.1 (2)) connects the right ventricle with the pulmonary arteries, while the aortic valve (Fig.1.1 (4)) connects the left ventricle with the aorta. The blood flow proceed in a specific direction in both right and left hearts (Fig.1.1): atria receives blood from veins (the venae cavae for the right atrium and the pulmonary veins for the left atrium); blood passes atrioventricular valves (the tricuspid valve for the right heart and the mitral valve for the left heart); and ventricles pump blood in arteries (pulmonary arteries for the right ventricle and aorta for the left heart) , through semilunar valves (pulmonary valve for the right heart and aortic valve for the left heart)1.
The right atrium is located in an anterior, inferior and right position relative to the left atrium, and in the upper part of the right heart. It collects blood from the venae cavae. The superior vena cava opens in the posterior/superior wall of the atrium without valve, while the inferior vena cava opens in the posterior/inferior wall of the atrium through the Eustachian valve. Additionally, the right atrium collects blood from the coronary sinus. The right atrium hosts the sinus atrial node (SA node), the cardiac pacemaker, that spontaneously activates cardiac depolarization. The left atrium, thinner than the right atrium, is located in the upper part of the left heart. It collects blood from the four pulmonary veins, in the posterior wall of the atrium.
The right ventricle, thinner than the left ventricle, is located in the lower part of the right heart. It receives blood from the right atrium through the tricuspid valve and pumps it in the pulmonary arteries through the pulmonary valve. The right ventricle is the center of the pulmonary circuit, the small circulation that guides blood in the lungs. Due to the small entity of this circuit, pressure in the right ventricle is smaller than pressure in the left one (mean pressure of 2 mmHg and a maximal pressure of 25 mmHg). The left ventricle is located in the lower part of the left heart. It receives blood from the left atrium through the mitral valve and pumps it in the aorta through the pulmonary valve. It is longer and more conical than the right ventricle and, in cross section, its concavity has an oval or almost circular shape. Its walls are much thicker than right one (three to six times more), this
Chapter 1. Origin and Processing of Cardiac Signals
happens because it expresses a force five times higher, receiving blood at low pressure from the atrium, about 5 mmHg, and moving it in the aorta at a pressure about 120 mmHg at each heartbeat.
The blood flux in the heart is regulated by the action of the cardiac valves. The right atrioventricular valve, the tricuspid valve, consists of three cusps, while the left valve, the mitral valve, is composed of two cusps. Valves morphology avoids blood reflux from ventricles to atria. Then, the heart contraction forces blood against the edges of the atrioventricular valves, causing their closure and blood flux into arteries. Semilunar valves consist of three cusps that protrude from the ventricle to the inner wall of the arteries. When these valves are closed, blood fills the spaces between valve leaflets and the vessel wall. On the contrary, when ventricles contract, the flow of blood proceeds into the arteries, releasing blood in the cusps and causing the opening of the valves.
Heart valves are supported by the cardiac skeleton, consisting of strong connective formations formed by collagen fibers. It is composed of four fibrous rings, which enclose the four heart orifices. These rings are partly in contact and connected by two trigons of fibrous connective tissue. In particular, the right fibrous trigone is a strong formation placed between the aortic orifice and the two atrioventricular orifices, while the left fibrous trigone, smaller than the right one, is located between the left atrioventricular orifice and the aortic orifice. The cardiac skeleton aims to merge the muscular bundles of the atria and ventricles, to provide a support for heart valves, and to electrically isolate atria from ventricles. It also participates in the formation of the interatrial septum and of the interventricular septum.
The heart is enclosed by a double-wall sac (Fig.1.2), the pericardium, consists of two distinct layers, the
fibrous pericardium and the serious pericardium. The fibrous pericardium is the external layer and it is a resistant sac that non-elastically covers the heart. Its two main functions are the heart defense and the heart
Figure 1.2. Cardiac Muscle Structure. The muscular structure of the heart is composed of three layers, endocardium, myocardium and endocardium. It is enclosed in a sac, the pericardium.
Chapter 1. Origin and Processing of Cardiac Signals
maintenance in situ. The serous pericardium is the internal layer and it perfectly adheres to the cardiac muscle. It consists of two layers of mesothelium, the visceral pericardium and a parietal pericardium which together delimit the pericardial cavity. The visceral layer of serous pericardium (or epicardium) adheres to the heart, while the parietal layer of serous pericardium is the external one. Between the two layers of the serous pericardium, of the pericardial liquid, or liquor (20 ml and 50 ml), allows the heart movements, reducing its frictional forces2. The cardiac muscular structure is composed of three layers, the
epicardium, the myocardium and the endocardium (Fig.1.2). The epicardium, formed as described by the visceral layer of the serous pericardium, is a membrane that externally covers the heart. The epicardium consists of a single layer of mesothelial cells and has a lamina propria composed of elastic fibers. Myocardium, or cardiac muscle composed of myocytes, is the muscular tissue of the heart. It is composed of 70% muscle fibers, while the remaining 30% consists mainly of connective tissue and vessels. The myocardium is a hybrid of skeletal muscle tissue, and partly of smooth muscle tissue. Finally, the endocardium is a thin translucent membrane that internally covers all the cardiac cavities, adapting to all their irregularities and covering also the valve leaflets.
Heart contraction is regulated by an electrical impulse, opportunely generated by a specific group of cardiac cells, the cardiac conduction system. Cardiac conduction system (Fig.1.3) is the intrinsic system that regulates the cardiac depolarization. The depolarization is automatically generated by periodic electrical impulses that are born in the nodal cells. These impulses rapidly propagate to adjacent contractile cells through the presence of communicating junctions. The main four formations that composes the cardiac conduction system are the SA node, the atrioventricular node (AV node), the His bundle and the Purkinje fibers.
The SA node (Fig.1.3) is the part that autonomically regulates the occurrence of the heartbeat, being the cardiac physiological pacemaker. It is located in the right atrium in the junction between the cavity and the superior vena cava. It presents a crescent-shape, 15 mm long and 5 mm large. It is composed of connective tissue that surrounds myocardial cells with poor myofibrils. Its role is to generate the electrical stimulus that has to be transmitted to atrial muscular tissue, provoking the atrial contraction. The SA node is innervated by many fibers of the autonomic nervous system (ANS-both by the sympathetic nervous system and the parasympathetic nervous system), in order to regulate the heart rhythm and the atrial contraction force. The mean heart rate (HR) generated by the SA node is about 1 Hz
Chapter 1. Origin and Processing of Cardiac Signals
(60 bpm) in adult, but the nervous system can modulate it. Specifically, sympathetic activity can increase the frequency (tachycardia), modulating the electrical discharge of the sinoatrial nerve cells; on the contrary parasympathetic activity can reduce it (bradycardia). Moreover, if the heart is isolated from the nerves, it is in turn equipped with its own contractile activity.
The AV node (Fig.1.3) is the relay of cardiac conduction system. It is placed between the opening of the anterior coronary sinus and the insertion of the tricuspid valve, and presents an oval shape, 6 mm long and 2 mm large. The relay function of the AV node is to slow down the frequency of the SA node, in order to delay the ventricles contraction in relation to the atrial one. At the level of the AV node the sympathetic system increases the transmission speed of the impulse, while the parasympathetic slows it down. In case of SA-node inactivity, AV node does not have the ability to substitute it. The His bundle (Fig.1.3) conducts cardiac electrical impulses from AV node to ventricles. It is about 10 mm long, crosses the cardiac skeleton and continues in the thickness of the interventricular septum, where it divides into a right branch and a left branch. It connects to Purkinje fibers, which penetrate the ventricular myocardium through papillary muscles and ventricular lateral wall. Purkinje fibers are cardiac cells with higher conductivity than common myocytes. They are the largest
Figure 1.3. Cardiac conduction system. The cardiac impulse is born in the sinus atrial node (SA node), propagates in atria and arrives in the atrioventricular node (AV node). From there, it propagates in ventricles through His bundle, its branches and Purkinje fibers.
Chapter 1. Origin and Processing of Cardiac Signals
cells found in the heart: they have a diameter of 70-80μm compared to 10-15μm of myocardial cells. The large diameter is associated with a high conduction rate of about 1-4 V/s compared to 0.4-1 V/s of the other cells of the cardiac conduction system1.
The role to supply blood to the heart is guaranteed by coronary arteries. The right coronary artery and the left coronary artery supply blood to the right heart and the left heart, respectively, and are born in the initial part of the aorta. The course on the right coronary artery follows the edge between the right atrium and the right ventricle. This artery sends two branches down, the right marginal branch (or right marginal), and the posterior descending artery (or posterior interventricular). The left coronary artery divides into a circumflex artery, which gives rise to several branches for the obtuse margin, and anterior descending artery, which marks the border between left ventricle and right ventricle. The anterior descendant also originates other small arterial branches that go directly to irrigate the interventricular septum, known as sepal branches.
1.1.2 Electrical Physiology
Cardiac Action Potential
Cardiac cells are able to be electrically activated, generating an action potential. The cardiac action potential is a rapid voltage change between the walls of the cardiac cell membrane, caused by crossing of ions. The main ions involved are sodium (Na+), chloride
(Cl−), calcium (Ca2+) and potassium (K+). At resting, Na+, Cl− and Ca2+ are highly present in
the outside the cell, while K+ is mainly present inside the cell. The balance between
concentrations of these ions makes negative the voltage of the cell membrane, that is around -90 mV (resting membrane potential). When the action potential occurs, the membrane became rapidly positive (depolarization) and, then, it slowly returns in its initial negative condition (repolarization)3. The cardiac action potential duration ranges from 0.20 s to 0.40
s. Specifically, in the heart there are two types of cardiac action potentials: the non-pacemaker action potential, addressed to the common cardiac cells, and non-pacemaker action potential, addressed to the cells of the cardiac conduction system.
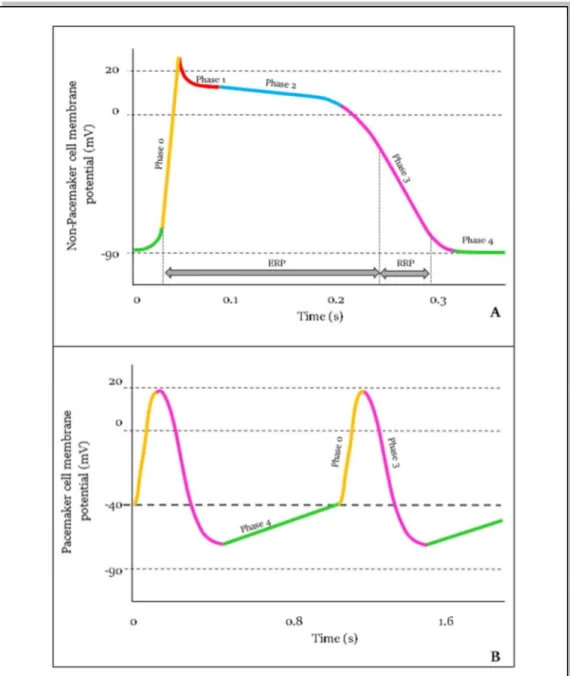
Non-pacemaker action potential is typically addressed to cardiac cells (atrial and ventricular) and to Purkinje fibers. This action potential is defined as “non-pacemaker” because its generation depends from the triggering of the adjacent cell depolarization. This type of action potential is called “fast response” due to its reactivity to be released. Non-pacemaker action potential is composed of 5 phases (Fig.1.4A)4:
Chapter 1. Origin and Processing of Cardiac Signals
0. The phase 0 or Rapid Depolarization occurs when the action potential of an adjacent cell is conducted till the cell. Th cardiac membrane voltage passes from the resting potential (-90 mV) to a threshold value (around -70 mV). This provokes an increasing of Na+ conductance, and then Na+ influx in the cell. At the end of this
phase, the cardiac membrane potential reaches +15 mV.
1. The phase 1 or Early Repolarization occurs when K+ channels open, generating an
efflux of K+ ions crossing the membrane.
Figure 1.4. Action potential of cardiac cells. Non-pacemaker action potential (A) is typical of common cardiac cells and Punkinje fibers. It is characterized by 5 phases (from 0 to 1), depicted in different colors. Pacemaker action potential (B) is typical of conduction system cells. It is characterized by 3 phases (0-3-4).
Chapter 1. Origin and Processing of Cardiac Signals
2. The phase 2 or Plateau occurs when Ca2+ channels open, generating an influx of Ca2+
ions. This process delays the repolarization phase and the cardiac membrane voltage arrives till a value of +20 mV. Channels of Ca2+ are called “long-lasting” because
they slowly inactivate.
3. The phase 3 or Rapid Repolarization occurs when the efflux of K+ exceeds influx of
Ca2+. The cardiac membrane voltage decreases till the resting value and K+ channels
close.
4. The phase 4 or Resting occurs when the cardiac membrane voltage remains at the equilibrium.
The phases from 0 to the first part of phase 3 constitute the Effective Refractory period (ERP) (Fig.1.4A), that is the period in which the cell is effectively refractory to the starting of new action potentials. The phases from the second part of phase 3 and the first part of phase 4 constitute the Relative Refractory Period (RRP), that is the period in which the cell can generate an action potential, only if the activation threshold reaches high values.
Pacemaker action potential is typically addressed to the cells of the SA node and of the AV node. This action potential is defined as “pacemaker” because it could be generated directly by the cell, that has the spontaneous ability to generate it with a specific frequency. It is called “slow response” action potential due to a slow rate of depolarization. Pacemaker action potential consists of 3 phases (Fig.1.4B)4:
0. The phase 0 or Upstroke occurs when Ca2+ conductance increases. It causes a slow
depolarization of cardiac membrane, due to the influx of Ca2+ in the cell. With the
increases of Ca2+, K+ conductance decreases, contributing in depolarization.
3. The phase 3 or Repolarization occurs depolarization causes the opening of K+
channels, thus the efflux of K+ starts to exit the cell. Simultaneously, Ca2+ channels
close and the cardiac membrane potential reaches -65 mV
4. The phase 4 or Spontaneous Depolarization occurs when K+ conductance decreases,
provoking a slow influx of Na+ ions in the cell. At the end of it, Ca2+ conductance
increases, allowing Ca2+ to move inside the cell.
As in non-pacemaker cells, the phases from 0 to the first part of phase 3 constitute the ERP, while the phases from the second part of phase 3 and the first part of phase 4 constitute the RRP.
Chapter 1. Origin and Processing of Cardiac Signals Cardiac Conduction Cycle
Cardiac electrical impulse is born in the pacemaker cells of SA node. These cells autonomically depolarizes, generating an impulse that arrive to all atrial cells. Moreover, through internodal fibers, impulse arrives till AV node, after a delay of 0.03 s from its generation (Fig.1.5). This essential delay guarantees that the electrical impulse slowly propagates from atria to ventricles. If the propagation would be rapid, atrial blood has no enough time to complete fill ventricles, compromising the pumping function of the heart. The AV node delays the impulse of 0.09 s (Fig.1.5), that propagates in the His bundle and arrives till the apex of the heart. Due to the atrioventricular septum, the impulse is delayed of other 0.04 s. Thus, the time between the generation of the impulse and its propagation till the ventricles is 0.16 s(Fig.1.5).
The depolarization is transmitted from the AV node to ventricles by Purkinje fibers, that rapidly conduct the impulse in ventricles in order to guarantee the simultaneous depolarization of ventricles (0.03 s). At the end of the Purkinje fibers, the speed decreases, causing an additional delay in the depolarization of the ventricles of 0.03 s. Thus, the effective time between the AV node depolarization and ventricles depolarization in 0.06 s.
Figure 1.5. Cardiac impulse transmission. The cardiac impulse is born in the SA node and propagated in atria and ventricles. It arrives in each part of the heart with a specific delay (s), depicted in yellow
Chapter 1. Origin and Processing of Cardiac Signals
1.1.3 Mechanical Physiology
Myocyte and the excitation-contraction coupling
The core of cardiac contraction is the myocyte, the cardiac cell. Chains of myocytes composes the myofibril, a long filament that composes myofilaments. Groups of myofibrils compose the sarcomere. The sarcomere, the basic contractile unit of the myocyte, is delimited by two bands called Z-lines and is physiologically 2 μm long. The sarcomere contains two type of filaments, the thick filaments and the thin filaments. The thick filaments are called myosin, while the thin filaments are called actin. The structure of the filaments is rigid, specifically each myosin is surrounded by six actins. Actin is a globular protein arranged as a chain of repeating globular units, forming two helical strands3. Between the
actins, several proteins are linked, called tropomyosin. Each of tropomyosin molecule is composed of three subunits, called troponin-T, troponin-C and troponin-I . The troponin-T attaches to the tropomyosin, the troponin-C is the connection between the molecule and Ca2+
and, finally, the troponin-I inhibits myosin binding to actin.
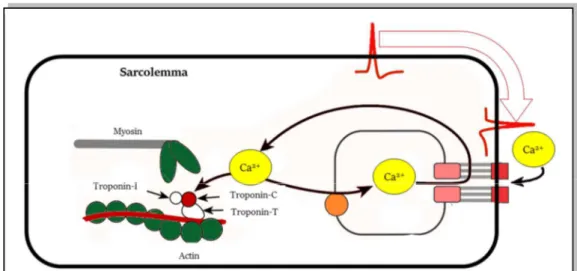
The cardiac cell contraction is regulated by the action potential. The coupling between the cardiac action potentials and contraction is called excitation–contraction coupling. This coupling occurs thanks to the transverse tubules, that are specific invaginations in the myocyte membrane, particularly in the ventricular cells. Thus, the transverse tubules connect the external environment of the cell, with its internal environment, permitting the flux of the ions during electrical depolarization and repolarization of the myocyte. In the
Figure 1.6. Excitation-contraction coupling. Cardiac impulse arrives (red) and causes a flux of Ca2+ inside the cell. Due to the “trigger-Ca2+”, actin and myosin slide past, causing the
Chapter 1. Origin and Processing of Cardiac Signals
internal environment of the cell, the transverse tubules are strictly connected with a tubular network called the sarcoplasmic reticulum, that surrounds the myofilaments (Fig.1.6). The main role of the sarcoplasmic reticulum is to regulate intracellular Ca2+ concentrations,
which is involved with contraction and relaxation. At the terminal part of the reticulum, there are several cisternae, near to the transverse tubules . This part of the cell is dense of electron and are believed to sense Ca2+ between the Transverse tubules and the terminal
cisternae. Moreover, a large number of mitochondria are associated to the reticulum in order to provide the energy necessary for the contraction. When the action potential arrives to the myocyte, the excitation–contraction coupling process starts. the depolarization of the cell causes the entering of Ca2+ ions in the cells, through Ca2+channels located on the external
membrane and Transverse tubules . This Ca2+ influx, relatively low in concentration, does
not increase the intracellular Ca2+ concentrations significantly, except in the regions inside
the sarcolemma. The Ca2+-release channels are sensitive to this low concentration; thus, this
quantity became a trigger for the subsequent release of large quantities of Ca2+ stored in the
terminal cisternae, provoking the increase of the Ca2+ quantity from 10−7 to 10−5 M.
Therefore, the Ca2+ that enters the cell during depolarization is sometimes referred to as
“trigger Ca2+”3. The Ca2+ ions bind to troponin-C and induce a conformational change in the
regulatory complex. Specifically, the tropomyosin complex moves and exposes a myosin-binding site on the actin. The actin and myosin filaments slide past each other, thereby shortening the sarcomere length. As intracellular Ca2+ concentration declines, Ca2+
dissociates from troponin-C, which causes the reverse conformational change in the troponin–tropomyosin complex; this again leads to troponin–tropomyosin inhibition of the actin-binding site.
Cardiac Cycle
The period between a heart contraction and the next contraction is the cardiac cycle (Fig.1.7). The heart periodically pumps blood towards the vessels, causing a rhythmic contraction and relaxation of the four cardiac chambers. The cardiac cycle is divided in two main phases: the systole and the diastole. The systole is the contraction period in which a chamber pushes blood into the adjacent chamber or into an artery. The diastole is the relaxation period in which a chamber fills with blood. Specifically, the phases of the cardiac cycle are4:
Chapter 1. Origin and Processing of Cardiac Signals
• Atrial systole: the atrioventricular valves (tricuspid and mitral valves) are open while the semilunar valves (aortic and pulmonary) are closed. Guided by the SA node, atria contract and push blood in the ventricles.
• Ending of atrial systole: atrioventricular valves close to prevent blood reflux and then the atria relax. The electrical impulse is delayed by AV node.
• First phase of ventricular systole: the ventricular pressure increases, due to the entering of blood. The ventricular pressure increases, but it is not sufficient to open semilunar valves. This phase is also called “isovolumetric contraction” because the ventricular volume remains constant since all the valves are closed.
• Second phase of ventricular systole: the ventricular contraction increases the ventricular pressure, guided by the AV node and the His bundle. Ventricular
Figure 1.7. Mechanical cardiac cycle. The two macro phases of the contraction are the systole (red-chambers contraction) and the diastole (blue-chambers relaxation). Each of these phases can occur in the atria (atrial systole and atrial diastole) or in the ventricles (ventricular systole and ventricular diastole)
Chapter 1. Origin and Processing of Cardiac Signals
pressure exceeds the pressure in arteries and opens semilunar valves. Thus, blood fluxes into artery is rapid in the first the ejection, while it became slower when the pressure in the arteries decreases, due to the blood flux. Meanwhile, atrial pressure starts to increase, due to blood that returns from veins.
• Early phase of ventricular diastole: ventricles relax and the ventricular pressure decreases, causing the closure of the semilunar valves. When valves close, ventricular volume remains constant. This is also called “isometric relaxation”.
• Late phase of ventricular diastole: blood enters in atria, causing an increase of the atrial pressure, while ventricular pressure reaches its minimum value. Thus, atrioventricular valves open and ventricles passive fills. At this point the heart is ready to start the cycle again.
In normal condition, each ventricle expels from 70 ml to 90 ml during a single systole, and about 5 l of blood per minute.
1.2 Major Cardiac Signals
1.2.1 Electrocardiogram
The electrocardiogram, abbreviated as ECG, is the representation of the cardiac electrical activity. The electrical impulse travels from atria to ventricles, depolarizing and repolarizing all cardiac cells. Action potentials generated by all cardiac cells can be recorded: their summation generates a pseudo-periodical pattern, the ECG. The electrical (Fig.1.8) impulse is born in the SA node, and propagates in the atria, causing atria depolarization and their consequently repolarization. These phenomena are reflected in P wave and in TA wave, respectively. Then, the impulse, after a small delay, passes from the AV node to ventricles, causing their depolarization and repolarization. The electrocardiographic representation of ventricular depolarization is the QRS complex, while the representation of the ventricular repolarization is the waveform composed by the T wave and the U wave. In detail, ECG waves are (Fig.1.9):
• P wave: it represents the atrial depolarization and it is an indirect measure of atrial activity. In normal condition, its duration ranges from 0.08 s to 0.10 s, and its amplitude ranges from 0.1 mV to 0.4 mV3. The P wave is a smooth wave, but,
Chapter 1. Origin and Processing of Cardiac Signals
occasionally, can present a small notch5. When a heart is affected by atrial diseases,
the P wave is altered. Specifically, abnormality in atrial structure can be diagnosticate from the increasing of the P-wave area6 (increasing of its amplitude
or duration). For example, the atrial hypertrophy can be observed in P-wave prolongation7. Moreover, P-wave absence is a fundamental diagnostic criterion,
associated to premature ventricular contraction (PVC), idioventricular rhythm, junctional rhythm, but principally to atrial fibrillation (AF)8.
• TA wave: it represents the atrial repolarization. It is a shallow wave, that rarely can be seen due to the overlapping with the ventricular depolarization wave. Occasionally, it could be seen in patients with heart block, and it is opposite from the P wave5.
• QRS complex: it represents the ventricular depolarization and it is the highest wave of the ECG pattern. The main features of QRS complex are its morphology, its amplitude and its duration. The morphology and the amplitude (usually ranged from 1 mV to 4 mV) are lead-dependent, while the duration of the complex ranged from 0.06 s to 0.10 s3. Usually, the normal pattern is composed by a small Q wave,
a large R wave and a small S wave in left-sided leads5. Enlargement of the QRS
complex can be symptom of ventricular hypertrophy9 and prolongation of this wave
can reflect heart failure10.
• T wave: it represents the phase 3 of repolarization of ventricular myocytes5 and its
duration ranges from 0.10 s to 0.25 s. Moreover, the T-wave duration is modulated
Figure 1.8. Genesis of electrocardiogram. The cardiac impulse generated the depolarization of all cardiac cells, from SA node to ventricular muscle. The combination of the action potentials of all the cells can be recorded, and it is called electrocardiogram (ECG).
Chapter 1. Origin and Processing of Cardiac Signals
by the duration of the entire cardiac cycle. The T-wave amplitude is not usually quantified, but the polarity of this wave reflects important information related to the clinical status of the patient. Examples are the myocardial ischemia and the infarction11.
• U wave: it represents the late repolarization process of His-Purkinje cells and certain left ventricular myocytes5. It is not always visible, but when present the normal U
wave has a low amplitude and the same polarity of the T wave.
The ECG waves are important in the monitoring of the cardiac electrical activity, but also the interval between their occurrence can reflect important information. The main ECG intervals in the clinical practice are:
• RR interval: it is defined as the interval between two consecutive cardiac cycles. It could be expressed as a time interval (ms). From the RR intervals, the HR series can be computed as their inverse. The HR is defined as the number of heartbeat present in a minute and its unit is the heartbeat per minute (bpm). In normal condition the RR interval ranges from 0.60 s to 1.00 s, corresponding to a HR between 60 bpm and 100 bpm. The RR interval is essential for the diagnosis of arrhythmias, as tachycardia or bradycardia. Tachycardia means a RR interval shorter than 0.60 s (HR higher than 100 bpm), while bradycardia means a RR interval longer than 1.00 s (HR shorter than 60 bpm). Tachycardia and bradycardia can be physiological events: for examples, the exercise induces tachycardia because the body needs more
Figure 1.9. Electrocardiographic waves. ECG is composed of several waves: P wave, QRS complex, T wave and, if present, U wave. Such important intervals (PR interval, ST interval, RR interval and QT interval) and segments (PR segment, QRS duration and ST segment) can be measures.
Chapter 1. Origin and Processing of Cardiac Signals
nutrients, while the sleep induces bradycardia. Anyway, such pathologies have arrhythmic events as diagnostic clinical evidences12.
• PR interval: it is defined as the interval between the P-wave onset to the initial deflection of ventricular activation. This interval includes several electrical events because it represents the time that the cardiac electrical impulse employs to reach the AV node. The normal PR interval is less than 0.16 s in young children or 0.18 s in adults. A short PR interval (under 0.08 s) can reflects Wolff-Parkinson-White syndrome5, while its prolongation reflects conduction system blocks3.
• ST segment: it is defined as the interval between the QRS-complex offset and the T-wave offset. The QRS-complex offset is usually called J point, and it should not deviate more than about 1 mm from baseline. Deviations in ST level may be caused by ischemia, inflammation, severe hypertrophy, and some medications13.
• QT interval: it is defined as the interval between the QRS-complex onset and the T-wave offset. This interval reflects the total action potential duration for ventricular myocytes, comprising their depolarization and repolarization. As the T-wave duration, the QT interval varies with the duration of the cardiac cycles, thus it is usually adjusted in relation to the cardiac cycle, computing the corrected interval (QTc) as:
=
√ (1.1)
In normal condition, the QTc is lower than 0.43 s in adults. Abnormality in QTc duration means severe pathologies: the QTc prolongation reflects the long QT syndrome, while its reduction reflects the short QT syndrome14.
The Standard 12 Leads
The ECG can be recorded with two different techniques, the surface ECG and the invasive ECG. The surface ECG, usually called only ECG, records electrical fields generated by the cardiac cycle. The signal is recorded by electrodes placed on the body surface. This technique is low-cost, noninvasive and painless for patients. These features made ECG recording the gold standard technique for the cardiological monitoring. On the other hand, the invasive ECG, or endocardiogram, is recorded directly inside the heart chambers.
The basis of the ECG recording is to use at least two electrodes to record the cardiac electrical activity. The placement of the ECG electrode was defined in the past, generating
Chapter 1. Origin and Processing of Cardiac Signals
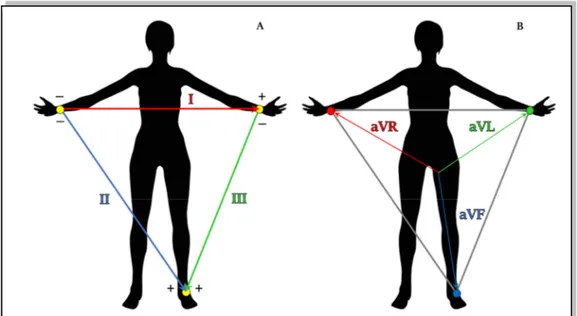
different leads standardization. The mainly used in the clinical practice is the 12-lead configuration. The 12-leads configuration is defined to have a complete visualization of electrical heart activity from 12 different points of view. This configuration includes the bipolar Einthoven leads, the augmented Goldberger leads and the unipolar precordial leads. The three Einthoven leads (Fig.1.10 (A)) are defined as bipolar because each of it needs two electrodes to be recorded, one positive and one negative15. Fig.1.10 (A) shows the
electrode placements and, according with it, the three leads are defined as:
• Lead I: it represents the voltage between left arm (positive) and right arm (negative);
• Lead II: it represents the voltage between left leg (positive) and right arm (negative);
• Lead III: it represents the voltage between left leg (positive) and left arm (negative).
The three augmented Goldberg leads (Fig.1.10 (B)) are unipolar leads. They measured the voltage between an exploring electrode and a reference one. Specifically, the reference electrode is constitute by the linear combination of two electrodes at limbs, while the exploring one is the third one15. According with Goldberg definition, the augmented leads
are:
• aVR: it considers as reference the combination of the electrode on left arm and the electrode on left leg, while the exploring electrode is that placed on right arm. Thus, the lead is defined as:
Figure 1.10. ECG lead measured at limbs. The Einthoven leads (A) and Goldberg leads (B) are six of the standard 12 leads and they are measured placing four electrodes at limbs.
Chapter 1. Origin and Processing of Cardiac Signals
= 12 (1.2)
• aVL: it considers as reference the combination of the electrode on right arm and the electrode on left leg, while the exploring electrode is that placed on left arm. Thus, the lead is defined as:
=12 (1.3)
• aVF: it considers as reference the combination of the electrode on left arm and the electrode on left one, while the exploring electrode is that placed on left leg. Thus, the lead is defined as:
=12 (1.4)
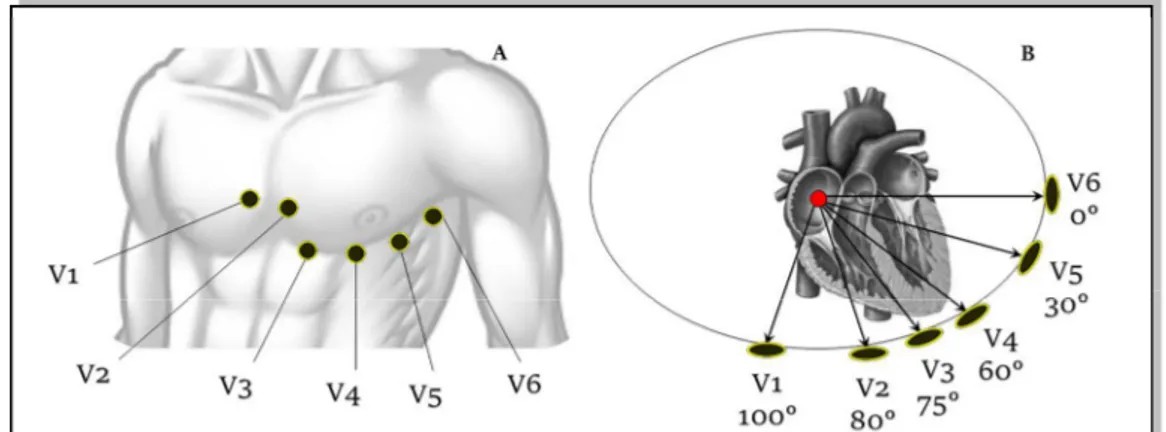
The six unipolar precordial leads are used to record the heart activity near heart location. Specifically, six electrodes are placed directly on the thorax in order to record cardiac activity in the transversal plane. As for Goldberger leads, the six precordial leads are computed as the voltage between a reference electrode and six exploring electrodes. As reference, the Wilson electrode is used: it is the combination of the three Einthoven electrodes15. The six
exploring electrodes (Fig.1.11) are identified with consecutive numbers (from V1 to V6) and are located on:
• V1: fourth intercostal space to the right of sternal margin;
• V2: fourth intercostal space to the left of sternal margin;
• V3: halfway between V2 and V4;
• V4: fifth intercostal space on the left hemiclaveral line, corresponding to cardiac apex;
Figure 1.11. Precordial leads. The six precordial leads are six of the standard 12 leads. The electrodes are placed on the chest (A) and they provides a representation of repolarization in the transverse plane (B).
Chapter 1. Origin and Processing of Cardiac Signals
• V5: fifth intercostal space on the left anterior axillary line, aligned with V4;
• V6: externally aligned with V4 and V5.
The 12-lead recording can be direct measured or indirect measured. The direct measure provides a more realistic signals because electrodes are directly placed on anatomical sites. Specifically, ten electrodes are placed on the body, and in particular six electrodes are placed on the thorax (1. fourth intercostal space to the right of the sternal margin; 2. fourth intercostal space to the left of the sternal margin; 3. halfway between V2 and V4; 4. fifth intercostal space on the left hemiclaveral line, corresponding to the cardiac apex; 5. fifth intercostal space on the left anterior axillary line, aligned with V4; 6. externally aligned with V4 and V5), while other four are placed on the limbs (7. Left arm; 8. Left leg; 9. Right arm; 10. Right leg).
This is the standard electrodes placement, but the electrodes on limbs are uncomfortably for portable devices, like long time monitoring (ECG Holter) or during the exercise. Thus, in 1966, Mason and Likar formulated an alternative location for electrodes on the limbs. Specifically, they suggested to move arm electrodes on clavicles and legs electrodes on iliac fossae16.
The indirect measure of the 12 leads is based on the recordings of the Frank leads. The Frank leads are a set of three bipolar leads, orthogonal each other and orthogonal to the reference system of human body. Specifically, the axis (X,Y,Z) are defined as the transversal axis (left-right), the axis sagittal (or dorsoventral) and the longitudinal axis (or craniocaudal). According with these axes, the Frank leads are recorded with seven electrodes, five on the thorax, one on the left leg and one as reference. Through such transformation matrices, three orthogonal leads can be mathematically transformed in the 12 standard leads. In particular, the most famous matrix for the 12 leads computation are the Dower matrix17,18 and the Kors matrix19,20.
1.2.2 Vectorcardiogram
Heart Vector
An alternative line of the electrocardiography is the concept of the heart as a cardiac dipole. Indeed, the heart generated an electrical field, that can be observed through its body surface isopotential map. The cardiac electrical activity could be accurately described as an equivalent dipole. The dipole is a system composed of two equal and opposite electric
Chapter 1. Origin and Processing of Cardiac Signals
charges, separated by a constant distance over time; it is usually represented in vector form in which the vector amplitude indicates the electrical intensity while the arrow indicates its orientation.
During cardiac depolarization, the extracellular fluid surrounding the heart and the myocardium became two equal and opposite electric charges. Specifically, the extracellular fluid becomes more negative, while the myocardium becomes more positive. This is caused by the positive ions flux inside the cellular membrane. This phenomenon generates a dipole between two charges, that changes its direction accordingly with the depolarization/repolarization wave. This wave is not instantaneous; thus, the dipole changes its direction in the space. Moreover, the heart tissue in not homogenous, thus the dipole intensity (vector length) is not constant. According with these features, the cardiac dipole is equivalent to a rotating vector with a positive and negative terminal spinning in three dimensions, according with the depolarization/repolarization wave that spreads through cardiac chambers. Moreover, the cardiac dipole spins around the heart, generating a current that moves towards or away from skin electrodes. The upward or downward deflection of cardiac vector depends on its direction, and in particular if it points the electrode or not. Standard 12-lead ECG shows the dipole movement from different points of view, in order to have a global overview of cardiac electrical activity. When the heart is completely depolarized or repolarized, there is no dipole and ECG is flat (isoelectric).
Figure 1.12. Cardiac vector. The depolarization wave follows a specific path that can be modeled as a vector, which can be projected on the standard 12 leads.
Chapter 1. Origin and Processing of Cardiac Signals
A dipole is a vector (Fig.1.12); thus, it has a direction and a magnitude: specifically, it could be represented as an arrow pointing from the most depolarized region of the heart to the most polarized region. Where each end of the arrow is located depends on how the wave of depolarization spreads through the heart, and how much mass of myocardium is depolarized/repolarized. The dipole points from the biggest mass of depolarized myocardium to the biggest mass of repolarized myocardium at any particular instant.
Vectorcardiogram
One of the electrocardiographic techniques to evaluate cardiac electrical activity is the dynamic measurement of heart vector, the vectorcardiogram (VCG). The VCG is composed by the three orthonormal leads X, Y and Z (Frank leads), with lead vectors in directions of the main axes of the body. Usually, they are normalized lead strengths, thus measuring the dynamic x, y and z components of the heart vector20. These three leads can be combined,
observing the heart vector movement in the three principal planes (longitudinal, sagittal or transversal) of in the space. Additionally, the vector magnitude (VM) is also computed as:
= . (1.5)
The recordings of three orthogonal leads can be direct (using the Frank configuration) or indirectly computed. In fact, as the three orthogonal leads can be computed from the standard 12-lead, the inverse process is also possible. Specifically, it was demonstrated that the Kors matrix20 allows to reliably approximate Frank leads from the eight independent
lead of the standard 12-lead configuration.
The main pattern that can be observed in VCG is composed of three wave loops, the P-wave loop, the QRS-complex loop and the T-P-wave loop (Fig.1.13). Each of these loops represents the movement of heart vector during a specific phase of the depolarization/repolarization wave. Specifically, this pattern is repeated for each ECG heartbeat, and the projection of each loop in one of the three principal planes can underline proprieties of the cardiac electrical activity.
VCG contains less information than the ECG, but its nature to observe the heart vector in space has additional value and gives access to information that remains unexplored in the standard 12-lead ECG20. Examples of VCG features that could be useful in clinical practice
Chapter 1. Origin and Processing of Cardiac Signals
• QRS-T spatial angle, defined as the angle between QRS-complex and T-wave axes, is a measure of concordance/discordance between ventricular depolarization and repolarization21;
• ventricular gradient, defined aa the QRS-T area in the three orthogonal leads, is a measure of the cardiac action potential morphology distribution20;
• ST vector, defined as J-point amplitudes (usually also J point+0.04 s, +0.06 s, or +0.08 s are used) in the three orthogonal leads, is a valid feature to detect ischemia20;
• QRS- and T-loop complexity, defined from the single value decomposition of the loop, is a measure of the irregularity of loops, characteristic of several pathology20.
Figure 1.13. Cardiac waves loops. The heart vector, during the cardiac cycle, composed three loops in the space: the P-wave loop (blue) represents atrial depolarization, the QRS-complex loop (green) represents ventricular depolarization and the T-wave loop (red) represent ventricular repolarization.
Chapter 1. Origin and Processing of Cardiac Signals
1.2.3 Phonocardiogram
The phonocardiogram, or PCG, is the recording of the cardiac heart sounds. The contraction and the relaxation of the four heart chambers periodically repeats in time: ventricular contraction pushes blood in arteries and provokes closures of atrioventricular valves; then, during the ventricular relaxation, atrioventricular valves open and semilunar valves close in order to allow the blood to fill atria. The valve closures generate sounds, that could be recorded. Cardiac heart sounds define the time of systole and diastole. Moreover, abnormality in the heart sounds reflects valves dysfunction.
As the ECG presents a periodical patter, also the PCG presents a heart sounds pattern (Fig.1.14). The first heart sound (S1) represents the closure of the atrioventricular valves and indicates the beginning of systole and the end of diastole. Its duration is about 0.15 s and its frequency components range from 25 Hz to 45 Hz. S1 is generated by four different vibrations. The first is the atrial component, that provides some low-frequency not-audible vibrations provoked by the ending of atrial contraction. The second component, the principal one, is the sounds of the closure of atrioventricular valves, mitral and tricuspid valves. The third component depends on the opening of semilunar valves that produces vibrations and the acceleration of the blood that it flows into arteries. The last component is normally not-audible and depends on the position of the valve at the time of diastole. In fact, if the valve is completely open, S1 is more intensive, while if the valve is still closed, S1 is weaker. The not-audible components became audible in pathological conditions. S1 intensity also depends
Figure 1.14. Heart sounds. The major heart sounds are S1, S2, S3 and S4. The interval between S2 and S1 reflects ventricular systole (red), while the interval between S1 and S2 reflects ventricular diastole (blue).
Chapter 1. Origin and Processing of Cardiac Signals
on the rapidity of ventricular contraction and on the anatomical shape of valves. The auscultation is better appreciated at the apex or in the left ventricular area.
The second heart sound (S2) represents the closure of semilunar valves and indicates the beginning of diastole and the end of systole. Its duration is about 0.12 s and its frequency components are around 50 Hz. S2 is more direct and acute than the first and is accompanied by vibrations that are normally not audible. These vibrations are due to the reaction of the ventricular wall at the beginning of diastole (not audible normally) to the closure of semilunar valves, aortic and pulmonary valves, which represent the audible and predominant part of S2. The vibrations of the vascular walls and the vibrations produced by the opening of atrioventricular valves are added. Not-audible components become audible in pathological conditions. Auscultation is better appreciated in aortic or pulmonary auscultation sites.
The third heart sound (S3) is a dull, weak and serious sounds, perceivable after a physical effort. Since S3 follows S2, it can be considered as a diastolic sound, or rather pre-diastolic. S3 is present in a third of children/young people and corresponds to the rapid ventricular filling. It is produced by the vibration of the mitral valve when blood rapidly passes in ventricles. It must be monitored since S3 (physiological) is very similar to the pre-diastolic gallop (pathological). The differences regard their population, in fact S3 is characteristic of very young/young individuals, while the pre-diastolic gallop in adults with left ventricle failure. In relation to the other sounds, S3 occurs after 0.10 s after S2. Auscultation is better appreciated in the apical area with the subject prone on its left side.
The fourth heart sound (S4) precedes about 0.10 s S1 and is generated by atrial systole (pre-systole), generally considered as an extra-localized sound near ventricles with a frequency of 20-30 Hz. Although not confirmed, the literature believes that S4 is generated due to the stiffening of ventricular walls, that causes a turbulent flow of blood as atria contract to force blood into ventricles. If S4 becomes strong, it is a pathological state signal, usually a collapse of the left ventricle. It is often referred to as atrial gallop.
With the four main cardiac sounds, additional tones and heart murmurs are added. The cardiac tones are the "pericardial knock", which occurs in proto-diastole in case of constrictive pericarditis; the ejection tones, which are intense and short, high-pitched sounds that can be perceived in early diastole caused by opening pops of aortic (or pulmonary) semilunar valves or sounds due to the distension of a dilated aorta; and finally the "non-ejection systolic clicks", deriving from the tensioning of mitral cord tendons with
Chapter 1. Origin and Processing of Cardiac Signals
a length functionally not equal to that of the others. Heart murmurs are noises caused by a rapid turbulent flow of blood, in case of low viscosity. The breaths are characterized by a source point, duration and intensity defined in degrees (grade 1: very weak, almost not perceptible, up to grade 6: very strong, perceptible even without a stethoscope). Another kind of breath is the systolic and diastolic murmurs. The first start with the first tone and last up to the second, the others start immediately after the beginning of the second tone. These breaths are associated with pathological conditions or insufficiencies due to cardiac stress.
PCG Auscultation
The auscultation of the cardiac tones through a stethoscope is performed by placing the instrument on the subject's thorax by following precise points called "auscultation areas" (Fig.1.15). They are the aortic area, the pulmonary area, the tricuspid area and the mitral area. The aortic area is on the second right intercostal space on the edge of breastbone; the pulmonary area is located between the second and third left intercostal space on the edge of breastbone; the tricuspid area is on the fourth left intercostal space at the edge of breastbone; and the mitral area is located at the apex of the heart. The sampling frequency for the PCG
Figure 1.15. Auscultation areas. PCG can be recorded in four major areas, in relation to the valve that has to be monitored. Aortic area (blue) allows to monitor the aortic valve functions; pulmonary area (yellow) allows to monitor the pulmonary valve functions; tricuspid area (green) allows to monitor the tricuspid valve function, and the mitral area (red) allow to monitor the mitral valve functions.
Chapter 1. Origin and Processing of Cardiac Signals
signal is usually very high, ranged from 4000 Hz to 16000 Hz. This choice is related to the high frequency components of heart sounds22.
ECG vs. PCG
The electrical activity generates the contraction that guides the heart valves closure, thus there is a specific correlation between the ECG-waves occurrence and the PCG-sounds occurrence. The correlation between the ECG pattern and PCG pattern are depicted in Fig. 1.16. The first sound is detected on average 0.05 s after the QRS-complex onset and lasts on
average 0.14 s. The second tone starts at the T-wave offset and has an average duration of 0.11 s. The third tone may appear from 0.05 s to 0.10 s after the second tone. The fourth tone can be detected, if present, 0.05 s after P-wave onset. With regard to the gallop rhythms, the presystolic gallop is at least 0.10 s before the first tone; the pre-diastolic gallop appears 0.15-0.20 s after the second tone.
1.2.4 Tachogram
Nervous Control on Heart Activity
The ANS (autonomic nervous system), also called visceral or vegetative, is part of the nervous system and is subdivided into a sympathetic and parasympathetic system. These systems work in synergy, e.g. they work both to achieve the homeostatic condition that guarantees the stability of the inner balance in spite of the external or internal adverse events that try to alter it.
The sympathetic system (Fig.1.17) has a stimulating, exciting and contracting function, thus preparing the body to face dangerous situations. In a short time, it increases the strength of cardiac contraction, HR and glicemia, causing the dilation of pupils and blood vessels, while it slows down the digestive processes. This system is characterized by the start
Figure 1.16. ECG vs. PCG. Simultaneous representations of ECG and PCG allows to understand the coupling between the electrical activity of the heart and its mechanical activity.