UNIVERSITY
OF TRENTO
DEPARTMENT OF INFORMATION AND COMMUNICATION TECHNOLOGY 38050 Povo – Trento (Italy), Via Sommarive 14
http://www.dit.unitn.it
QUALITATIVE MODELS OF THE HUMAN HEART: A SURVEY
Carlos Bilich
www.carlosbilich.com.ar
June 26
th, 2006
Qualitative Models of the Human Heart: A Survey
Carlos Bilich
University of Trento, Faculty of Science, Department of Information and Communication Technology, Via Sommarive, 10 - I - 38050 Trento, Italy
Abstract. Cardiovascular disorders are among the pathologies that affects the largest number of people all
over the world, far and away from other diseases like AIDS or diabetes. Over the years, the interest of the scientific community in the study of the human heart has been constantly high, and it will probably never go-ing to decrease. This is undoubtedly due to the central importance that this organ has for human life and for the impact that any successful research aimed towards it could have on the health of the population of the en-tire world. One important tool to help in the study of the behavior of the heart is modeling. Thru an accurate modeling of the human heart, computers can help physicians, students of medicine, and medical researchers to understand the behavior of certain pathologies without the need for in vivo experimentation. This article reviews the main characteristics and properties of three well known qualitative models of the human heart, comparing their different implementations as well as their advantages and disadvantages.
1 Introduction
Heart failure is an important cause of mortality, and even though in these modern times the tendency has been slowed, according to some studies, annual survival for heart failure patient is 57% for males and 64% for fe-males, but after 5 years these rates decrease to 25 and 38% respectively [1]. Heart failure is not only a medical problem, but also a social and economic one. Heart transplantation, coronary artery bypass grafting, correction of mitral valve incompetence, cardiac resynchronization therapy, biological and mechanical cardiac assist de-vices have solved some of the problems, but most of the difficulties remain unsolved. Besides that, all these treatments carry potential complications and high costs [2].
One way to reduce these costs is thru the usage of computational models of the human heart that can emulate some of its functions. The advances experienced by the medical sciences during the last century, coupled with the astonishing grow of computer processing power of the last 40 years, set the ground for the development of powerful and feature rich computational models that can successfully be used in decision support systems. It is common to group models according to different categories such as, quantitative vs. qualitative, and surface vs. deep. The models reviewed here all belong to the qualitative group in the sense that they do not deal with signals represented numerically (e.g. voltages in time). Instead, signals are represented by symbolic descriptions that specify their qualitative features. Comparing numerical with qualitative modeling, [3] list some of the advan-tages of the latter that can be summarized as follows: a) The qualitative view is closer to actual medical descrip-tions and reasoning about the physiological processes and failures in the heart; b) a knowledge of the exact nu-merical values of the different model parameters is not required to execute it; c) the qualitative simulation is computationally less complex than numerical simulation (an advantage that disappears in the case of combinato-rial explosion or when there are some coupling with quantitative models); and finally, the idea that qualitative simulation explains more naturally the mechanisms of failures of the system that is being modeled comparing with numerical modeling. On the other hand, knowledge is said to be surface or shallow if it directly states the relation between the specification of the problem and its solution without referring to the underlying principles. Typically, surface-level knowledge is used in solving problems efficiently, although without any reference to, or understanding of, the underlying causal relations on which the solution is based. With this regard, in the models reviewed here knowledge is represented deeply, thus deriving operational decisions by reasoning from the basic principles or basic rules that describes the underlying mechanisms of the system. The rest of the article is organ-ized as follows: Section 2 briefly describes the domain of application of the models; Sections 3, 4, and 5 de-scribe KARDIO, Spatio-Temporal, and Ticker models respectively. Finally, section 6 presents the conclusion of this survey.
2 Domain Description
A human heart can be thought as a system which is in turn divided into two subsystems: an electrical system and a mechanical system, where the former is the control part of the latter. The electrical subsystem is responsible for the generation of stimulation impulses that rhythmically cause the contraction of the heart muscle, and works completely autonomously within the heart. In response to these stimuli, the mechanical part, periodically con-tracts and relaxes, thus pumping blood throughout the lungs and the rest of the body. The models surveyed here all deals with the electrical subsystem, medically known as cardiac electrophysiology, therefore the mechanical functions will be not explained in detail.
The electrical control system of the heart is made of excitable tissue and can be anatomically described by the components shown in Fig. 1. It consists of only six major components [3]:
1. Sino-atrial (SA) node, located in the upper part of the right atrium, is the regular impulse generator of the heart.
2. Conduction pathways, located in the atria lead to the AV node.
3. Atrio-ventricular (AV) node, lying in the upper portion of the interventricular septum is the beginning of the specialized conducting system that leads to the ventricles. However, sometimes there are additional, congeni-tal pathways that lead directly from the atria to the ventricles, thus bypassing the AV node.
4. Bundle of His is a continuation of the AV node into the interventricular septum. The part between the AV node and the bundle of His is called the junction.
5. Left and right bundle branches are a continuation of the bundle of His, going down each side of the interven-tricular septum to the ends of the ventricles.
6. Purkinje fibers, a specialized conduction network spread in the ventricles that represent the last link in the chain of excitation.
Fig. 1. A scheme of the electrical control system of the heart. The nodes generate electrical impulses. The dotted lines
repre-sent conduction paths for impulses [3].
In a normal cardiac cycle, the SA node experiences a spontaneous electrical depolarization which is ducted across the atria via muscle fibers, and to the AV node via the conduction pathways. The stimulation con-tinues to the bundle of His after a short delay in the AV node. The impulse is then distributed between the right and left bundle branch to reach the Purkinje fibers, thus stimulating the rest of the ventricular muscle.
The electrical activity of the heart can be disturbed by different abnormalities, which among the most impor-tant are cardiac arrhythmias and ischemic disorders. An arrhythmia is an abnormality of the rate, regularity, or site of origin of the cardiac impulse or a disturbance in conduction of the impulse so that the normal sequence of activation of atria and ventricles is altered. There are about 30 basic disorders that are of general interest in medical practice. Also, there can be several disorders simultaneously present in the heart; combined disorders are called multiple arrhythmias. On the other hand, ischemia is the diminished blood supply to a mass of cardiac muscle due, for example, to myocardiac infraction and angina pectoris. It turns out that both groups of disorders can be, in most of the cases, clearly diagnosed by studying the cardiac electrical function. A well known tool that physicians use to diagnose this kind of disturbances is the electrocardiogram (ECG). The ECG records the potentials in time that the heart muscle cause as it beats. Each of the aforementioned disorders cause some char-acteristic changes in the ECG. The models described herein are then used in simulations to explain the
relation-3 KARDIO
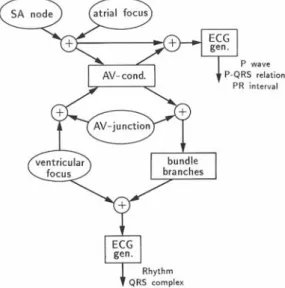
The KARDIO model [3] is interesting because the prevailing type of knowledge in the system is deep, capturing the underlying causal structure of the problem domain. This enables de system to reason from first principles. The idea was to design a model of the heart which can then be used to generate new diagnostic rules. The model consists of 35 rules that define causal relations between heart states, electrical events that occur, and ECG traces. All parameters and relations are expressed qualitatively. Specifically each rule expresses a cause which brings about a consequence if certain conditions are satisfied. The model can be thought of as an electric network, as shown in Fig. 2.
Fig. 2. Model of the heart as a network composed of impulse generators, conduction paths, impulse summators and ECG
generators. [3]
However, signals that propagate in this network are represented qualitatively by symbolic descriptions rather than by voltage vs. time relations. Components of the model are: a) nodes of the network; b) a dictionary of simple arrhythmias related to heart disorders; c) “legality” constraints over the states of the heart; d) “local” rules sets; e) “global” rules. Let’s analyze each component in more detail: a) The nodes of the network is a set of: impulse generators; conduction pathways; impulse summators and ECG generators. These elements are illus-trated in Fig. 3. The word “impulse” in this figure refers to a symbolic description, so these elements are in fact operators on descriptions. Impulse generators and conductions pathways can be in normal or abnormal func-tional states. For example, a generator can generate impulses or be silent; a conduction pathway can conduct normally or be blocked or partially blocked in various ways (e.g. it may just cause a delay of an impulse, or it can suppress every second or third impulse, etc.). These abnormal states of individual elements correspond to simple disorders of the heart. b) The dictionary of simple arrhythmias related to heart disorders is defined in terms of the functional states of the components of the heart. Roughly speaking, each simple arrhythmia corre-sponds to a disorder in one of the heart’s components.
include: logically impossible states; physiologically impossible states; and “medically uninteresting” states. A state is logically impossible if one of the heart’s components is in two different states at the same time. An ex-ample of a physiologically impossible state is a situation in which two generators in the atria discharge impulses permanently. An example of a medically uninteresting state is one in which there is no atrial activity and the AV-conduction is blocked. In such a case the block has no effect on the function of the heart and also cannot be detected in the ECG. d) The “local” rule sets specify the behavior of individual components of the heart (genera-tors, summators and conduction pathways) in the presence of various abnormal states. e) The “global” rules define causal relations between impulse generators and conduction pathways in the heart, electrical impulses and ECG features; these rules also reflect the structure of the network in Fig. 2. All the rules in the model essentially have the syntax of first order predicate calculus, more precisely, the syntax that is accepted by Prolog.
Rules are composed of subexpressions in specialized languages for describing the state of the heart, impulses that are conducted through the heart, and ECG patterns. For example, the term:
heart(atr_focus: permanent(regular,between_100_250))
is a partial specification of the state of the heart. It says that the atrial focus is discharging permanent impulses (as opposed to occasional) with a regular rhythm at the tachycardic rate (i.e. somewhere between 100 and 250). The following is an example of an ECG description:
[rhythm_QRS = irregular] & [dominat_P = abnormal] &
[rate_of_P = between_100_250] &
[relation_P_QRS = after_P_some_QRS_miss] & [dominant_PR = prolonged] &
[dominant_QRS = normal] &
[rate_of_QRS = between_60_100 ∨ between_100_250]
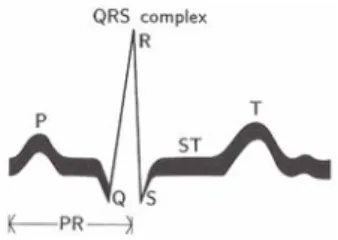
where P, PR and QRS is the standard nomenclature used to designate the electrical impulses registered by the ECG as can be seen in Fig. 4. Notice that the description above gives two values for the rate of QRS waves: they can be either normal (between_60_100) or tachycardic (between_100_250)
Fig. 4. ECG curve corresponding to one beat of the normal heart. P: wave of depolarization of the atrial myocardium. QRS
complex: depolarization of the ventricular myocardium. T: wave of repolarization of the ventricular myocardium. Changes in shape or absence of the P wave and PR interval suggest that the excitation originates in abnormal location (ectopic) either in the atria or in the AV node. A wide and bizarre QRS complex is always a result of a ventricular impulse or an aberrant con-duction down the left or right bundle branch. [3]
Impulses are described as the following example:
permanent(atr_focus:form(unifocal,regular,between_100_250))
this says that there are unifocal permanent impulses with the tachycardic rate and regular rhythm at the atrial focus. Finally, global rules are specified in the following way:
IF
in the atria there are permanent impulses of some rhythm Rhythm0 and rate
Rate0, and the state of the AV conductance is State.
THEN
there are impulses of type State, rhythm Rhythm1 and rate Rate1 at the exit from the AV conductance
WHERE
State, Rhythm0, Rhythm1, Rate0 and Rate1 have to satisfy the relation
av_conduct.
4 Spatio-Temporal Model
Although the set of rules of KARDIO generate a fairly complete set of observable arrhythmias, the model does not capture relations that link the temporal behavior of individual tissue groups. Therefore, in [4] Weinberg et al. present a modeling framework that combines device- and process-oriented ontologies with a mechanism to in-troduce delays into the definition of the processes to explicitly modeling sequences of temporal activities. With this approach, a sequence of changes can be observed on a dynamic time scale, which allows better explanation of the dynamic relationships between objects, making it easier to represent deviant behavior and disease states, and also generate causal explanations about the intervening processes.
This modeling scheme describes the domain under study by a set of primitive objects or components, generic interconnection relations than can exist between objects, and a set of fundamental processes based on basic laws applicable to the domain. An object is a component (or a set of components) with certain properties and an asso-ciated set of parameters that describe its state. It also has an assoasso-ciated functionality defined in terms of a set of fundamental processes. Processes represent the active forces of the simulation, and are characterized by precon-ditions or prerequisites for their activation and influences that describe the results of their application. Intercon-nections constrain system behavior by helping to solve the intersection/interaction problem [4].
The global model is divided in two parts: a) a temporal model, valuable for simulating arrhythmia conditions, and b) a spatial model, used to simulate the effects of ischemia and infarctions. The spatial model is based on a method called Qualitative Vector Algebra (QVA), developed in previous works of the authors, which is out of the scope of this survey. Therefore, only the temporal model will be described hereinafter.
4.1 Temporal model
The model is derived from eight primitive objects that fall into three functional categories: pacemakers, conduc-tion pathways, and heart muscle. Components are organized into classes to better characterize the domain and to create groupings based on concepts that aid in the generation of better explanations. Therefore, the components shown in Fig. 1 are arranged in the following manner: Pacemakers: sino-atrial node (SA-Node) and atrial-ventricular node; conduction pathways: right and left bundle branch, bundle of His and Purkinje fibers;
cham-bers: Atria and ventricles. Parameter values define the states of the components. As an example, an instantiation
of the primitive component SA-Node is shown below:
Object:
type: Primitive name: SA-Node
class: Pacemaker
parameters:
thresholdPotential, restpotential, act ionpotential, impulsePoint, phase4DepolarizationRate,
phaseODepolarizationRate,
phase3RepolarizationRate, conductionDelay impulseFlag, processCount, phase
interconnections:
(ElectricalConductor, atrium)
(ElectricalConductor, InternodalTrac,ts)
functionality: Pacemaker class processes
The system schematic is defined by interconnections linking pairs of objects. Interconnections represent logi-cal connections and are similarly represented as objects that belong to the conduction pathways class.
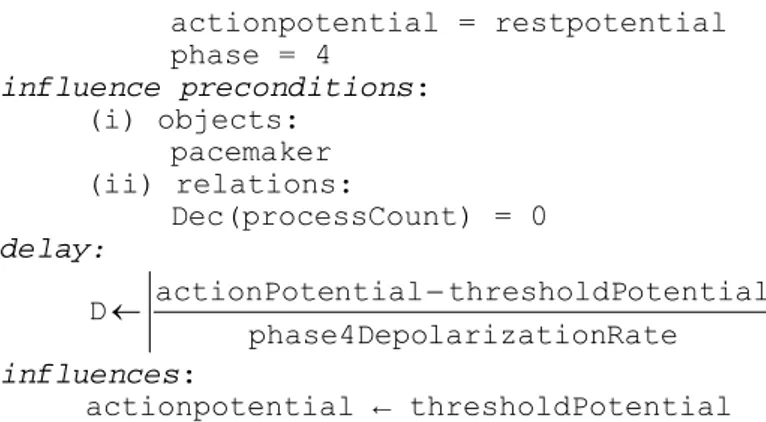
Processes are used to represent physical phenomena for describing component behavior and fundamental do-main laws. They can have delays, i.e. there can be a time lag between the activation of a process and its influ-ences on the model. Delays are explicitly represented by the delay parameter D in process definitions as the one shown below: Process: name: Phase4Depolarization class: PacemakerProcess activation preconditions: (i) objects: pacemaker
actionpotential = restpotential phase = 4 influence preconditions: (i) objects: pacemaker (ii) relations: Dec(processCount) = 0 delay: Rate larization phase4Depo otential thresholdP ntial actionPote D← − influences: actionpotential ← thresholdPotential
Therefore, a process activated at time t will have its influences felt at time tinf = t + D.
Preconditions govern the activation and firing of processes. They are defined in terms of objects, interconnec-tion relainterconnec-tions among objects, and parameter relainterconnec-tions. In the process described before there are two kinds of preconditions: i) activation preconditions, to determine if the concerned process should be activated, and ii) influence preconditions to determine which particular influence should be fired at tinf.
A parameter value has a qualitative magnitude and a sign associated with it. The sign indicates whether the quantity is increasing, decreasing, or steady. The magnitude can be expressed in terms of landmark values (e.g., threshold potential, TP) or intervals between two landmarks. Changes caused by process influences move a parameter value from a landmark to an interval, or an interval to a landmark value. By introducing deviations in parameter values, the model is capable of generating 16 basic arrhythmias, and various combinations of parame-ter values may be used to generate large numbers of complex arrhythmias.
Finally the authors envision possible application of this model for the development of an interactive tutoring system for medical and paramedical personnel and the simulation of drug effects and their interactions as an alternative to expensive laboratory experiments.
5 Ticker Models
In [5] Kirby et al., developed a formalism for describing electrical state, and derived sets of rules which govern transitions between these states. However the usage of these rules without any constraint can end up in a tree of behaviors with an explosive growth in the number of states explored. But they showed how knowledge about state duration, expressed qualitatively, can provide very significant constraints on this growth.
The idea is based upon a class of models called the Ticker models, which represent the space in which the processes of interest take place as a set of one or more anatomical regions: regions are disjoint, and together cover the whole of the space concerned. They are connected to one or more neighboring regions across region
boundaries. They think about models because they obtain a specific member of the class after defining the set of
regions and their connectivity. These form the fixed aspect of the representation of space in a region model; however, neither the regions nor the region boundaries are assigned any spatial properties other than connec-tivity. Fig. 5 provides an example.
region. Finally Fig. 5C shows a seven region model in which the ventricles are expanded into all the components described in Fig. 1. A region state defines the state of a region in a particular given time. The states are based on a simple set of descriptors: P: the region is completely polarized; DP: the region is depolarizing (partly polarized and partly depolarized); D: the region is completely depolarized, or the region is repolarizing (i.e. partly depolar-ized and partly polardepolar-ized). A specific region state is indicated by putting the name of the descriptor, in parenthe-ses, after the name of the region: thus atria(DP) means that the atria are depolarizing.
Rules are used to define which region state transitions are permitted, for example:
if <region> is in <state1>
then <region> can make a <state1> → <state2> transition
Therefore a complete cycle of depolarization and repolarization within a region can be described as follows:
if <region>(P) then <region>(DP) if <region>(DP) then <region>(D) if <region>(D) then <region>(P)
Following there is an example of the rules for the three region model shown in Fig. 5B:
if atria(P)then atria(DP) if atria(DP) then atria(D) if atria(D) then atria(P) if AV_node(DP) then AV_node(D) if AV_node(D) then AV_node(P)
if ventricles(DP) then ventricles(D) if ventricles(D) then ventricles(P)
if AV_node(P) and atria(DP)→atria(D) then AV_node(DP)
if ventricles(P) and AV_node(DP)→AV_node(D) then ventricles(DP)
The first seven rules express the autonomous state transitions in a region. The last two are consulted to see if a change in one region will affect another i.e. conduct an impulse.
A global state for this three region model is built up of the three individual region states. One can construct a global state vector as follows:
[ state-of-atria state-of-AV-node state-of-ventricles ]
For example, a state in which the atria are depolarized (D), the AV node is depolarizing (DP), and the ventri-cles are still polarized (P) would be written:
[D DP P]
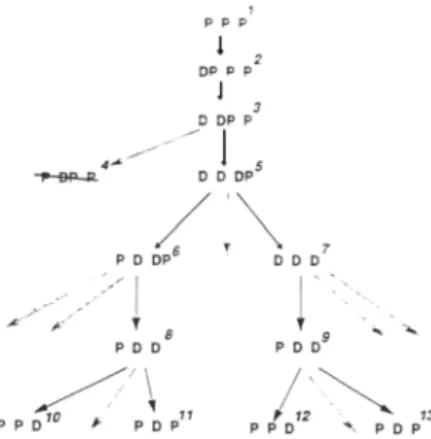
Given a particular starting state, one can simulate all possible sequences of global states (behaviors). Because there are usually several possible global state transitions available at any point, these behaviors form a tree in which any particular behavior forms a branch. Global states can be viewed as nodes in the context of a tree of behaviors. This generation of a tree of behaviors, when unconstrained, suffers the problem of an explosive branching, for example [5] mentions that a tree corresponding to two heartbeats will have 13,780 nodes.
The inclusion of temporal constraints is a possible solution to control the explosive branching. Using qualita-tive relaqualita-tive durations it is possible to constrain the generation of states; that is to say, one region in a particular state, at a particular time must end before, after or at an unknown time in relation to another. These end point relations can be written for regions A and B:
A < B - A must make a transition before B A > B - A must make a transition after B A u B - either may make a transition first
Fig. 6 shows a tree of behaviors where faint arrows indicate the states that where pruned using the temporal constraint mechanism.
Fig. 6. Three of behaviors starting with the myocardium relaxed and all regions in the P state. Faint arrows show the states
that where pruned thanks to the application of the temporal constraint mechanism.
The constraints where developed using the qualitative knowledge that doctors have about durations and by generating a partial ordering of the region states according to their relative durations.
6 Conclusion
The article summarized three of the most well known qualitative models of the human heart: KARDIO, must be considered as one of the most successful and complete qualitative models to date. KARDIO has a more func-tional orientation, the anatomy is secondary. Sometimes these functions would clinically be said to be performed by the same anatomical component of the heart. For example, it separates the AV node into a generator and a conductor, although it is anatomically one entity. Another example is that KARDIO has structures where two impulse descriptions are combined (e.g. in the atria) which have no physical analogue. The other two models where envisioned to solve some of these problems. In particular the Spatio-Temporal approach of [4] is a unique approach in the sense that it was the first attempt to incorporate spatial and temporal qualitative modeling for medical physiology. Finally, the Ticker models of [5] closely follow the anatomical structure and physiological function of the heart, modeling events moment by moment, whereas KARDIO reasons about averaged or typical behavior. However, the models must not be seen as being in competition, but rather as different complementary levels in the spectrum of possible representations.
References
1. Ho KL, Anderson KM, Kannel WB: Survival after the onset of congestive heart failure in Framingham Heart Study sub-jects. Circulation 1993; 88: 107-115.
2. Trainini JC.: The concept of “guilty” structure in heart failure. Rev Argent Cardiol 2001; 69: 128-135.
3. I. Bratko, I. Mozetic, and N. Lavrac, KARDIO: A Study in Deep and Qualitative Knowledge for Expert Systems, MIT Press, 1989.
4. J. B. Weinberg, G. Biswas, S. Uckun: Continuing adventures in qualitative modeling: a qualitative heart model. Proceed-ings of the third international conference on Industrial and engineering applications of artificial intelligence and expert systems, ACM, vol. 1, June 1990.
5. Kirby IK, JRW Hunter: Further Progress in Qualitative Modeling of Cardiac Electrophysiology. Working Papers for QR-91: Fifth International Workshop on Qualitative Reasoning about Physical Systems, pp. 245-262 (1991).