DISI - Via Sommarive, 5 - 38123 POVO, Trento - Italy
http://disi.unitn.it
Social Behavior Analysis of VoIP Users and
its application to Malicious Users Detection
(Extended Version – V1.0)
Raihana Ferdous, Renato Lo Cigno, Alessandro Zorat
February 2014
Technical Report # DISI-14-001
A short version of this Technical Report will be submitted for
peer review.
Social Behavior Analysis of VoIP Users and
its application to Malicious Users Detection
(Extended Version)
Raihana Ferdousa, Renato Lo Cignoa,∗, Alessandro Zorat1
a Dipartimento di Ingegneria e Scienza dell’Informazione (DISI)
Universit`a di Trento, Via Sommarive 5, Povo (TN), Italy
bDipartimento di Ingegneria Industriale (DII)
Universit`a di Trento, Via Mesiano 77, TN, Italy
Abstract
IP Telephony has become very popular and Session Initiation Protocol (SIP)-based telephony systems are almost substituting the traditional PSTN systems. Being so widespread and ubiquitous, the protocol’s resilience and security in presence of incorrect, malformed or malicious messages is fundamental for the correct management of a network. This is of particular importance for the session-based applications since they appear to be much more sensitive very sensitive not only to malicious attacks, but also to errors, and even incorrect interpretation of the standard. To have an in-depth knowledge about the net-work behavior is primary requirement to design and tune any attack or anomaly detection system. In the context of VoIP, traffic analysis plays a very significant role due to the fact that SIP based VoIP traffic does not follow any generic model to describe its characteristics like traditional telephony. To this end, we have performed a thorough analysis on SIP traces captured from the VoIP network of our institution. Here, we use social network analysis techniques to capture the relationship behavior of users and to explore distinct behavioral patterns of users inside the VoIP network. Knowledge about the normal behavior of the system and users gained from the traffic analysis is helpful in detecting intrusion and anomalies. In this paper, we also present an anomaly detection architecture where we train an automated machine with the normal behavioral pattern of the users. The machine, thus trained, is capable of identifying malicious users. Keywords: SIP, VoIP, Social Network Analysis, Clustering, SVN
∗Corresponding author
Email addresses: [email protected] (Raihana Ferdous), [email protected] (Renato Lo Cigno), [email protected] (Alessandro Zorat)
1. Introduction
The transition of telephony over IP platforms has entered its final phase: VoIP directly to the home/business users. All major operators in EU and US are now running SIP-based telephony networks as it provides higher flexibility and more features than traditional architecture. As the popularity and use of SIP-based VoIP application increases, it is attracting the attention of hackers who might inject erroneous SIP messages in a network with malicious or even criminal intentions. Thus it calls for careful attention to the possibility of trans-ferring malformed, incorrect, or malicious SIP messages that can cause problems ranging from relatively innocuous disturbances to full blown attacks and frauds. Moreover, SIP-based applications, appear to be much more sensitive than web services or e-mails to intrusion and mis-functioning, if not for else, because their real-time nature prevents on-line inspection or semantic analysis of the content. Analysis and anomaly detection of SIP based system has thus become an active area of research.
The first step of any protection and anomaly detection process is to acquire a solid insight of the system behavior. Infact, without a deep knowledge of the normal behavior of the network only major service failures would be detectable, and even these would still require huge amount of time for their root cause iden-tification. Even worse, silent problems (e.g., telemarketers sending unsolicited communications using bot machines, billing fraud, etc) not leading to an im-mediate service meltdown would be completely untraceable reducing the users’ confidence and satisfaction in the overall service.
In the context of VoIP, a thorough understanding of network behavior is of paramount importance due to the fact that SIP based VoIP traffic is very different from the traffic model of traditional POTS and ISDN. Though the extensibility and features’ richness of SIP protocol determined its success, but also decreed the drawback of making SIP the most complex IETF standard ever. This, together with the additional extensions added by other standards organizations and consortiums, have turned SIP in a protocol hard to debug and troubleshoot. As if this was not enough, telecommunications operators are using today SIP to implement many different services resulting in a complex in-terdependency across numerous network and service elements. Thus, it changes non marginally the rules of the game in that the characteristics of voice traffic do not match any more the traditional Erlang models, so that a new understanding of the traffic characteristics for SIP-based services is badly needed.
For the reasons outlined above, we have focused on analysis and classifica-tion of SIP based VoIP traffic. To this end a filtering system is proposed in [1, 2] that examines all incoming messages to discard all the syntactically incorrect and semantically meaningless messages in the stream of SIP messages. While the identification of syntactically incorrect SIP messages is straightforward (e.g., either a messages belongs to the language defined by the protocol [3] or it does not), detection of semantically meaningless and harmful content requires the filters to be integrated with the information about normal system and users behavior. For instance, due to low cost VoIP telephony, spammers can very
eas-ily transmit huge number of unsolicited voice messages to legitimate users with telemarketing, phishing or fraud goals. Unlike “spam” in e-mail systems, VoIP “spam” (also known as Spam Over Internet Telephony) calls have to be identi-fied in real time. Content analysis techniques that prove very effective in e-mail spam detection, is not applicable at all in VoIP scenarios due to the fact that content analysis is not possible before the call establishment. Before attending the call the only information available is the identity of the caller and the call recipient. At this stage, detection of spam calls by checking the single message without any prior knowledge about the normal behavior of the system and users is not possible. It requires information about the social interaction pattern of both the caller and the receiver, and also the trust relationship between them to suspect a call as “spam” before attending.
Considering this, we have focused on an in-depth analysis of the network to learn the normal behavior of the system. In telecommunication it is quite common to analyze the individual attributes to understand user behavior, such as the average billing, frequency, amount and time of service usage, and so on. Besides these individual attributes, social network analysis, is a good technique to know how each individual behaves inside the network. Infact, the information about the relations among the individuals within a social network is usually more relevant than the attributes of the individuals to reveal the users [4], specially, social network analysis techniques are suitable to recognize patterns of behavior of users in large amounts of telecomm data. Telecommunications, being an increasingly competitive market, information about patterns of user behavior is very helpful for marketing (e.g., launch new business events, policy, products, etc), applying security solutions and anomaly detection. We use the social behavior analysis techniques in the stream of SIP messages to exploit different levels of behavioral patterns of users. Later, a filtering architecture is proposed where a classifier trained with the normal system behavior is used in detecting harmful contents in SIP traffic.
The rest of this paper is structured as follows: In Section 3 the overall orga-nization of the filtering architecture is briefly outlined. In Section 4 the off-line analysis of the captured SIP trace is presented. Section 6 summarizes the exper-iments and evaluates the performance of the SIP traffic filtering application. 2. Related Work
Works on traffic analysis and intrusion detection of VoIP system in general are too numerous for a comprehensive presentation here, so this section high-lights the papers that focus on analyzing the social tie between the users of the network.
Author of [4] suggests the use of social network techniques to capture the relationship between customers inside the telecommunications network. Infor-mation about the social relationship between the users helps the telecom com-pany in customer management, deployment of new business strategy, and even fraud detection.
Author of [5, 6, 7, 8, 9, 10, 11] consider the social relationship between users as a measure of preventing social threats. Social threats are attacks ranging from the generation of unsolicited communications which are annoying and disturbing for the users to more dangerous data stealing (Vishing) attacks. These are silent attacks and are difficult to identify. In these papers, the notion of trust and reputation helps to discover the social communities inside a network and later such information is used to improve the accuracy of identifying unwanted calls. In a manner similar to our work, [12] analyses a very large data set of call detail records. Their goal to explore the users behavior, as well as of their mutual interaction and communication patterns, allowing to identify certain easily separable user categories. Later, an in-depth analysis is conducted to identify the behavioral pattern of the users that were classified as malicious. The authors suggest that this knowledge about the behavioral pattern of malicious user can be useful in intrusion detection.
3. Filtering Methodology
With the growing acceptance of SIP as the underlying protocol for multi-media applications, many hardware/firmware implementations of this protocol have been developed to be embedded in commercial gateways/routers. Malfunc-tions or non-strict adherence to the SIP protocol specificaMalfunc-tions can cause these devices to produce malformed (e.g., syntactically wrong) or semantically erro-neous (e.g., syntactically correct, but, have no meaning, cannot be interpreted, are ambiguous, or lead to a deadlock, etc) SIP messages. Moreover, attackers might manipulate SIP messages to take advantage of existing security problems in the target system, or to exploit SIP weak points. These messages are correctly formatted, but are harmful and should be discarded without further execution. Messages that do not belong to the language defined by the grammar spec-ified by the protocol can be easily checked by a fairly straight-forward lexical analyzer. On the other hand, detection of semantically erroneous messages and malicious messages require a more delicate handling, as it require the correlation of different messages and it is also not a sharp decision whether a message is semantically meaningful or not.
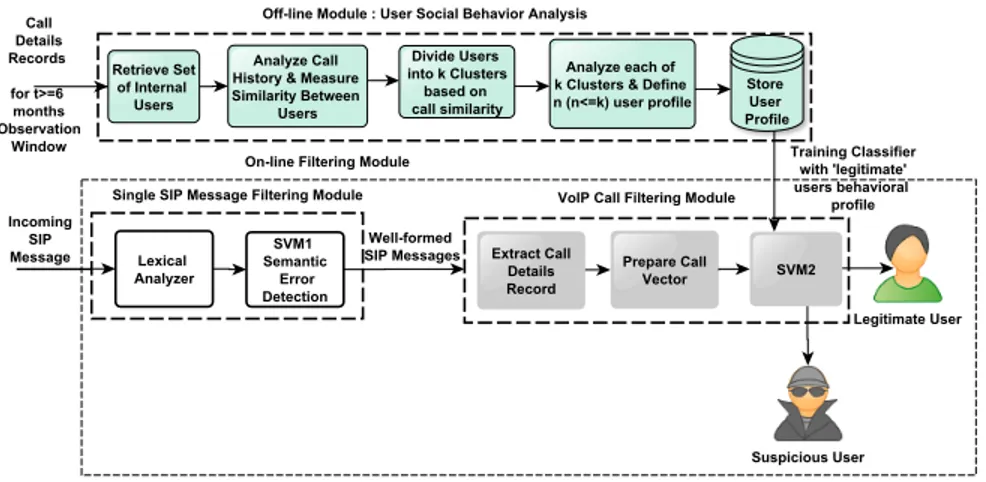
Based on the considerations above, we have developed a two module filter for analyzing traffic and to detect anomalous messages within a stream of SIP messages. The first one is the traffic analysis module which is responsible for the social behavior analysis of the VoIP users, while the second one is the SIP messages filtering module that indentifies anomalous SIP messages. Figure 1 shows the logical architecture of the SIP traffic analysis & filtering system. Description of the modules and their working procedure is described below: 3.1. First Module : Traffic Analysis
This module deals with the analysis of SIP traffic. The social behavior of users inside the system is analyzed here to get a deep knowledge about the normal system behavior. Social network analysis techniques are used here to
Figure 1: System Architecture for SIP message classification
represent user relationships that can be derived along the network paths and eventually to exploit different levels of patterns. This analysis is conducted off-line on a stream of SIP traffic of specific observation window. Details about this analysis is discussed in section 4.
3.2. Second Module : SIP Message Filtering
To identify the various kinds of errors (e.g., malformed, semantically incor-rect, malicious, etc) that can be found in a SIP messages, we have developed two separate filters. The first one controls individual SIP messages. It consists of a lexical analyzer and a supervised classifier to discard the messages that are syntacticaly and semanticaly incorrect. Details about this fist stage filtering is found [1, 2].
The stream of SIP messages passed from the first filter are syntactically and semantically well-formed, but, still they can carry “malicious” contents. Detec-tion of “malicious” content is “fuzzy”, since there is no clear cut algorithmic dividing line that separates all harmful “malicious” content and “good” ones. Any hope of tackling this problem with an algorithmic or table-drive approach is destined to run up against the combinatorial explosion of the cases that need to be considered, as there are endless ways of forming a malicious message.
Hence, the strategy we adopted for this second stage filter is to make it adaptable in a way that takes into account previous experiences. Of the many different techniques that learn from previous examples, we have selected the Support Vector Machines (SVMs) of Vapnik [13] that recently have found use-ful in numerous problem areas. The basic idea is to provide a sufficiently rich set of examples with their correct classification and “train” a machine automaton to carry out such classification, even on messages that were never seen before. An added bonus of this approach is in its flexibility to fit new kinds of bad
messages that might become common at a later time, perhaps as a new breed of malicious messages is introduced when some weakness of the protocol is uncov-ered. The adaptation to the changed operating scenario can be obtained simply by retraining the machine automaton while including the new messages, duly identified as bad.
We have used LibSVM [14], a freely available library for Support Vector Machines, for filtering “malicious” calls and users. As mentioned before, in order to detect hidden “malicious” content, it is highly imperative for the classifier to be integrated with the social behavioral pattern of the users. Considering this, we “train” our SVM classifier with the normal behavioral pattern of the users that are revealed during the traffic analysis in first module 3.1. Information about the normal system behavior helps the classifier in identifying “malicious” calls or users in a test set. Here, a test set contains unlabeled syntactically and semantically well-formed SIP messages that are passed from the first filter. This SVM classifier does not work on individual SIP messages, so, the SIP messages in the test set are further processed and a set of CDRs (call detail record) are extracted by considering the messages involved in each call session. A CDR can have the following information about a call: the identities of the caller and the callee, the time of the call, the duration of the call, a call release reason, the number of packets transferred in both directions, which party disconnected the call, among others. Details about the “training” and performance evaluation of the “train” through various experiments are reported in section 6.
4. Analysis of the Social Behavior of VoIP users
As mentioned in the introduction 1, social network analysis approach is very promising to recognize patterns of users’ behavior in the context of VoIP network. To this end, we established an agreement with our institution that allowed us to collect SIP traces by mirroring the port in front of the SIP Proxy server. Our objective is to analyze the social connection between the VoIP users with the final goal to explore normal system behavior.
4.1. Description of Dataset
Traffic analysis is performed on a subset of the captured real SIP trace that contains traces for over six months (July 2012- December 2012). Around 1.5 million call attempts are retrieved from the captured SIP messages. For our analysis purpose each call is represented as a CDR (Call Detail Record) where each CDR is represented as 4-tuple{x, y, t, l, n}, where user x is the caller, user y is the callee, t is the time of the call arrival, and l is the duration of the call and n is the call status (e.g., successful or cancelled). Among these 1.5 million calls, 483, 261 calls are successfully established.
Figure 2 shows the average call arrival rate in the dataset. Based on the arrival pattern of call request (INVITE message), it is noticed that the busy hour starts from around 8 am and ends around 5 pm.
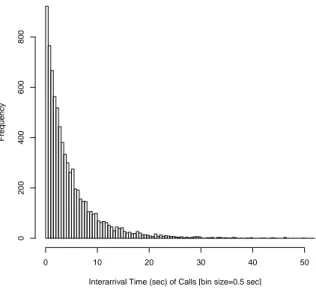
Figure 3 shows the average interarrival time of call requests during the peak hours in weekdays. Figure 4 shows that the interarrival time of the call requests during the peak hours in weekdays follows exponential distribution.
0 1000 2000 3000 4000 5000 6000 0 5 10 15 20 25
Number of INVITE Mess
age
Hour (0-23) of a day Average Arrival of SIP INVITE Messages
Weekdays Weekends
Figure 2: SIP INVITE Message arrival pattern in captured trace
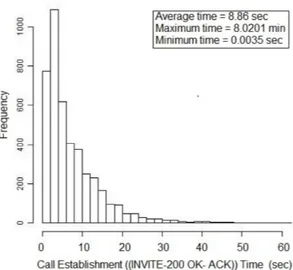
4.2. Call Establishment Time
The average time for establishment of a call through a three-way handshake of INVITE/200 OK/ACK messages is shown in figure 5. Figure 6 shows the distribution of the call establishment time during weekdays.
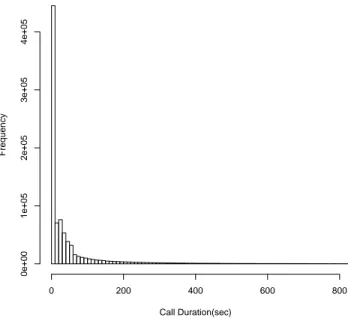
4.3. Call Duration Distribution
Figure 7 shows the distribution of call durations during the observation period. For this plotting, all the calls including unsuccessfull are considered. Thats why figure shows huge amount of calls having call duration less that 10 seconds, which indicates the amount of rejected of cancelled calls.
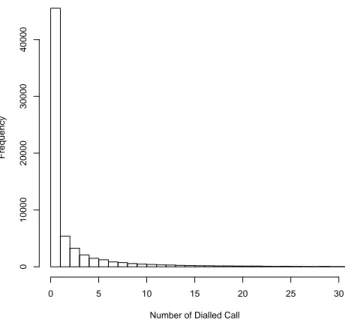
4.4. Call Distribution over Users
Figure 9 and 11 shows the distribution of the calls over the users during the observation period.
5. Social Networks of VoIP Users
After an initial analysis of the CDRs extracted from the captured SIP traces, a total of 89, 152 users (SIP uris) are found that dialed or received at least one call during the whole observation period. In this study, we construct a social
Figure 3: Average Interarrival time of SIP INVITE Messages in a day(8 am - 7 pm)
Interarrival Time (sec) of Calls [bin size=0.5 sec]
Frequency 0 10 20 30 40 50 0 200 400 600 800
INVITE INVITE 100 Trying 180 Ringing 180 Ringing 200 OK 200 OK ACK ACK Media Session 200 OK 200 OK BYE BYE User Agent A SIP Proxy User Agent B 100 Trying 0.0074 sec 0.04193 sec 0.00919 sec 0.544031 sec 0.00919 sec 7.3944 sec 0.8323 sec 0.00983 sec 0.00983 sec
Figure 5: Average time of call establishment
Distribution of Call Duration Call Duration(sec) Frequency 0 200 400 600 800 0e+00 1e+05 2e+05 3e+05 4e+05
Figure 7: Distribution of Call Duration
Call Duration(sec) [Bin Size= 5 sec]
Frequency 0 200 400 600 800 1000 0 10000 20000 30000 40000
Number of Dialled Call Frequency 0 5 10 15 20 25 30 0 10000 20000 30000 40000
Figure 9: Distribution of Call over the Callers
Number of Received Call
Frequency 0 5 10 15 20 25 30 0 10000 20000 30000 40000
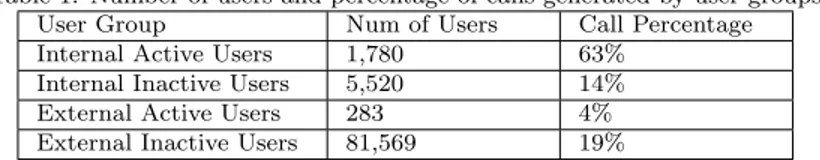
Table 1: Number of users and percentage of calls generated by user groups User Group Num of Users Call Percentage Internal Active Users 1,780 63%
Internal Inactive Users 5,520 14% External Active Users 283 4% External Inactive Users 81,569 19%
network of these VoIP users from the data set consisting of their VoIP phone call records over a period of one year. Of those, 7, 300 are found to be internal users and the remaining 81, 852 are identified as external users (e.g., mobile/land line outside the university domain). The set of internal users consists of adminis-trative, technical, teaching and research stuffs.
We noticed that a large number of users generate a call only once or twice during the observation period. Thus, an activity threshold is used to differen-tiate the least active users from the most active ones. The threshold is defined based on the activity of users during the observation window. An user is defined as active if he/she remains active for at least 25% of the time of the observation period to generate or receive calls. This indicates that an active user dialed or receive successful calls for at least 45 days (can be non-consecutive) during the total 184 observation days. Both sets of internal and external users are divided into active, and inactive users. Table 1 shows the number of users and percentages of calls generated by the four user groups.
In our endeavor to construct a social network from the CDRs, we first need to properly define the set of “nodes” connected by one or more “links” (e.g., distinct types of relationships between “nodes”). In the context of VoIP, it is quite common that “nodes” are assigned to users and “links” are the communication (e.g., call, sms, video chat, etc) between them. It is found, if we consider the whole set of users that are observed during the observation window, the social network becomes huge, with a really large number of “nodes” (total 89, 152 users) and “links” (here, frequecy of calls between users). It is hard to analyze such a large social network and to understand its structure, pattern, and member behavior. Inorder to avoid the trouble of analyzing a huge social network, we have only consider the set of “internal active” users. The reason of excluding the other groups of users shown in table 1 is because their activity is very limited during the observation window, thus, analyzing their behavior does not provide any helpful indication about the users behavior and characteristics. So, an in-depth analysis of the relationship among the “internal active” users is performed to identify common behaviors of users, with the aim of making some usage patterns emerge from the data.
First, we build a caller-callee social network considering the frequency of communication between the “internal active” users. This is a directed weighted call graph G(V, E), where, V (G) is a vertex representing the “internal active” users and E(G) is an edge that exists if users have at least one call between them. It is found that this call graph captures only 10% information of the total calls being generated during one year observation window. We also measure the
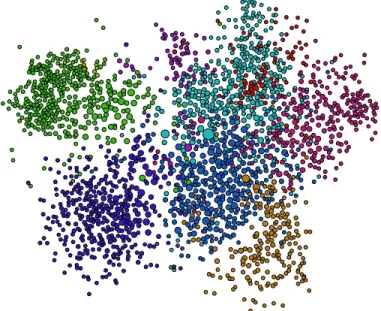
density of the call graph G(V, E) to reveal how closely the group of “internal active” users is connected. Density of a graph is measured by the percentage of the number of actual ties/connection/links present in the group relative to the number of possible links in the group (i .e., if everyone had a relationship with everyone else in the group). Density of the call graph G(V, E) is 0.023 which indicates that the graph is very sparse (e.g., internal communication between the “internal active” users is not frequent). Infact, call graph G(V, E) only explores the inter and intra departmental communication structure, it does not reveal the social behavior of the “internal active” users with the outside world. Figure 11 shows that based on the frequency of communication the group of “internal active” users can be divided into 10 communities, in this context these communities refer to different departments.
Figure 11: Communities of “internal active” users based on frequency of internal communi-cation
In order to explore the social behavior of the “internal active” users, we have redefined the previous call graph. We represent a undirected weighted graph G1(V, E), where, V (G1) is a vertex representing the “internal active” users and E(G1) is an edge refering the strength of social interaction between users and is expressed by a value range from 0 to 1. similarity of call pattern between two users. The strength of social interaction between two users i and j can be measured by the similarity of their call patterns (e.g., a set of common friends) and intensity of their internal communication. The strength of the similarity between two users can be expressed by a value range from 0 to 1. We measure the similarity between the users through their internal communication and also
the communication with the neighbors (e.g., a set of common friends), the two indices are described below:
• Intensity of internal Communication IC(i, j):
This is measured by taking account the percentage of dialed calls between two users, over the total number of calls. For example, internal commu-nication between users i and j is defined as follows:
IC(i, j) = Total num. of calls by i + Total num. of calls by jNum. of calls between user i and j • Similarity of Call Pattern - J(i, j):
Similarity of call pattern between two users is measured by considering the number of their common neighbors/friends. We measure it by the Jaccard similarity coefficient, a frequently used statistic measure for comparing the similarity and diversity of sample sets. It is defined as the size of the intersection divided by the size of the union of the sample sets. Here, it is used to measure the percentage of common friends between two users. For example, the Jaccard similarity coefficient between user i and j is defined as follows:
J(i, j) = |A∩B||A∪B|
where A and B are the sets of users called by user i and by user j, respectively.
The social similarity/relationship measure Sim(i,j) between two users i and j is then defined as the sum of the two indices above:
Sim(i,j)= J(i,j) + IC(i,j) 5.1. Community/Cluster Detection
Social network analysis techniques look at the individual in the network as a communitiy instead of considering as a single entity. A commuinty is com-prised of individuals with similar behavior and characteristics. The concept of community is one of everyday familiarity and community analysis is quite relevant to reveal distinctive patterns inside networks. In telecommunication, for instance, where the entire network is huge and sparse, the identifications and analysis of smaller internal communities is quite relevant for not only for business purposes but also to retrieve comprehensive information from their structure. Infact, in such context, consideration of the rich set of interactions between individuals in the network can discover complex community structure, capturing highly connected circles of friends, families, or professional cliques in the observed network. Thus the issue of detection and characterization of com-munity structure in networks has received a considerable amount of attention [15, 16, 17, 18, 19, 20].
We have performed different experiments to explore different community structures from the network we are considering. We want to discover this
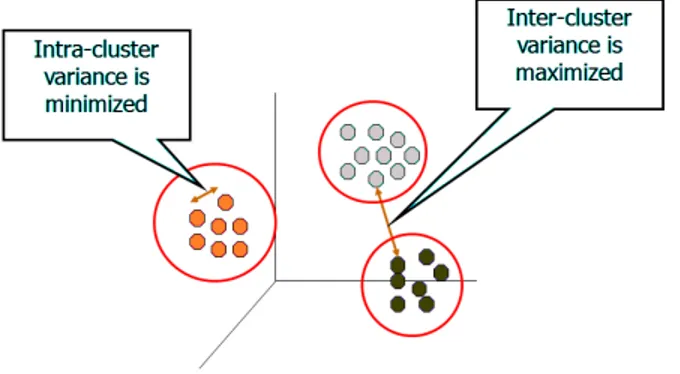
struc-number of communities, so we go for unsupervised clustering to find out k communities. K-means clustering algorithm [21, 22], a widely used machine learning technique for unsupervised classification of data, is used here to group together the set of 1, 780 “internal active” users into pre-defined k communi-ties/clusters where users insider a cluster are of similar social behavior. Briefly, the k-means clustering algorithm takes a set of n observations and a (fixed) integer k (1 <= k <= n) and proceeds to partition the n observations into k clusters so that some optimization measure is optimized – typically one wants observations belonging to the same cluster to have a high “similarity” measure, while observations belonging to different clusters should have a very low “simi-larity” measure. Intuitively, data points in a cluster should be “densely packed”, while different clusters should be well “separated” from one another. Figure 12 shows an example of classification using k-means clustering algorithm.
Figure 12: Example: k-means clustering
5.1.1. Determining the number of Clusters (k)
Determining the optimal number of clusters is essential for effective and efficient data clustering. The correct choice of k is often ambiguous and depends on the shape and scale of the distribution of points in a data set. There are several techniques of choosing the suitable number of clusters. Though neither of them guarantee to discover the “best” solution, but, can give an idea of the possible cluster structure.
We have started with the common method which is to compare the intra-cluster variance for a number of intra-cluster solutions. It is noted that increasing k (number of cluster) without penalty will always reduce the amount of error in the resulting clustering, to the extreme case of zero error if each data point is considered its own cluster (i.e., when k equals the number of data points, n). Intuitively then, the optimal choice of k will strike a balance between maxi-mum compression of the data using a single cluster, and maximaxi-mum accuracy by assigning each data point to its own cluster.
The plot (in figure 13) of the intra-cluster variance (“within cluster sum of squares (WSS)”) against a series of sequential clusters (here, 2<k<20) on
our dataset provides a useful graphical way to choose an appropriate number of clusters with lowest lower intra-cluster distance. Intra-cluster distance of a cluster i is measured by the sum of squared Euclidean distances between the data instances and its center. It is known as “within cluster sum of squares (WSS)” and is calculated as : Pxj
i∈Si(x j i − ci)
2
, where ciis the centroid of ith
cluster.
Total “WSS” for k clusters can be evaluated as : Pki=1
P xji∈Si(x j i − ci) 2 . Usually for a clearly separable data set the reduction in “WSS” drops dra-matically till a point with the increase of the number of cluster (k) and after that it reaches a plateau. This produce an “elbow” (The largest magnitude difference between two points) in the plot. The location of the “elbow” in the resulting plot indicates [23, 24, 25] that a satisfactory number of clusters have been reached. This “elbow” cannot always be unambiguously identified. For example, in case of our dataset we do not find such a sharp reduction (“elbow”) of “WSS” with the with the increase of number of cluster (shown in figure 13). Though it is noticed that k=9 can be a suitable solution as further increasing the number of cluster (e.g., k>9) do not have a substantial impact on the clustering solutions. ● ● ● ● ● ● ● ● ● ● ● ● ● ● ● ● ● ● ● 5 10 15 20 70 80 90 100 110
Value of k(Number of Cluster)
Intr
a−Cluster Distance
Figure 13: Intra-cluster distance for different values of k (number of clusters)
We have also followed probabilistic approach (expectation maximization in Gaussian Mixture Models) to solve the problem of determining the optimum number of clusters [26]. Here, we assume that our dataset x is drawn from k
Gaussian distributions, f (x) =Pki=1λifi(x), where fiis the probability density
function of the observations in group k, and λi is the probability that an
obser-vation comes from the kth mixture component (λ
i ∈ (0, 1) andPki=1λi = 1).
The Expectation- Maximization algorithm is used to estimate the parameter (e.g., number of Gaussian distributions in the mixture density/number of clus-ter) through maximum likelihood. In selection of the “best” model that fit our data, we extend the use of Expectation- Maximization algorithm within a varying range of possible number of clusters (1<k<20) and then models are compared using Bayesian Information Criterion (BIC) [27], a statistical criterion for model selection. Figure 14 shown the result of such model based approach. Model with the highest BIC indicates the “best” model to fit the data. Figure
5 10 15 20 95000 100000 105000 110000 115000 120000 number of components BIC ● ● ● ● ● ● ● ● ● ● ● ● ● ● ● ● ● ● ● ● ● ● ● ● ● ● ● ● ● ● ● ● ● ● ● ● ● ● ● ● ● ● ● ● ● ● ● ● ● ● ● ● ● ● ● ● ● ● ● ● ● ● ● ● ● ● ● ● ● ● ● ● ● ● ● ● ● ● ● ● ● ● ● ● EII VII EEI VEI EVI VVI EEE EEV VEV VVV
Figure 14: Selection of best model using Bayesian information criterion (BIC)
14 shows that the best model is “VEV” which indicates that the model is el-lipsoidal with 9 components/clusters where the shapes of all clusters are equal while their volume and orientation may vary. Details about all the models is found in [28].
5.1.2. Cluster Analysis
By applying k-means clustering algorithm the set of “internal active” users are divided into 9 communities/clusters in terms of distinct behavior. Figure 15 shows the 9 clusters of users in two dimensional space. In the figure the clusters are not clearly distingushable as the first two components cover only 28% of the total variance (shown in table 2) among the 12 components/features that are used to describe our dataset. Figure 16 shows the call flow between clusters of
Table 2: Importance of 12 components Comp. No 1 2 3 4 5 6 7 8 9 10 11 12 Standard deviation 0.09 0.08 0.07 0.07 0.06 0.06 0.06 0.06 0.06 0.05 0.05 0.05 Proportion of Variance 0.15 0.13 0.11 0.10 0.08 0.08 0.07 0.06 0.06 0.06 0.05 0.05 Cumulative Proportion 0.15 0.28 0.39 0.49 0.57 0.65 0.72 0.78 0.84 0.90 0.95 1.00 −0.1 0.0 0.1 0.2 0.3 −0.2 −0.1 0.0 0.1 0.2 0.3 0.4 0.5 Dimension 1 Dimension 2 ● ● ● ● ● ● ● ● ● ● ● ● ● ● ● ● ● ● ● ● ● ● ● ● ● ● ● ● ● ● ● ● ● ● ● ● ● ● ● ● ● ● ● ● ● ● ● ● ●●● ● ● ● ● ● ● ● ● ● ● ● ● ● ● ● ● ● ● ● ● ● ● ● ● ● ● ● ● ● ● ● ● ● ● ● ● ● ● ● ● ● ● ● ● ● ● ● ● ● ● ● ● ● ● ● ● ● ● ● ● ● ● ● ● ● ● ● ● ● ● ● ● ● ● ● ● ● ● ● ● ● ● ● ● ● ● ● ● ● ● ● ● ● ● ● ● ● ● ● ● ● ● ● ● ● ● ● ● ● ● ● ● ● ● ● ● ● ● ● ● ● ● ● ● ● ● ● ● ● ● ● ● ● ● ● ● ● ● ● ● ● ● ● ●● ● ● ● ● ● ● ● ● ● ● ● ● ● ● ● ● ● ● ● ● ● ● ● ● ● ● ● ● ● ● ● ● ● ● ● ● ● ● ● ● ● ● ● ● ● ● ● ● ● ● ● ● ● ● ● ● ● ● ● ● ● ● ● ● ● ● ● ● ● ● ● ● ● ● ● ● ● ●●● ● ● ● ● ● ● ● ● ● ● ● ● ● ● ● ● ● ● ● ● ● ● ● ● ● ● ● ● ● ● ● ● ● ● ● ● ● ● ● ● ● ● ● ● ● ● ● ● ● ● ● ● ● ● ● ● ● ● ● ● ● ● ● ● ● ● ● ● ● ● ● ● ● ● ● ● ● ● ● ● ● ● ● ● ● ● ● ● ● ● ● ● ● ● ● ● ●● ● ● ● ● ● ● ● ●● ● ● ● ● ● ● ● ● ● ● ● ● ● ● ● ● ● ● ● ● ● ● ● ●● ● ● ● ● ● ● ● ● ● ● ● ● ● ● ●● ● ● ●● ● ● ● ●● ● ● ● ● ● ●● ● ● ● ● ● ● ● ● ● ● ●● ● ● ● ● ● ● ● ● ● ●● ● ● ● ● ●
“internal active” users, and the remaining users groups (e.g., “internal inactive”, “external active” and “external inactive”).
●
●●
● C1 C2 C3 C4 C5 C6 C7 C8 C9 II EA EIFigure 16: Communication between user groups. Vertex label C1-C9 indicates clusters of “internal active”users, II, EA adn EI indicates “internal inactive”, “external active” and “external inactive” users. Size of the vertex corresponds to the size of the user group, smallest one indicates at least 78 users. A thinnest edge between two groups indicates at least 4000 calls)
A deep analysis of these clusters of users can discover network normal behav-ior. Analyzing the behavior of users inside 9 clusters, three behavioral patterns are noticed. These behavioral patterns are described in table 3 using a set of features. Few important features are follows:
• Interactivity of User- Defined by the ratio of the incoming and outgoing calls (of an user) during the observation period.
Interactivity of User A = Received Call by User ADialed Call by User A
• Activity Duration of User- Defined by the ratio of the time an user remains active and the total observation window.
Activity Duration of user A = Period when user A remain active Total observation period
• Sociality of Users- An user is called “social” if he intend to call to a variety of people instead of maintaining communication only with fixed set of people. These is measured through the features “sociality” and “dynamicity” :
Sociality of User A = Number of contacted Callees by User ATotal calls generated by User A Dynamicity of User A = Number of contacted Callees by User ATotal Number of Users
In our analysis, an users can be tagged as “social” if it is found that during the observation window his “sociality”>=0.5 and “dynamicity”>0.06.
Table 3: Three distinct social behavioral pattern of “internal active” users
Feature Pattern 1 Pattern 2 Pattern 3
Num of users 619 2, 674 487
Interactivity of users 90% users are receiver 87% users are caller 90% users are both caller and receivers
Num of clusters 5 3 1
Num of “social” user 38 63 24
Activity Duration 80% 70% 92%
Internal Communication Very Little Very Little Very Little
Num. of Dialled Call
Total Call 1.5% 50% 48.5%
Num. of Received Call
Total Call 45% 12%, 39%
Active Hour in a day 8-17 8-17 8-17
Inactive Months August & December August & Decem-ber
August & Decem-ber
Description of these patterns is found below: • User Behavior Pattern 1
-Users of cluster 1, 5, 6, 7 and 8 follow this behavioral patter. The main characteristics of this pattern is that the users are mainly receivers. Infact, about 90% (554 out of 619) users receive calls at least five times large number of calls than they generate (here, Received Call by User ADialed Call by User A <= 0.3). Users of these 5 clusters receive 45% calls of the total calls generated by all the users during the observation window. Most of the users of these clusters remain active for 70% time of the observation window. Here, in most of the cases, the users of same cluster are not closely connected, because, they only intend to receive a lot of calls instead of generate. That is why very few internal friend groups are found inside these clusters. Figure 17 shows the internal communication between users of cluster 51.
• User Behavior Pattern 2
-Users of cluster 2, 3, and 4 follow this behavioral patter. The main charac-teristics of this pattern is that the users are mainly callers. Infact, about 87% (586 out of 674) users generate at least three times large number of calls than they receive (here, Received Call by User ADialed Call by User A >= 3). Users of these 3 clusters generate 50% calls of the total calls generated by all the clusters of “internal active” users. Most of the users of these clusters remain ac-tive for 80% time of the observation window. Though, here users generate huge call, most of their calls are directed to other clusters, “internal inac-tive” and “external” user groups. That is why, users of the same clusters are very lightly connected with each other. Figure 18 shows the internal communication between users of cluster 21.
• User Behavior Pattern
3-1Red filled “circle” indicates callers, grey filled “circle” indicates receivers, “square”
● ● ● ● ● ● ● ● ● ● ● ● ● ● ● ● ● ● ● ● ● ● ● ● ● ● ● ● ● ● ● ● ● ● ● ● ● ● ● ● ● ● ● ● ● ● ● ● ● ● ● ● ● ● ● ● ● ● ● ● ● ● ● ● ● ● ● ● ● ● ● ● ● ●
Figure 17: Internal communication between users of Cluster 5 (Thinnest edge indicates 10 call) ● ● ● ● ● ● ● ● ● ● ● ● ● ● ● ● ● ● ● ● ● ● ●
●
● ● ● ● ● ● ● ● ● ● ● ● ● ● ● ● ● ● ● ● ● ● ● ● ● ● ● ● ● ● ● ● ● ● ● ● ● ● ● ● ● ● ● ● ● ● ● ● ● ● ● ● ● ● ● ● ● ● ● ● ● ● ● ● ● ● ● ● ● ● ● ● ● ● ● ● ● ● ● ● ● ● ● ● ● ● ● ● ● ● ● ● ● ● ● ● ● ● ● ● ● ● ●Figure 18: Internal communication between users of Cluster 2 (Thinnest edge indicates 10 call)
Users of cluster 9 follow this behavioral patter. The main characteristics of this pattern is that most of the users not only dial calls but also receive a large number of calls. The “interactivity” of the users of these clusters can be defined as : 0.4<Dialed Call by User AReceived Call by User A < 3). These users remain active usually for 60% time of the observation window. Though, here users gen-erate and receive huge call, most of their calls are directed to other user groups. That is why, users of the same clusters are very lightly connected with each other. Figure 19 shows the internal communication between users of cluster 91.
●
● ● ● ● ●●
●
●●
●
●●
● ●●
● ●●
● ● ● ● ● ●●
●
● ● ● ● ● ●●
● ● ●●
● ●●
● ●●
● ● ● ● ● ● ● ● ● ● ● ● ● ●●
●●
● ● ● ● ● ● ● ● ● ● ● ●●
●Figure 19: Internal communication between users of Cluster 9 (Thinnest edge indicates 10 call)
6. Experimental Results & Performance Evaluation
This section describes the details about the configuration and performance evaluation of the filtering system defined in Section 3.
6.1. Training of SVM Classifier
Application of social network analysis techniques in the stream of SIP mes-sages (captured from our institution) reveals normal behavioral pattern of the “internal” users (both “active” and “inactive”) in the system (described in Sec-tion 4). Specially, three behavioral patterns of the “internal active” users are noticed and we consider all of them to be “legitimate”2.
2VoIP network of our institution being a closed network, the probability of transmitting
“harmful” messages is low. This condition is however about to change as our institution is going to directly connected with public VoIP networks. This work is an attempt to prepare
The SVM classifier is trained with the “legitimate” behavior patterns of “active” and “inactive” internal users. The classifier, thus, learned about the behavior of “internal” users, examines the unlabeled call vectors in the test set. During this process, the classifier observes the behavior of the “internal” users and any suspected deviation of their behavior is identified.
6.2. Performance Evaluation
The performance of the SIP message filtering system proposed in section 3 is evaluated through various experiments. For these experiments a statistically relevant collection of data (in this context, a large number of SIP traces) would be needed. As no such publicly available VoIP corpus is found for testing the classifier, we used real SIP traces that is captured through an agreement with our institution that allowed us to collect SIP traces by mirroring the port in front of the SIP Proxy server.
The collected sample contained over six months (January 2013- July 2013) SIP trace with around 46 millions SIP messages. The SIP messages are further processed and 422, 687 calls are retrieved from the 46 million SIP messages among which 230, 816 were successfully established. Each call is represented with the information about the arrival time, duration, caller and receiver name of the call which is known as the CDR (call detail record). Around 48 thousand SIP uris are found that are related to these calls, among these 8, 498 are internal users while the remaining are external users.
Dataset collected from our institution do not contain any messages that were maliciously sent with the intention of harming the network due to the fact that this is a closed network. To counteract the lack of “malicious” calls in our collected sample, we randomly inject synthetic “malicious” calls into the stream of real VoIP calls. Inorder to generate synthetic traces, we developed “VoIPTG”3, a flexible and generic traffic generator, which is capable to emulate
the real world VoIP traffic including normal and attack scenarios. 6.3. Injection of Synthetic Malicious Traces
Though there are various kinds of “attacks” listed in the literature4,5[29, 30],
in this experiment, we have focused on detection of social threats and toll fraud. Social threats are transmission of unsolicited voice messages with telemarketing, phishing or even fraud goals. While, toll fraud is the unauthorized usage of paid communication services.
We focus on these two atatcks as detection of these silent attacks are dif-ficult. For instance, the characteristics of the spam callers are not always clearly separable from that of the “legitimate” users. Usualy, telemarketers
3VoIPTG: VoIP Traffic Generator. http://disi.unitn.it/~ferdous/VoIPTG.html 4VoIP Security and Privacy Threat Taxonomy, VOIPSA (2005),
www.voipsa.org/Activities/VOIPSA Threat Taxonomy 0.1.pdf
5VoIP Security Threats,S. Niccolini, 2006
Table 4: Description of synthetic synthetic attacks scenarios Scenario Description Time Total
Call
“Internal” Users
“Malicious” Users “Spam” calls 2 week (weekdays) 8 am-5 pm 40,000 30 30 “Spam” calls 1 week (weekdays) 8 am-12 pm 30,000 40 30 “Spam” calls 1 week (weekdays) 11 am-6 pm 30,000 40 30 “Toll Fraud” 4 week (weekdays
& weekends)
8 am-11 pm 80,000 40 30
“Toll Fraud” 2 week (weekdays) 8 am-5 pm 20,000 20 30
and advertisers tend to call a large number of people to deliver their messages [31, 32, 5, 6, 7, 10, 11] often resulting in short duration calls as the other party quickly hangs up after realizing that the call is spam. On the other hand, traffic analysis of real trace collected from our institution shows that a large number of “legitimate” users only generate calls while receives very few or no call at all during the whole observation period. In such context, it requires a deli-cate handling to distinguish the group of “legitimate” callers from the group of spammers.
Inorder to imitate social attack scenario, we inject a huge amount of “spam” calls randomly selected 110 “internal” (70 “active” and 40 “inactive”) users among 8, 498 users found in the dataset containing real VoIP calls. Following the general assumption about the characteristics of the “spam” calls, these synthetic calls are generated during peak hour, with very low interarrival time difference and of short duration. Callers of these calls are a set of synthetically generated “external” SIP uris that refers to the set of spam callers.
In toll fraud attack, due to the deployment of inadequate security, “mali-cious” users can make unauthorized usage of paid communication services (such as international calling) where they may call few subscribers (“legitimate” users) of the network and prepended a “malicious” number (mostly in some other coun-try) to which the system sets up calls. In result, the organization has to pay a huge phone bill that is way higher than its typical monthly bill. Inorder to imitate such scenario, we randomly select 60 “internal” users (30 “active” and 30 “inactive”). A large number of synthetic calls are injected into the real trace indicating that these calls are generated from these 60 users to a set of external sip uris (indicating “malicious” numbers). Figure 20 shows the call distribu-tion per user per day during synthetic attacks and legitimate normal scenarios. Details about the synthetic attack scenarios are reported in table 4.
6.4. “Test” set
Detail about the new “test” set (combination of real and synthetic calls) and the achieved accuracy by the SVM classifier on this “test” set is found in table 5.
The SVM classifier checks the behavior of all the 8, 498 internal users (ob-served in the test set). Total 1,020 “internal” users are found those were not present during the training period. The classifier declares them as “good” user
0 20 40 60 80 100
Mon Tues Wed Thurs Fri Sat Sun
Number of Call
Day
Spam caller vs Legitimate User
normal normal normal normal spam 0 20 40 60 80 100
Mon Tues Wed Thurs Fri Sat Sun
Number of Call
Day Fraud vs Legitimate User
normal normal normal normal toll-fraud
Figure 20: Daily call distribution per user during synthetic attacks and legitimate normal scenarios
Table 5: SIP call classification result using SVM
Description Value
Total Calls 430,816
Number of real “good” calls 230,816
Number of synthetic “spam” calls 100,000 Number of synthetic “toll fraud” calls 100,000
User Description Total Number of Users observed in test set 48,699 Number of “internal active” users found in test set 1,985 Number of “internal inactive” users found in test set 6,513 Number of “external active” users found in test set 412 Number of “external inactive” users found in test set 39,789 New “internal active” users not found during training 33 New “internal inactive” users not found during training 987 Number of “internal” users who receive synthetic “spam” calls 110 Number of “internal” users who generate synthetic “toll
fraud” calls
60
SVM Classifier Result
True positive(“malicious” users identified as “malicious”) 161 False positive(“good” users identified as “malicious”) 426 True negative(“good” users identified as “good”) 8,072 False negative(“malicious” users identified as “good”) 9
window. On the other hand, behavior of 426 users are identified as “suspicious” due to the fact that these users suddenly become “active” during “test” period, while they were “inactive” during training. These users infact are “legitimate”. We also focused on the time required for the SVM classifier to detect an at-tack scenario. This classifier observes every call and checks the behavior of the “internal” users associated with that call. As soon as it notices any significant deviation of the behavior of any of the “internal” users from his/her “normal” behavior, the classifier suspects that user as “malicious”. In the synthetic at-tack scenarios (described in table tab:syntheticmaliciousscenarios), the atat-tack starts slowly from zero and increases until it reaches the maximum rate, then, the maximum rate is maintained constant until the attack duration stops. We noticed that the SVM classifier is able to detect the attacks as soon as the traf-fic reaches the maximum rate. For example, during synthetic “social” attack scenario, huge amount of calls (at least 100 call/day) are directed to an “inter-nal” users (named “A”) for five consequitive days. This changes their behavior significantly in the context of receiving calls as they normally recieve at most 10/20 calls per day. The classifier observes each call directed to this user and it notices a dramatic increase in the frequency of received calls by user “A”. At the end of the day, considering the patterns (low duration and interarrival time) of those incoming calls towards user “A”, the classifier suspects that user “A” is receiving a lot of “spam” calls. All our experiments are done in a machine of Intel Core i7 CPU, 2.0 GHz Quad-core and 8 GB RAM memory.
6.5. Experiment with “Spitter” tool
The efficiency of our proposed filtering system is also tested through “Spit-ter” 6 which a publicly available tool implemented by the author of [30] to
perform VoIP spam testing. This tool uses the Asterisk IP PBX as a platform from which it launches SPIT calls (i.e. VoIP SPAM). Details about experiments with the tool “Spitter” and performance accuracy is found in table 6.
7. Conclustion
In this paper, we have performed a in-depth analysis of SIP based VoIP traffic captured from our institution. In order to explore the legitimate behavioral structure of the internal users, we have used social network analysis techniques. We have shown that information retrieved from the traffic analysis can be useful in applying security measures in the network. To this end, we propose a filtering approach for detecting malicious users.
Table 6: Experiments performed on traces generated by “Spitter” tool
Description Value
Total Calls 5,000
Number of “good” calls 3,128
Number of “spam” calls 1,872
Total Number of “good” users 100 Total Number of “good” users 20
SVM Classifier Result
True positive(“malicious” users identified as “malicious”) 18 False positive(“good” users identified as “malicious”) 3 True negative(“good” users identified as “good”) 97 False negative(“malicious” users identified as “good”) 2
Accuracy 95.83%
References
[1] R. Ferdous, R. Lo Cigno, A. Zorat, Classification of sip messages by a syntax filter and svms, in: Global Communications Conference (GLOBE-COM), 2012 IEEE, IEEE, 2012, pp. 2714–2719.
[2] R. Ferdous, R. L. Cigno, A. Zorat, On the use of svms to detect anomalies in a stream of sip messages, in: Machine Learning and Applications (ICMLA), 2012 11th International Conference on, Vol. 1, IEEE, 2012, pp. 592–597. [3] J. Rosenberg, H. Schulzrinne, G. Camarillo, A. Johnston, J. Peterson,
R. Sparks, M. Handley, E. Schooler, SIP: Session Initiation Protocol, RFC 3261 (June 2002).
[4] C. A. R. Pinheiro, Social network analysis in telecommunications, Vol. 37, John Wiley & Sons, 2011.
[5] M. A. Azad, R. Morla, Caller-rep: Detecting unwanted calls with caller social strength, Computers & Security.
[6] V. Balasubramaniyan, M. Ahamad, H. Park, Callrank: Combating spit using call duration, social networks and global reputation., in: CEAS, 2007. [7] P. Kolan, R. Dantu, Socio-technical defense against voice spamming, ACM
Trans. Auton. Adapt. Syst. 2 (1).
[8] N. Chaisamran, T. Okuda, G. Blanc, S. Yamaguchi, Trust-based voip spam detection based on call duration and human relationships, in: Applications and the Internet (SAINT), 2011 IEEE/IPSJ 11th International Symposium on, IEEE, 2011, pp. 451–456.
[9] H.-J. Kim, M. J. Kim, Y. Kim, H. C. Jeong, Devs-based modeling of voip spam callers behavior for spit level calculation, Simulation Modelling Prac-tice and Theory 17 (4) (2009) 569–584.
[10] H. Sengar, X. Wang, A. Nichols, Thwarting spam over internet telephony (spit) attacks on voip networks, in: Proceedings of the Nineteenth Interna-tional Workshop on Quality of Service, IEEE Press, 2011, p. 25.
[11] Y.-S. Wu, S. Bagchi, N. Singh, R. Wita, Spam detection in voice-over-ip calls through semi-supervised clustering, in: Dependable Systems & Net-works, 2009. DSN’09. IEEE/IFIP International Conference on, IEEE, 2009, pp. 307–316.
[12] S. Chiappetta, C. Mazzariello, R. Presta, S. Romano, An anomaly-based approach to the analysis of the social behavior of voip users, Computer Networks.
[13] V. N. Vapnik, The nature of statistical learning theory, Springer-Verlag New York, Inc., NY, USA, 1995.
[14] C. Chang, C. Lin, LIBSVM: A Library for Support Vector machines, ACM Transactions on Intelligent Systems and Technology 2 (2011) 1–27. [15] M. E. Newman, M. Girvan, Finding and evaluating community structure
in networks, Physical review E 69 (2) (2004) 026113.
[16] M. A. Porter, J.-P. Onnela, P. J. Mucha, Communities in networks, Notices of the AMS 56 (9) (2009) 1082–1097.
[17] M. Girvan, M. E. Newman, Community structure in social and biological networks, Proceedings of the National Academy of Sciences 99 (12) (2002) 7821–7826.
[18] A. Clauset, M. E. Newman, C. Moore, Finding community structure in very large networks, Physical review E 70 (6) (2004) 066111.
[19] V. D. Blondel, J.-L. Guillaume, R. Lambiotte, E. Lefebvre, Fast unfolding of communities in large networks, Journal of Statistical Mechanics: Theory and Experiment 2008 (10) (2008) P10008.
[20] A. Lancichinetti, S. Fortunato, Community detection algorithms: a com-parative analysis, Physical review E 80 (5) (2009) 056117.
[21] J. A. Hartigan, M. A. Wong, Algorithm as 136: A k-means clustering algo-rithm, Journal of the Royal Statistical Society. Series C (Applied Statistics) 28 (1) (1979) 100–108.
[22] T. Kanungo, D. M. Mount, N. S. Netanyahu, C. D. Piatko, R. Silverman, A. Y. Wu, An efficient k-means clustering algorithm: Analysis and imple-mentation, Pattern Analysis and Machine Intelligence, IEEE Transactions on 24 (7) (2002) 881–892.
[23] S. Salvador, P. Chan, Determining the number of clusters/segments in hier-archical clustering/segmentation algorithms, in: Tools with Artificial Intel-ligence, 2004. ICTAI 2004. 16th IEEE International Conference on, 2004, pp. 576–584.
[24] R. Thorndike, Who belongs in the family?, Psychometrika 18 (4) (1953) 267–276.
[25] D. J. KETCHEN, C. L. SHOOK, The application of cluster analysis in strategic management research: An analysis and critique, Strategic Man-agement Journal 17 (6) (1996) 441–458.
[26] C. Fraley, A. E. Raftery, How many clusters? which clustering method? answers via model-based cluster analysis, The computer journal 41 (8) (1998) 578–588.
[27] G. Schwarz, Estimating the dimension of a model, The annals of statistics 6 (2) (1978) 461–464.
[28] C. Fraley, A. E. Raftery, T. B. Murphy, L. Scrucca, Mclust version 4 for r: normal mixture modeling for model-based clustering, classification, and density estimation, Tech. rep., Technical report (2012).
[29] D. Sisalem, J. Floroiu, J. Kuthan, U. Abend, H. Schulzrinne, SIP Security, John Wiley, 2009.
[30] D. Endler, M. Collier, Hacking Exposed VoIP: Voice Over IP Security Se-crets & Solutions, McGraw-Hill Professional Publishing, 2007.
[31] M. Seshadri, S. Machiraju, A. Sridharan, J. Bolot, C. Faloutsos, J. Leskove, Mobile call graphs: beyond power-law and lognormal distributions, in: Pro-ceedings of the 14th ACM SIGKDD international conference on Knowledge discovery and data mining, ACM, 2008, pp. 596–604.
[32] N. dHeureuse, S. Tartarelli, S. Niccolini, Analyzing telemarketer behavior in massive telecom data records, in: Trustworthy Internet, Springer, 2011, pp. 261–271.