Analysis of the job satisfaction regarding the
type of contract
Student: Qian Yi Solé Miralles
Tutor: Dr. Vicente Royuela
Bachelor’s degree in International Business
University of Barcelona
ABSTRACT
During the last years, it has increased the awareness and study for the living conditions of the population. Given the actual relevance of jobs in our daily life, it is interesting to analyze the factors that affect people job satisfaction. The chosen variable of interest of this study, is the type of contract a person holds. Recently, has been started a decline in permanent jobs and has increased the casual and temporary jobs. This change has involved more economic instability, a decrease in the labor security, and an increase in the unemployment rate, so that, changes that could affect people job satisfaction. For this reason, this research is aimed to study the relationship between job satisfaction and the type of contract a person is holding.
The empirical analysis is based on the Living Conditions Survey (LCS). The period studied, covers the years 2013 and 2018, since 2013 was the first year, in which this survey included the welfare modules which involved job satisfaction data.
Keywords: Job satisfaction, temporary contract, empirical analysis, job quality, Living Conditions Survey.
RESUM
Durant els últims anys, ha incrementat l’interès i l’estudi sobre les condicions de vida de la població. Donada la rellevància de la feina en el dia a dia, és interesant analitzar els factors que afecten la satisfacció laboral de la població. La variable d’interès escollida per aquest estudi, fa referencia al tipus de contracte. Recentment, ha esdevingut una disminució en els contractes permanents, i per tant, han incrementat els contractes temporal o casual. Aquest canvi ha comportat més inestabilitat econòmica, una disminució de la seguretat laboral, i un incrementat de la taxa d’atur, per tant, tots ells, canvis que afecten a la satisfacció laboral del treballador. Per aquesta raó, aquest estudi, té com a objectiu, estudiar la relació entre la satisfacció laboral i el tipus de contracte dels individus.
L’anàlisi empíric es basa en l’enquesta de condicions de vida. El període estudiat, comprèn els anys 2013 i 2018, ja que el 2013 va ser el primer any en que l’enquesta de condicions de vida, va incloure els mòduls de benestar, i per tant, informació respecte la satisfacció laboral. Paraules Clau: Satisfacció laboral, contracte temporal, estudi empíric, qualitat laboral, Enquesta de les condicions de vida.
TABLE OF CONTENTS
INTRODUCTION ... 6
I. LITERATURE REVIEW ... 10
1. Job Satisfaction ... 10
2. Temporary Contracts ... 12
3. Job Satisfaction & Temporary contracts ... 12
4. Other factors influencing Job Satisfaction ... 13
II. CASE OF STUDY ... 14
III. EMPIRICAL MODEL ... 20
IV. RESULTS ... 22 1. OLS Regressions ... 22 2. Logit regressions ... 30 3. Regions Regressions ... 38 V. CONCLUSIONS ... 40 VI. BIBLIOGRAPHY... 42 APPENDIX I ... 45
LIST OF FIGURES
Figure 1. Decline in full-time, permanent jobs during 2011-2014………...…….8
Figure 2. Histogram of the job satisfaction……….……….18
Figure 3. Correlation matrix of the explanatory variables………...……19
LIST OF TABLES Table 1. Descriptive statistics……….……….………16
Table 2. Summarize of the continuous variables……….………....18
Table 3. OLS regressions……….……….………..…….27
Table 4. Goodness of fit in the Logit regression: Job satisfaction >7……….……..…31
Table 5. Goodness of fit in the Logit regression: Job satisfaction >8……….……..…31
Table 6. Logit regressions……….……….……….…….35
ACRONYMS
BLUE Best Linear Unbiased Estimator ECV Encuesta Condiciones de Vida
EU European Union
INE Instituto Nacional de Estadística JS Job Satisfaction
LSC Living Conditions Survey
OECD Organization for Economic Co-operation and Development OLS Ordinary Least Square
R1 Regression 1
R2 Regression 2
R3 Regression 3
R4 Regression 4
SHRM Society for Humans Recource Management TC Temporary Contract
INTRODUCTION
Nowadays, given the actual implication of jobs in the workplace, it is interesting to analyze the factors that affect people job satisfaction. Therefore, the aim of this research is to study the impact of job quality associated with one determinant variable in this research as is the type of contract. It is done by means of the data provided from the Living conditions survey (LCS) and which we have analyzed. In addition, different regressions are estimated including different variables significant for the study.
Job satisfaction research is not a newness subject, actually began to be studied between the late 1920 and early 1930 as a consequence of the Great Depression which involved a huge industrial employment crisis in many countries included Spain. To begin to talk about this subject, according to the Cambridge Dictionary, “job satisfaction refers to the feeling of pleasure and achievement that you experience in your job when you know that your work is worth doing, or the degree to which your work gives you this feeling”. It is not necessary a self-satisfaction, happiness or self-contentment but the satisfaction of the job done. Further, Job quality is also defined as the extent to which a job has work and employment-related factors that foster beneficial outcomes for the employee, particularly psychological well- being, physical well-being and positive attitudes such as job satisfaction (Reister et al., 1993) (Green, 2006). As human beings, our jobs take a big part in our daily lives, as we spend most of our day working. So, it’s crucial to be comfortable in what we are doing. In this aspect, the company takes the main role and responsibility in order to be able to change the attitude of employees, giving them the opportunity to focus on their work. Further, enabling them to take their own responsibilities and empowering to execute them using their knowledge and skills. It is also important to motivate them to go further and achieve their goals learning new techniques, technologies and fulfill their best resources to reach the excellence. As Alfred Marshall said, “the most valuable of all capital is that invested in human being”. By human being, it is interpretated and considerate a satisfied worker, since if an employee is not satisfied with its job, by no means is going to give good results. In addition, it is considered two different resources in a company, the group of human beings, and the group of assets. Although, the later in isolation of the former is useless.
Some studies document the importance of the different type of contracts related to a job, but very little research has been done to analyze whether this affects the work experience and so the job satisfaction. The signed employment contract can provide and give the feeling of job security for both parties, but specially for the employee. In this study, it is going to work and analyze two different types of contracts. Permanent and temporal ones. While there may be advantages in both, on sight, the benefits of being a permanent employee seems to far outweigh, the benefits of temporal contracts.
The encouragement of this research is to try to give answer and know how it influences us, the fact that every time, more and more permanent jobs are taking less part in our society. It has to be taken into consideration that our work represents an investment of time of the majority of our hours in a day. For this reason, it could be interesting to study if the job quality could be somehow, significant related to the type of contract of the individual, in order to be able to study this subject and understand more details about it.
It could be a big path for the society in order to be the most comfortable as possible in our day-to-day life and duties. Both Satisfaction and Dissatisfaction are clue variables as can gives us information whether to go to one direction or completely the opposite.
In the last years it has been started a decline in permanent jobs and has increased the casual and part-time jobs (Upgrading or Polarisation? Long-Term and Global Shifts in the
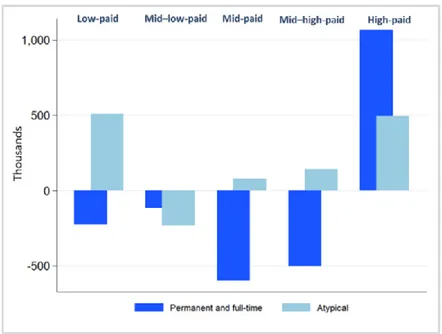
Employment Structure: European Jobs Monitor 2015 | Eurofound, n.d.). Figure 1 shown
below, displays the employment development between 2011 and 2014. It gives us a graphical view about the change in type of contracts that people have been experienced during the last years, and so, gives a motivation and research to study it. In the X-axis, we find categorized the different amounts of money paid for jobs, and in the Y-axis, thousands of people.
Focusing on the dark blue bar charts, which describe the permanent and full-time jobs, it can be noticed that this type of contracts only increases in the highest-paid jobs, in fact is increasingly the privilege of employees in the best-paid jobs. In the rest of categories, declines the number of employees in this type of contract.
On the other hand, observing the light blue bar chart, meaning atypical/casual contracts, increases in all except one category. The high-paid and low-paid categories are the ones in which increases the most, with around a growth of 500 thousands of people. In the low-paid category, some of the jobs increased are, retail worker, cleaner, and helper. Needless to say, that specially in this category, in which people’s pays are the lowest, if you add the working conditions of a casual contract, it results in more uncertainty and poor living conditions.
However, as commented before, some of the high-paid jobs also had switched into atypical contracts, as teaching professionals and health professionals.
Since the recession, a new pattern was discovered in which male implication in part-time jobs was increased. Some years ago, four out of five part-time workers in the EU were women, but in recent years we have filled the gap in between the gender inequality in this type of contracts. Overall, we can see a clear upward trend in the number of casual contracts, while the number of permanent contracts seems to drop year by year.
Figure 1. Decline in full-time, permanent jobs during 2011-2014.
Source: data from 2015 annual report of the European Jobs Monitor
(Decline in Full-Time, Permanent Jobs | Eurofound, n.d.)
Job dissatisfaction results, in addition to a disappointed worker, in a decrease in job security and a worsen labor climate. For instance, keeping workers happy helps strengthen a company in many ways (Villanova University). Even though, there is not a scientific evidence that relate the job satisfaction and productivity, as there are so many other factors that influence this variable, it is still in research as it is an important concern by managers.
As mentioned before, in all developed economies “standard employment” is declining in favor of “flexible” employment (Gutiérrez-Barbarrusa, 2016). By flexible contracts, could be fixed term, par-time, casual and contracts for detailed tasks. This tendency has been confirmed by the OECD (2004-09 and 2013). The decline of permanent contracts makes us question which is the purpose to this change and the direction that will take in some daily aspects.
To rate the job quality, is to ask a subjective question that depends on the job quality perception of each individual. It is the employee that defines the quality of its jobs. This paper is an empirical study done in Spain, a country member of the European Union and with one of the highest temporary employment rates of all the OECD countries.
The findings regarding this study, has confirmed the initial assumptions made concerning the relationship between job satisfaction and the type of contract an individual hold. Through the empirical research done, it has been demonstrating the negative association between the type of contract and job satisfaction. Individuals holding a temporary contract
respect those holding a permanent contract, decrease their job satisfaction. Moreover, it has been analyzed several variables, in order to be aware of its relationship with job satisfaction.
The remainder of the paper is structured as follows. Section I review the literature of the different topics of this paperwork, with other studies and research been used. Section II describes the data. Section III introduces the empirical approach assessed. Section IV presents and discusses the results. Section V summarizes and concludes the research.
I would like to give thanks to my family, for supporting me all these years I have been studying. Last but not least, I would like to express gratitude to my tutor, Vicente Royuela, for all the support received and feedbacks that has provided to me.
I.
LITERATURE REVIEW
1. Job Satisfaction
Keeping employees satisfied with their jobs gives positive outcomes for both the worker and the company.
There are different factors of workplace satisfaction that are key aspects for workers to be glad and happy with their work. According to the SHRM report (Society for Human Resource Management, 2012), employees rate respectful treatment of all employees as the most important factor in job satisfaction. Next, trust is the second factor people give value in order to achieve a job satisfaction. It may be as a result of the workplace uncertainty in the years following the Great Recession, as trust between the workers and managers was a highly relevant satisfaction factor. Then, workplaces free of stress, bad languages, bad mood and discriminatory practices generates a positive and healthy environment for everyone. At the same time, one of the variables that I am interested to research in this study, is the type of contract that involves the career path. This variable is important as employees are more likely to do a good performance, or improvement, when they can see an established upward path. This means a better position, conditions, maybe earn a higher wage and be able to take more responsibilities and decisions. Last but not least, it is considered that pay and benefits are not the top one for a satisfied employee, but it has to be taken into consideration. Generally, makes the worker feel valued and gives them the confidence of their work placement decision. They don’t have to look for any other work with more suitable conditions. (How Important Is Job
Satisfaction in Today’s Workplace? | Villanova University, n.d.)
For instance, there are also positive points for which companies must take into account employee satisfaction. Therefore, the turnover is an expensive cost for the human resources department. Keeping the same working group, saves you training costs or tension between the work members and gives you a nice work environment, so is easier to recruit quality talent and save money. It should be noted that satisfied employees are much less likely to leave the company. In addition, despite the job position and pay grade, employees who report high job satisfaction tend to achieve higher productivity. Then, keeping employees glad and satisfied can result to higher sales, lower costs and stronger bottom line. Finally, it can be achieved the loyalty from the worker if it’s satisfied, and this means that the employee will support the mission and work hard to achieve the goals set.
On average, a person from the OECD country spends 37 hours a week working. In fact, the majority of an adult life is participating in an paid job (Job Quality - OECD, n.d.). This is the reason why it is considered so important to be comfortable and satisfied with your job, as it is present in an important part of your life. As we have mentioned before in the introduction, the job quality or job satisfaction is considered a subjective question, as each person can have
a different perspective of it and so, the answer may not be qualified as to other people. However, the OECD has developed a general framework to measure and rate the quality of jobs. This classification considers three objective and measurable dimensions. The first one, is the earnings quality. It measures the significance that the quantity of earning supposes for the worker. The second is the labor market security and capture those aspects of the economy security of the country, that involves the job demand, the unemployment rate, risk of job loss and its economic cost for workers. In this case, temporary jobs could be disadvantaged since usually contribute to more instability and stages of unemployment. Finally, the last dimension is the quality of the working environment. In this categorization, is not considered an economic aspect, instead, the relationships between workers, the level of tension and working-time arrangements.
Health has been a variable taken into consideration during the last century in order to also choose the type of contract that employees wanted to perform (Bardasi & Francesconi, 2004). This selection may depend on the individuals’ preferences, expectations and financial constraints. It is considered one persons’ health, the family health and well-being. Some people prefer to have an “stable job” which gives you stability in your life and a periodic source of income, but which requires a full-time attachment to the labor market. Other people, like the youngest, oldest and women with young children, may prefer more flexible work arrangement assuming an inferior income and more insecurity. Hakim (1997) argues that most part-time workers (especially women) prefer to work part time rather than full time. From a theoretical point of view, it cannot be affirmed the direct relationship between the different types of contracts and the level of health. Nevertheless, health and well-being preferences have influenced workers in choosing, if possible, their type of employment contract. This has helped the change that we are experiencing nowadays respect the different type of contracts.
A classic reference for the research of job satisfaction is Locke (1976), who had interest in workers’ subjective well-being back to the ideas of scientific management and fatigue reduction at the beginning of the century (Clark, 1996). Lock defines job satisfaction as a “pleasurable or positive emotional state resulting from the appraisal of one’s job or job experiences”. The formulation of the job satisfaction by Locke was the sum of the discrepancies between how much of a certain value aspect of working a job delivers and how much of this aspect the individual desires or expects. Even though, this valuations and numbers of the different aspects of the job are given subjective by the person itself. Then, job satisfaction may increase from improvements in the objective aspects of the job, from reduced expectations or desires, or equally from a realignment of values so that dissatisfying aspects of the job are downplayed, while the more pleasant get stronger.
2. Temporary Contracts
Moreover, one really interesting study, Temporary jobs: stepping stones or dead ends (Booth et al., 2002) stated that temporary contracts are considered an important component in order to get a labor market flexibility. It gives companies the flexibility of contracting employees for short-term periods or seasons in which they need more help or have more activity. Temporary workers can be laid off without incurring statutory redundancy payments or restrictions imposed by employment rights legislation. This explains the huge growth in temporary jobs in France, Italy and Spain. These are countries which are characterized by high levels of employment protection. The proportion of temporary workers in these three countries doubled between 1985 and 1997 (Booth et al., 2002). In divergence, in the United States and the United Kingdom, the proportion of people working with fixed-term contracts has been relatively low and stable as they have relatively little employment protection regulation.
In some countries temporary jobs may be “stepping stones” to permanent jobs, but in others are “dead ends” that don’t take further. The results of Temporary jobs: stepping stones or dead ends (Booth et al., 2002), confirmed that temporary jobs, in Spain, are generally not desirable when compared to permanent employment. These types of jobs usually pay less, are associated with lower satisfaction in some situations and provide less work-related training. However, they found evidence that fixed-term contracts (not included casual and seasonal employment) are actually effective stepping-stones to permanent jobs. It is also interesting, they found that women who start with fixed-term job and then move to permanent work fully catch up to the wage level earned by women who start in permanent work. In spite of this, men suffer a long-term 5% loss in wages from starting with a fixed-term contract.
3. Job Satisfaction & Temporary contracts
To conclude with the literature revision, it has to be remarked the Ada Ferrer-i-Carbonell and Bernard M.S. van Praag paper: Insecurity in the Labor market: The impact of the type of contract on job satisfaction in Spain and the Netherlands (Ferrer-i-Carbonell & van Praag, 2006). This paper from 2006, is one of the few researches done regarding the job satisfaction in terms of types of contracts. It is quite similar to the one it will be assessed in this project, as the main purpose is resemblant. Despite this, Ferrer and van Praag paper, examined two countries that differ respect the labor market, Spain and the Netherlands. It is offered a cross-country comparison between these two countries as Spain presents the highest rates for temporary contracts and in contrast, the Netherlands, has one of the lowest. This analysis also helps to understand the large differences inside European labor markets, and so, how is affecting Job satisfaction of its individuals.
The results were quite clear. Consistent with intuition, in Spain, it was found that the negative coefficient of having a fixed-term contract for more than a year was lower than the negative coefficient of having a fixed-term contract for less than a year. For instance, the coefficient of casual or other type of contracts was the largest of all. However, in the Netherlands, the effect was only negative for fixed-term contracts of a year or less compared to a permanent contract. Individuals with a fixed-term contract for more than a year or a casual contract do not seem to be less satisfied with their job than individuals with permanent contracts. The results indicated that in Spain, contracts other than permanent were clearly less preferred, but in the Netherlands, this was not the case. Maybe workers choose voluntarily for a non-permanent contract (as it is mentioned before, for health, well-being…) or whether temporary contracts are used as a transitory situation preceding a more stable contract.
4. Other factors influencing Job Satisfaction
Finally, the study includes a considerable number of variables that have been considered important for the research. In previous studies as in (Ferrer-i-Carbonell & van Praag, 2006) and (Society for Human Resource Management, 2012) , it has been seen that there are different factors of individual variables as age, gender, nationality, level of education, and others that are the basis in order to know and study the relationship between job satisfaction and type of contract. The main variable, that is the variable of interest for our study, is the contract type of the employee since this will determine the relation with all the other variables and with the job satisfaction level. In addition, it has been also included the number of children and number of adults in the household, and the marital status for the individual, since this different situation could differentiate somehow the level of satisfaction in the individual’s job.
Income pay and job/employment security are important dimensions to take into consideration of job quality, as gives flexibility in relation to both working hours and demand. David Holman’s article about the job quality (Holman, 2013) analyses differences in patterns of job quality among 27 European countries, using also data from the European Working Conditions Survey, but from 2005. Other contextual variables that must be included to acquire more information of the sample we are studying, and so delimitating the individuals we are working with, are, the region of Spain where the individuals come from and the urban specifications where they live, as a big populated area or sparsely area. Then, the year of the survey is also included, having answers of years 2013 and 2018.
Finally, other variables associated straightforward with work, are the total number of hours working in a week and the sector in which the individuals are working. In addition, a variable for the firm size, to distinguish in different ranges in order to evaluate the divergences. Eventually, also one significant variable is the one regarding the occupation of the individual, it includes the differentiation between part-time or full-time work, as in the paper of (Bardasi & Francesconi, 2004).
II.
CASE OF STUDY
The analysis of this project is made and investigate with the Living Conditions Survey (LCS) (ECV Módulo 2013 and 2018, 2018). The LCS is a data treasure, it includes an extended number of the individual’s data across time in all the countries of the European Union. In order to assess the data of the survey of this research, it has been used the data downloaded from the
Instituto Nacional de Estadística (INE).
This survey has been carried out since 2004 with the aim of having a reference source on statistics for all European Union countries. However, our analysis comprises the years 2013 and 2018 as 2013 was the first year that this survey included the welfare modules which include job satisfaction data. Initially, individuals are asked to determinate the average satisfaction with their current job, it has been counted off in a scale from 0 to 10, meaning 0 not at all satisfied, and 10 fully satisfied.
One of the main variables to study is the type of contract of the individual. It has been differentiated between temporal contract and fixed contract. Another variable is the type of employment of the individual. It has been differentiated between work_1 and work_2. Initially, the main difference was that the first one included only people who was either working, unemployed, retired and other type of economic activity and work_2, was more specific as specified a little bit more, and included also people who couldn’t work, housework workers, military duties … However, the sample has been restricted and eventually only people employed from variable work_1 and, working full time, or part time in the variable work_2 has been taken into consideration from the sample of individuals, and so all other variables including different types of occupations have been discarded. We end up with a sample of approximately 29,151 individuals from Spain.
It has been created Table 1 with a summary of the descriptive statistics for the individuals from Spain. This table presents the average job satisfaction in a scale from 0 to 10 for the individual’s categories considered appropriate for the research, during the 2013 and 2018 years. If we look at the sex, the last column shows that more men participated in the sample with a 53.27% respect the 46.73% of participation of women. We don’t see much difference between men and women, being 7.35 points of job satisfaction for women and 7.37 points for men in 2018. Going through nationality, the majority of the individuals of the sample are from Spain, with an 88.62%. The least satisfied are individuals from the rest of the world with 6.7 points in 2013 and an increase to 7.05 in the 2018. Even though, it could be considered not much significant since this group of individuals only cover 8.57% of the sample. If we point the region of the individuals, looking at the 2018 the most satisfied group are from Ciudad
Autonóma de Melilla with a score of 8.23 points of job satisfaction in 2018. The second most
the least satisfied regions indicate to be Región de Murcia, with an average job satisfaction of 7.15 in 2013 and 6.97 in 2018. Especially, in Murcia, seems that the job satisfaction has decreased between the two years, which is not common in most of the other regions. The rest of the regions don’t have many variations, as the satisfaction points goes between 7 to 7.7 in 2018. Regarding the Urban zone living, in 2018 the middle zone achieved the highest job satisfaction with 7.43 points respect the 6.96 from 2013. 49.31% of individuals from the sample are from a heavily populated area which achieve the lowest job satisfaction score with 7.31 points in 2018 and 6.98 respectively in 2013. It is interesting to observe that when looking to the results for the marital status, the highest score in job satisfaction is from widow individuals (7.44 in 2018 and 7.09 in 2013). In the same classification it is also interesting to see that 77.89% of the individuals of the sample are classified as single, and only 0.44% married.
Regarding the variable for employment, the job satisfaction score has grown from 2013 to 2018, being 6.97 points and 7.34 respectively. The employed population approximately holds a 77.89% of the sample. Then, having a look in the differentiation between working full time and part time, people working full time, seem to be more satisfied presenting 7.45 points in 2018, respect those working part time who achieved 6.79 points also in 2018. A 70.33% individuals of the sample stated to work full time and 13.27% part time.
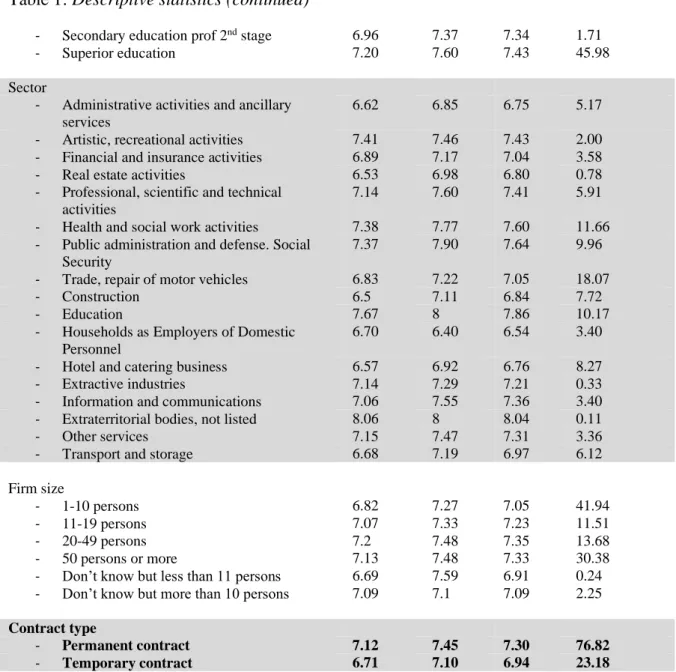
Moving to education, it is showed an increase of the job satisfaction as the individual has more education. In 2013 people with primary education achieved 6.79 points of job satisfaction unlike individuals with superior education achieved 7.20 points. Regarding the sector working of the individual, the education and extraterritorial bodies sectors are the ones achieving the highest points of job satisfaction with 8 points in 2018, holding a 10.17% and a 0.11% respectively. Then, also regarding the sector, the lowest job satisfaction is from the households as employers of domestic personnel with 6.40 points in 2018. Having a look in the firm size variable, individuals from firms of 20-49 persons give on average 7.48 points of job satisfaction. Those individuals who are indecisive with the number of persons in their company give the highest score (7.59 points in “don’t know but less than 11 persons”) and the lowest (7.10 points in “don’t know but more than 10 persons”). One of the most relevant variables studying, and the variable of interest of this study, is the type of contract the individual holds. 76.82% holds a permanent contract and 23.18% a temporary contract. Those individuals with a permanent contract are more satisfied, with 7.45 points of job satisfaction in 2018 respect 7.12 in 2013, compared those who have a temporary contract, with 7.10 points in 2018 respect 6.71 in 2013.
In general, in all the variables, it can be seen that quite all if not all the variables increase the job satisfaction in 2018 respect the 2013 year.
Table 1
Descriptive statistics
Mean Job Satisfaction Sample composition 2013 2018 TOTAL % Sex - female 7.05 7.35 7.21 46.73 - male 6.94 7.37 7.18 53.27 Nationality - Spain 7.02 7.4 7.23 88.62 - EU 27 6.72 7.17 6.98 2.81 - Rest of the world 6.7 7.05 6.94 8.57 Region - Andalucía 7.07 7.2 7.14 9.47 - Aragón 7.22 7.54 7.38 4.32 - Canarias 7.04 7.82 7.45 3.57 - Cantabria 7.03 7.52 7.34 2.74 - Castilla y León 6.61 7.37 7 6.10 - Castilla-La Mancha 7.22 7.43 7.33 4.31 - Catalunya 7 7.37 7.26 17.29 - Ciudad Autónoma de Ceuta 7.45 7.53 7.49 1.02 - Ciudad Autónoma de Melilla 7.26 8.23 7.8 1.13 - Comunidad Floral de Navarra 7.16 7.29 7.22 3.29 - Comunidad Valenciana 7.1 7.46 7.27 7.18 - Comunidad de Madrid 6.84 7.13 6.99 10.52 - Extremadura 7.11 7.55 7.35 3.35 - Galicia 6.42 7.43 6.94 6.07 - Illes Balears 7.35 7.69 7.51 3.25 - La Rioja 7.04 7.3 7.18 3.14 - País Vasco 6.94 7.13 7.04 5.88 - Principado de Asturias 6.86 7.33 7.12 3.34 - Región de Murcia 7.15 6.97 7.05 4.04 Urban
- Sparsely populated area 7.03 7.38 7.22 27.49 - Middle zone 6.96 7.43 7.23 23.19 - Heavily populated area 6.98 7.31 7.17 49.32 Marital status - Married 6.17 6.27 6.23 0.44 - Separated 7.5 7.36 7.41 0.12 - Single 6.97 7.34 7.17 77.89 - Widow 7.09 7.44 7.29 21.56 Work 2 - Full-time work 7.13 7.45 7.13 70.33 - Part-time work 6.56 6.79 6.67 13.27 Education - Primary education 6.79 6.82 6.81 6.60 - Secondary education 1st stage 6.90 7.10 7.01 23.54
Table 1: Descriptive statistics (continued)
- Secondary education prof 2nd stage 6.96 7.37 7.34 1.71
- Superior education 7.20 7.60 7.43 45.98 Sector
- Administrative activities and ancillary services
6.62 6.85 6.75 5.17 - Artistic, recreational activities 7.41 7.46 7.43 2.00 - Financial and insurance activities 6.89 7.17 7.04 3.58 - Real estate activities 6.53 6.98 6.80 0.78 - Professional, scientific and technical
activities
7.14 7.60 7.41 5.91 - Health and social work activities 7.38 7.77 7.60 11.66 - Public administration and defense. Social
Security
7.37 7.90 7.64 9.96 - Trade, repair of motor vehicles 6.83 7.22 7.05 18.07 - Construction 6.5 7.11 6.84 7.72 - Education 7.67 8 7.86 10.17 - Households as Employers of Domestic
Personnel
6.70 6.40 6.54 3.40 - Hotel and catering business 6.57 6.92 6.76 8.27 - Extractive industries 7.14 7.29 7.21 0.33 - Information and communications 7.06 7.55 7.36 3.40 - Extraterritorial bodies, not listed 8.06 8 8.04 0.11 - Other services 7.15 7.47 7.31 3.36 - Transport and storage 6.68 7.19 6.97 6.12 Firm size
- 1-10 persons 6.82 7.27 7.05 41.94 - 11-19 persons 7.07 7.33 7.23 11.51 - 20-49 persons 7.2 7.48 7.35 13.68 - 50 persons or more 7.13 7.48 7.33 30.38 - Don’t know but less than 11 persons 6.69 7.59 6.91 0.24 - Don’t know but more than 10 persons 7.09 7.1 7.09 2.25
Contract type
- Permanent contract 7.12 7.45 7.30 76.82
- Temporary contract 6.71 7.10 6.94 23.18
Source: own elaboration with data from the Living Conditions Survey (LCS) (ECV Módulo 2013 and 2018, 2018).
In the Table 2, it is shown some data of the continuous variables of the study. The first variable, Age of the individuals, displays a mean of 36 years with a standard deviation of 17 years. The third quartile indicate that 75% of individuals have less than 50 years. Regarding the number of children in the household, per average, the individuals who asked the survey to live with 1 child. The variable includes from 1 child to 7 children in the same house. On the other hand, talking about the number of adults in the household, the mean is of 3, and the standard deviation of this variable is of 1 adult. Then, concerning the Household income, per average the individuals who asked the survey, earn 38,569.78 euros. It is remarkable the maximum earnings recorded which is of 317,832 euros, which is considerable above the mean. It can be seen in the third quartile, that 75% of individuals earn less than 48,662 euros. It occurs
the same with the variable regarding the hours worked per week. While the mean is 37.7 hours, which is the standard hours everybody works, the maximum hours listed is 99 hours. Finally, analyzing the job satisfaction variable, the job satisfaction mean is of 7.21 points with a standard deviation of 1.83 points, which can be considerate quite high. As mentioned before, the individuals are able to answer in a scale between 0 to 10.
Table 2
Summarize of the continuous variables
Variable Mean Std. Dev Min Max Q1 Q2 Q3 Correlation with JS Age 36 17 0 82 25 40 50 -0.018 Number of Children 1 1 0 7 0 1 2 0.0189 Number of Adults 3 1 1 11 3 3 4 0.0067 Household Income 38,569.78 23,110.8 -30,875.94 317,832 23,246 34,078 48,662 0.1281 Hours Working 37.7 8.83 1 99 36 40 40 0.0719 Job Satisfaction 7.21 1.83 0 10 6 8 8 1
Source: own elaboration with data from the Living Conditions Survey (LCS) (ECV Módulo 2013 and 2018, 2018).
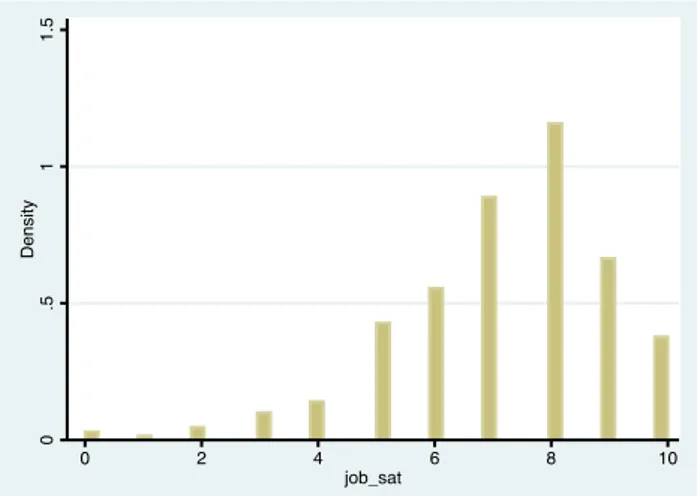
Analyzing the histogram exhibited down below regarding the job satisfaction of individuals who asked the survey, presents a Normal distribution. The highest peak of the histogram represents the location of the mode of the data set, in this case it is in 8 points of job satisfaction. Individuals most answered as their job satisfaction values are between 7 to 9, as are presented as the most frequent. The minimum value is of individuals who answered having a job satisfaction of 1 point, followed to 0 and 2 points.
Figure 2. Histogram of the job satisfaction
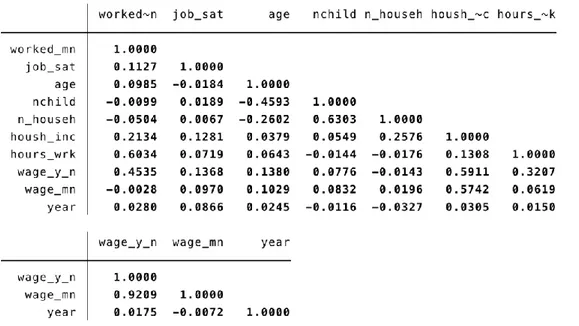
Figure 3. Correlation matrix of the explanatory variables (see Appendix I).
It has been computed a correlation matrix attached in the Appendix. That one may quantify the relationship between the variables of the sample, it has been assessed the correlation matrix with the Pearson Correlation Coefficient method, that measures the linear association between two variables. When two independent variables are highly correlated results in a problem known as multicollinearity, and this would not make reliable the data obtained from the regressions of the variables and could affect the precision (i.e., the standard errors) of estimated coefficients obtained by OLS (Morrow-Howell, 1994). In reality, it is possible that the variables that we may want to include in our regression present a strong correlation between them, because they are related elements or simply because they are capturing similar things.
There is always some degree of correlation between the explanatory variables included in the same regression, but the important is to know which values could be excessive, and so, would imply that our estimates are too imprecise, which invalidate statistical inference from our model (Gunst & Webster, 1975). The correlation matrix gives values between -1 and 1. The interpretation of this values, is consistent as, -1 corresponds to perfect negative linear correlation, 0 to no linear correlation and 1 to perfect positive linear correlation.
At first, the correlation matrix doesn’t present values excessive near to 1, which would indicate perfect positive correlation between the variables, so multicollinearity problems are not found either satisfied.
As it can be observed, the correlation between the variable months worked and job satisfaction is of 0.1127, which indicates that they are not at all related since the number is really near to 0. The variable that can be observed to be most related with job satisfaction is the variable associated with the year’s earnings of the individual, which its correlation is of 0.1368, even though is quite low. A negative correlation between two variables is for example between the variable regarding age and number of adults in a household, as more age of the individual implies that generally, there are less adults in a house. This negative correlation between the two variables is of -0.2602. It has to take into account that there are not many significant negative correlations as the majority of the values are near the 0.
On the other hand, one of the most correlated variables are the number of adults in a household and number of children in a household, as more adults in the living are highly associated with more children with a correlation of 0.6303. Then, it is not surprising that the variables age and number of children in the household are negative correlated, since if there are more children in the house, the age of the individual is lower. The negative correlation is of -0.4593. Finally, some other variables that seem to have no linear correlation between them or very low, can be for example, the number of adults in a household and the months worked in a year, the number of children in a household and the job satisfaction, and the age and number of hours working in a week. It’s surprising the fact that the job satisfaction and the number of hours working a week seem to have a poor linear correlation between them.
III. EMPIRICAL MODEL
In the Living conditions survey, respondents have to answer different questions. One of them is their satisfaction with their job or main activity. The answer to this question is what is often called subjective or self-reported job satisfaction (JS). The respondents can provide their numerical answer in a scale from 0 to 10, meaning 0 not at all satisfied, and 10 fully satisfied. The aim of this study is determining the relationship between individual self-reported Job Satisfaction (JS) and the type of contract. In order to study it, the following equation is proposed:
𝐽𝑆 = 𝛽0+ ∑ 𝛽𝑘𝑥𝑘+ 𝛿𝑇𝐶 + 𝜀, 𝐾
𝑘=1
(Equation 1)
The dummy variable TC indicates the type of contract. In this paper research, it has been distinguished between two different types: permanent contract and temporal contract.
Furthermore, the regression includes an extent of different characteristics about the individual, other contextual variables and aspects related to the job. For instance, the age, gender, working hours, net month salary, the level of education, if she/he has a partner or whether the sector it works. Besides, other variables will be included in equation (1). They are described by the vector x. It is interesting to include these variables in order to allow to control different characteristics other than the “type of contract”. The argumentation is because these other characteristics, which also affect job satisfaction, may be correlated with the type of contract. Then, the type of contract would pick up other effects if these variables were not included separately. As there can be positive relationships between a variable and type of contract, there is also the possibility of negative ones. So, equation (1) will also include variables with the possibility of negative relationships. For example, the sector working. Finally, equation (1) includes the usual error term, indicating the unobservable part.
There are various econometric techniques in order to do the research. Balancing and comparing the advantages and shortcomings of the various econometric techniques, it will be regress job satisfaction by means of the Ordinary Least Squares (OLS) approach. Regarding the econometrics research’s and studies, the ordinary Least Squares method is broad used to estimate the parameter of a linear regression model. This method reduces and minimizes the sum of the squared errors (which can be define as the difference between the observed values and predicted values). According to Gauss-Markov Theorem, OLS estimator is Best Linear Unbiased Estimator (BLUE). This test is computationally practicable and is possible to easily be used while doing any econometrics test, however it is important to know the underlying assumptions of OLS regressions. If the OLS assumptions are used wrongly, with lack of
knowledge, it could give incorrect results for the econometric test studied. It is easy to find irregularities and violations in the OLS assumptions, but the important is to detect it and solve it in order to achieve reliable results in the econometric research and regressions.
Regarding the OLS method application technique, in our study, the hypothetical variable, which is the job satisfaction, is an ordinal variable. Because, it can only be estimated the Job satisfaction- indifference curves (Ferrer-i-Carbonell & van Praag, 2006). In order to operationalize the frequency distribution of the job satisfaction variable, it has to be done under the standard normal distribution. For the purpose of reporting the discreteness of the observations, it is represented each response category i by its conditional mean of job satisfaction (JSi). As mentioned in (Ferrer-i-Carbonell & van Praag, 2006), the OLS method yields approximately the same estimates as the ordered Probit, except for the multiplying factor due to a different normalization. In both methods, the significance of the estimates results, assessed by the corresponding t-values, is practically the same. So, the sense of preferring the OLS method to ordered Probit is that it can be used simple OLS techniques without any loss of information.
Eventually, as we have pointed out before, asking for the satisfaction with the job is a subjective question to answer, as it depends on the job quality perception of each individual. For instance, a person that answer 8 points of job satisfaction, is not double satisfied with its’ job than a person that answers 4 point. For this reason, it will be useful to use an ordinary least squares (OLS) regression, as it is also for standard empirical analysis models to regress subjective well-being (Van Praag, Ferrer-i-Carbonell and Frijters, 2003). Moreover, OLS is assessed assuming that the cardinality results of the study of job satisfaction as a measurement of subjective well-being, has no impact on the results when comparing variables (Ferrer-i-Carbonell and Frijters, 2004). For two decades, when it started the economics of happiness research, many articles have been using the OLS technique to assess the satisfaction across countries (e.g. see: Easterlin (1974, 1995, 2013), Oswald (1997), Micklewrighrt and Stewart (1999), Kenny (1999) and Di Tella et al. (2002).
IV.
RESULTS
1. OLS Regressions
In the table 3, presented below, we have data on job satisfaction for a sample of Spanish individuals. There are displayed four different regression computed using the Ordinary Least Square method. In each regression added, it has also been attached more variables that may change the coefficients of our study as there might be more relevant, and simply more information to explain.
In the first regression, it has been included the following individual characteristics: Job satisfaction as the dependent variable, and as the independent variables, type of contract, age of the individual, sex, nation, marital status, level of education and finally, number of children and adults in the household. Next, in the second regression, in addition to the variables included in the first regression, it has also been included other contextual variables, as the different Spanish regions, the year and the urban variable to specify in the size of the living zone. Then, in the third regression, it has been added a variable concerning the type of work and working conditions, work2, regarding if working part-time or full-time. Finally, in the fourth and last regression computed, it has also been included variables concerning straightforward the work, as the sector the employee is working, the variable describing the firm size, and the number of hours working of the individual.
First of all, it has to be defined the reference categories for all the dummy variables that have been omitted in this regression.
Contract type: Fix contract Sex: Men
Nation: Spain
Marital status: Married Education: Primary education Urban: Medium zone
Region: Andalucía Year: 2013
Work2: Full-time work
Sector: Administrative activities and other auxiliary services Firm size: 1 to 10 persons
At the end of the table 3, there is information about the R-squared test. The 𝑅2 is an indicator that explains the fraction of variability of the outcome (Y) that can be explained by all X variables. The results are between 0-1. 1 Indicates perfect adjustment and 0 no statistical relationship. In this case, as it has been added new regressions that includes more variables in each one, the 𝑅2 has progressively increased. The first regression explains a 2% of the job
satisfaction with all the variables that include. The second, explains a 3.7%, the third a 4.5% and finally, the fourth regression, with all the variables that include, can explain a 6.9% of the job satisfaction. Therefore, the best regression of the four, is the fourth, since it is the one that includes the variables that explain more of our dependent variable, the job satisfaction. For this reason, the coefficients that are more interesting for our study are the ones that are in the fourth regression.
Now, it is going to analyze each variable in order to see the fluctuations and differences in the average job satisfaction of individuals answering the sample.
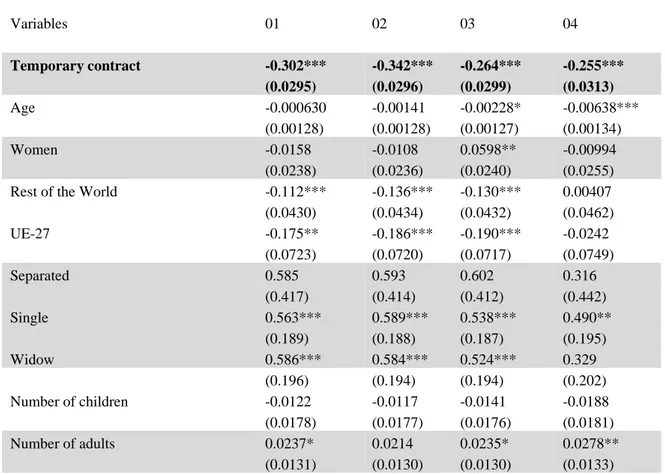
First of all, the dummy variable for the distinguish between employees with a permanent contract or a temporary one, is the variable of interest for the study as will give direct information and data for the main question of the research. For individuals having a temporary contract relatively to those having a permanent contract, the job satisfaction decreases 0.255 points in the fourth regression, which is the one that give us the best information. This coefficient is giving us the difference in job satisfaction in-between the two types of contracts. As mentioned in the Table 2, the standard deviation for the variable job satisfaction is of 1.83. This indicates us the general dispersion in the job satisfaction of the individuals from the sample. So, if computing 0.255/1.83 = 0.1393, indicate us that the variable concerning the type of contract is able to explain a 14% from the 1.83 points of general dispersion in the job satisfaction between the individuals.
Also analyzing the age variable, it can be seen in the fourth regression, as the individual increase 1 year, the job satisfaction increases 0.0063 points.
Going through the sex variable, in the fourth regression, which is the one showing more reliable information, and in which the sector variable, firm size and number of hours working variable are finally included, the coefficient is negative, and so, women compared to men have a lower job satisfaction of 0.009 points. The coefficient is very low, so it is not much significant.
Moreover, looking at the fourth regression of the nationality variable, it can be seen that individuals from the category, Rest of the world, compared to the reference category of Spanish individuals, increase their job satisfaction in 0.004 points. Respect the individuals from the UE-27, they decrease their job satisfaction respect the reference category which are Spanish individuals in 0.02 points.
Regarding the coefficients showed in the fourth regressions about the marital status of the individuals, separated people increase their job satisfaction respect the reference category of married ones, in 0.316 points, which is quite significant. Then, single individuals also increase their job satisfaction respect individuals who are married in 0.49 points. It is surprisingly that
as well, widow people increase their job satisfaction respect married individuals in 0.329 points.
Analyzing the number of children variable, in all the regressions an increase of one child in the household, also decreases the job satisfaction of the individual, in a very similar coefficient. As it can be seen, in the second regression the decrease in job satisfaction when increasing one child in the family, is of 0.011 points, compared to the decrease in 0.018 points in the fourth regression. In the case of the number of adults, the fourth regressions are similar, and for the increase of an adult in the household, there is also a little increase in the job satisfaction points. The higher increase is in the fourth regression in which for an increase of an adult in the household, the increase in job satisfaction is of 0.027 points.
Going through the education variable, it can be seen in the fourth regression that individuals with secondary education in the first stage compared to the reference category which are individuals with primary education, increase their job satisfaction in 0.05 points. Moreover, it is relevant to emphasize that individuals with secondary education in the second stage respect individuals with primary education decrease their job satisfaction in 0.017 points. Then, individuals with secondary education prof in second stage, also respect individuals with primary education, in this case, increase the job satisfaction in 0.15 points. To conclude with the education variables, people with superior education respect those having a primary education, also increase their job satisfaction in 0.159 points, which shows to be quite significant with a probability of error of 1%.
For instance, the urban variable analyzing the area where the individual lives, and so the degree of population, is a variable which is already not represented in the first regression, as it is included in the second regression and so, third and fourth regressions. Analyzing the fourth regression, which is the regression of our interest, people living in a heavily populated are taking into account the reference category, which is individuals living in a medium populated area, decrease their job satisfaction in 0.09 points. This coefficient shows to be quite significant, as the probability of error is 1%, marked with three stars. On the other hand, people living in sparsely populated areas respect medium areas, increase their job satisfaction in 0.015 points.
Examining the region of the individual, the region we have to take into reference is
Andalucía. It will be only analyzed the fourth regression, as described before, is the one that
can give more information and precise data. The region of Aragón, taking into reference
Andalucía, individuals increase their job satisfaction in 0.2 points, which is quite significant.
In the region of Canarias, compared to Andalucía, the job satisfaction of Canarian individuals also increases in a similar coefficient, that is 0.26 points. Looking in the Cantabria region, the job satisfaction also increases respect Andalucía, in 0.08 points, which is quite lower.
Next, in Castilla y León, the coefficient is different, as this region, compared to the reference category, which is Andalucía, the job satisfaction decreases in 0.17 points, which is quite significant.
In Castilla la Mancha, the coefficient for the fourth regression is also positive, which indicates that individuals living in this region respect individuals living in Andalucía, increase their job satisfaction, specifically in 0.09 points.
In Catalunya, the increase of job satisfaction respect Andalucía, is quite low, as it is of 0.002 points. On the contrary, the increase in job satisfaction in the Ciudad Autónoma de Ceuta, is quite high, since in this region, compared to Andalucía, the job satisfaction increases in 0.31 points in the fourth regression. It is even higher, and maybe the highest increase respect the reference category, in the Ciudad Autónoma de Melilla, as in this region, compared to
Andalucía, the job satisfaction increases in 0.56 points. It is not surprisingly, since as show in
the Table 1, this region has also the higher job satisfaction mean of all other regions.
Then, in the Comunidad Floral de Navarra, the job satisfaction compared to the region of
Andalucía decreases in 0.07 points in the fourth regression. Moreover, in the Comunidad Valenciana, the job satisfaction of this region compared to the one of the reference categories,
which is Andalucía, increases in 0.11 points.
In the Comunidad de Madrid, compared to Andalucía, the job satisfaction decreases in 0.22 points. Next, in Extremadura, there is a positive increase in the job satisfaction respect in
Andalucía, of 0.11 points in the fourth regression, being the other regressions very similar. In
addition, in Galicia, compared to the reference region of Andalucía, the job satisfaction decreases in 0.23 points.
Then, in the region of the Illes Balears, the three regressions, shows a similar coefficient, for example, in the second regression, the Illes Balears, respect to Andalucía increase the job satisfaction in 0.27 points, compared to the increase of 0.30 points in the fourth regression.
Further, in La Rioja, the job satisfaction increase respect in Andalucía is quite low, since in the third regression is of 0.044 points. Finally, to join the final three communities that present similar coefficients, the País Vasco and Principado de Asturias decrease the job satisfaction respect Andalucía, and Región de Murcia increase the job satisfaction respect the reference category. Even though, the three have fairly low coefficient which make it low significant. The job satisfaction of these three communities, decrease and increase respectively in 0.09, 0.04 and 0.02 points.
Evaluating the job satisfaction results in 2013 and 2018, individuals who answered the survey in 2018 respect the answers in the year 2013, increased their job satisfaction in 0.33 points, which can be considered significant.
Moving through the work2 variable, which includes the sub-categories of having a part-time work and having a full-part-time work, it is the only new variable included in the third
regression. Part-time works respect the reference category, which is Full-time works, decrease significantly their job satisfaction in 0.47 points in the fourth regression.
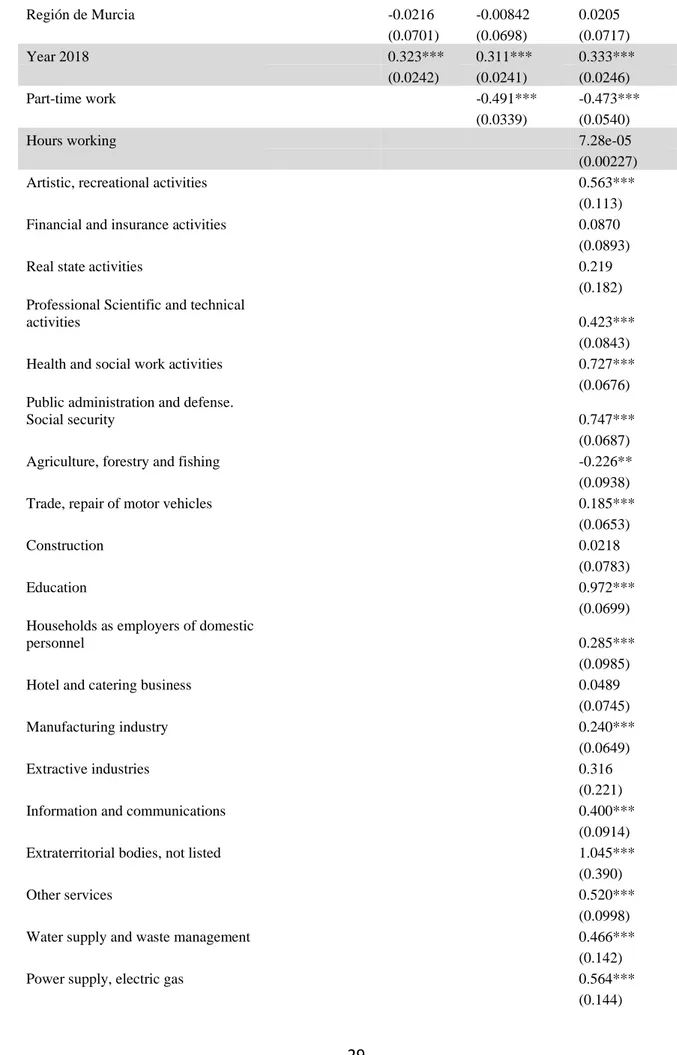
In the same way, regarding the variable describing the total amount of hours worked in a week by the individual, for the increase of one hour of working, the increase in job satisfaction is of 7.28e-05, which is 0.0000728 points. As the number is very small, it is considered little significant for the analysis in job satisfaction. The reason for the low significance, could be that the information concerning this variable, hours working, is already collected in the variable work2, regarding working part-time or full-time. The variable for the hours worked of the employee is the first variable added in the fourth regression.
In this new regression it is also added the sector in which the employee works. Taking as the reference category the Administrative activities and other auxiliary services, the artistic and recreational activities sector increases the job satisfaction in 0.56 points, which can be considered quite significant, with a probability of error of 1%. Moving to the Financial and insurance sector, compared to the reference category, also increases, but not as much as the previous sector, the job satisfaction in 0.08 points. The sector comprising the real estate activities, respect the administrative sector increases the job satisfaction in 0.219 points. Then, regarding the professional, scientific and technical activities, compared to the reference category also increases the job satisfaction by 0.42 points.
Another two sectors that increases the job satisfaction considerably with quite the same coefficient, respect the administrative sector, are the health and social work sector and the public administration and defense sector, with an increase of 0.727 and 0.747 points respectively. Moreover, the increase is fairly significant compared to the reference category. Not all the sectors present a better job satisfaction respect the administrative sector, and it is the case of the Agriculture, forestry and fishing sector, which decrease their job satisfaction in 0.22 points respect the reference category.
In addition, the sector of trade, repair of motor vehicles also increases the job satisfaction in 0.18 points respect the reference category. Moreover, the construction sector increases their job satisfaction respect the administrative sector in 0.02 points, even though is not quite significant the coefficient.
The education sector and the extraterritorial bodies sector, both have a huge increase in job satisfaction in comparison to the administrative sector of 0.97 and 1.04 points respectively. In the same way, there are two sectors with similar increase in job satisfaction respect the administrative sector and are the households as employers of domestic personnel sector, the transport and storage sector and the manufacturing industry with an increase of 0.28, 0.22 and 0.24 points equivalently. Moreover, the hotel and catering business sector also increases the job satisfaction respect the reference category in 0.04 points. Then, regarding the extractive industries, also increase the job satisfaction respect the reference category in 0.31 points. Finally, the information and communications sector, other services sectors, water supply and
waste management sector and power supply, electric gas sector, all increase their job satisfaction respect the administrative activities and other auxiliary services sector in quite similar coefficients that 0.4, 0.52, 0.46 and 0.56 points respectively.
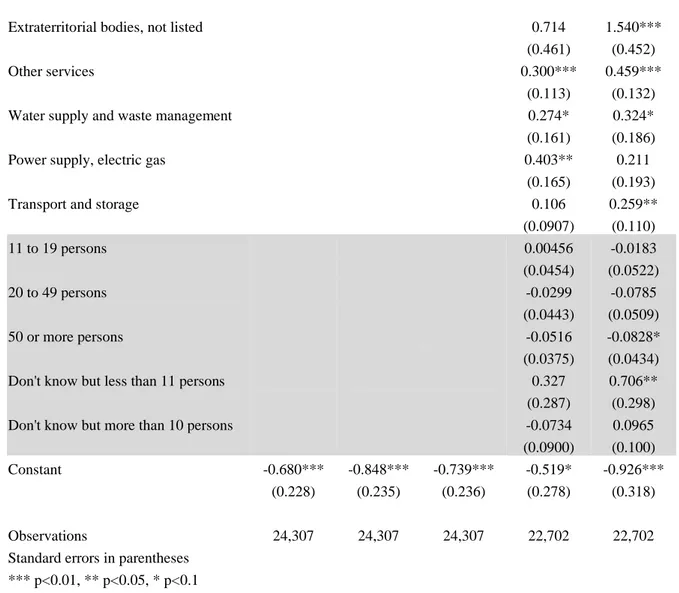
Finally, and to conclude with the analysis of the OLS method regressions, it is analyzed the different sizes of the companies in which individuals answering the survey are working. Individuals working in companies of 11 to 19 persons, respect the reference category of companies of 1-10 persons, obtain a decrease in job satisfaction of 0.008 points, which is not very significant. Then, companies with 20-49 persons, also compared to the reference category of companies with 1-10 employees, increase their job satisfaction in 0.024 points. In addition, companies with 50 or more employees obtain a decrease of 0.008 points of job satisfaction, which is very similar as the first coefficient for companies of 11 to 19 persons. At last, the individuals answering that they didn’t know the number of employees of its company, but though that were less than 11, increase the job satisfaction respect the reference category in 0.013 points. On the other side, those individuals who also didn’t know how many employees were in their company, but answered more than 10, decrease their job satisfaction respect the companies with 1-10 employees in 0.12 points.
Table 3 OLS regressions Variables 01 02 03 04 Temporary contract -0.302*** -0.342*** -0.264*** -0.255*** (0.0295) (0.0296) (0.0299) (0.0313) Age -0.000630 -0.00141 -0.00228* -0.00638*** (0.00128) (0.00128) (0.00127) (0.00134) Women -0.0158 -0.0108 0.0598** -0.00994 (0.0238) (0.0236) (0.0240) (0.0255) Rest of the World -0.112*** -0.136*** -0.130*** 0.00407 (0.0430) (0.0434) (0.0432) (0.0462) UE-27 -0.175** -0.186*** -0.190*** -0.0242 (0.0723) (0.0720) (0.0717) (0.0749) Separated 0.585 0.593 0.602 0.316 (0.417) (0.414) (0.412) (0.442) Single 0.563*** 0.589*** 0.538*** 0.490** (0.189) (0.188) (0.187) (0.195) Widow 0.586*** 0.584*** 0.524*** 0.329 (0.196) (0.194) (0.194) (0.202) Number of children -0.0122 -0.0117 -0.0141 -0.0188 (0.0178) (0.0177) (0.0176) (0.0181) Number of adults 0.0237* 0.0214 0.0235* 0.0278** (0.0131) (0.0130) (0.0130) (0.0133)
Table 3. OLS regressions (Continued)
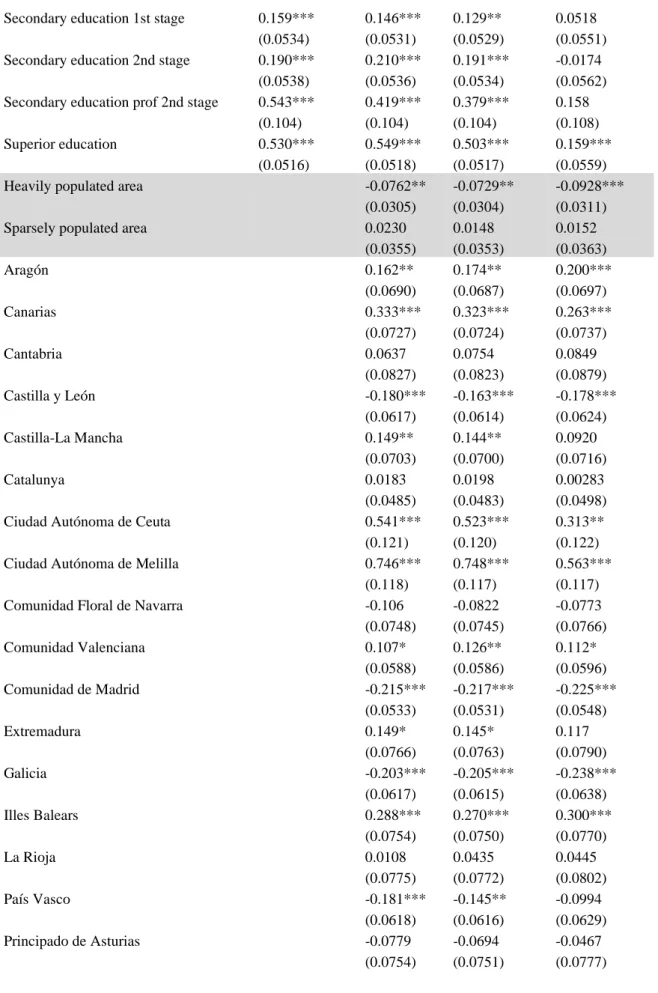
Secondary education 1st stage 0.159*** 0.146*** 0.129** 0.0518 (0.0534) (0.0531) (0.0529) (0.0551) Secondary education 2nd stage 0.190*** 0.210*** 0.191*** -0.0174
(0.0538) (0.0536) (0.0534) (0.0562) Secondary education prof 2nd stage 0.543*** 0.419*** 0.379*** 0.158
(0.104) (0.104) (0.104) (0.108) Superior education 0.530*** 0.549*** 0.503*** 0.159***
(0.0516) (0.0518) (0.0517) (0.0559) Heavily populated area -0.0762** -0.0729** -0.0928***
(0.0305) (0.0304) (0.0311) Sparsely populated area 0.0230 0.0148 0.0152
(0.0355) (0.0353) (0.0363) Aragón 0.162** 0.174** 0.200*** (0.0690) (0.0687) (0.0697) Canarias 0.333*** 0.323*** 0.263*** (0.0727) (0.0724) (0.0737) Cantabria 0.0637 0.0754 0.0849 (0.0827) (0.0823) (0.0879) Castilla y León -0.180*** -0.163*** -0.178*** (0.0617) (0.0614) (0.0624) Castilla-La Mancha 0.149** 0.144** 0.0920 (0.0703) (0.0700) (0.0716) Catalunya 0.0183 0.0198 0.00283 (0.0485) (0.0483) (0.0498) Ciudad Autónoma de Ceuta 0.541*** 0.523*** 0.313** (0.121) (0.120) (0.122) Ciudad Autónoma de Melilla 0.746*** 0.748*** 0.563***
(0.118) (0.117) (0.117) Comunidad Floral de Navarra -0.106 -0.0822 -0.0773 (0.0748) (0.0745) (0.0766) Comunidad Valenciana 0.107* 0.126** 0.112* (0.0588) (0.0586) (0.0596) Comunidad de Madrid -0.215*** -0.217*** -0.225*** (0.0533) (0.0531) (0.0548) Extremadura 0.149* 0.145* 0.117 (0.0766) (0.0763) (0.0790) Galicia -0.203*** -0.205*** -0.238*** (0.0617) (0.0615) (0.0638) Illes Balears 0.288*** 0.270*** 0.300*** (0.0754) (0.0750) (0.0770) La Rioja 0.0108 0.0435 0.0445 (0.0775) (0.0772) (0.0802) País Vasco -0.181*** -0.145** -0.0994 (0.0618) (0.0616) (0.0629) Principado de Asturias -0.0779 -0.0694 -0.0467 (0.0754) (0.0751) (0.0777)
Table 3. OLS regressions (Continued) Región de Murcia -0.0216 -0.00842 0.0205 (0.0701) (0.0698) (0.0717) Year 2018 0.323*** 0.311*** 0.333*** (0.0242) (0.0241) (0.0246) Part-time work -0.491*** -0.473*** (0.0339) (0.0540)
Hours working 7.28e-05
(0.00227) Artistic, recreational activities 0.563***
(0.113) Financial and insurance activities 0.0870
(0.0893) Real state activities 0.219
(0.182) Professional Scientific and technical
activities 0.423***
(0.0843) Health and social work activities 0.727***
(0.0676) Public administration and defense.
Social security 0.747***
(0.0687) Agriculture, forestry and fishing -0.226** (0.0938) Trade, repair of motor vehicles 0.185***
(0.0653)
Construction 0.0218
(0.0783)
Education 0.972***
(0.0699) Households as employers of domestic
personnel 0.285***
(0.0985) Hotel and catering business 0.0489
(0.0745) Manufacturing industry 0.240***
(0.0649) Extractive industries 0.316
(0.221) Information and communications 0.400***
(0.0914) Extraterritorial bodies, not listed 1.045***
(0.390)
Other services 0.520***
(0.0998) Water supply and waste management 0.466***
(0.142) Power supply, electric gas 0.564***
Table 3. OLS regressions (Continued)
Transport and storage 0.225*** (0.0796) 11 a 19 persons -0.00870 (0.0397) 20 a 49 persons 0.0244 (0.0384) 50 or more persons -0.00865 (0.0327) Don't know but less than 11 persons 0.0139
(0.274) Don't know but more than 10 persons -0.124
(0.0789) Constant 6.366*** 6.233*** 6.367*** 6.459***
(0.209) (0.211) (0.210) (0.242) Observations 23,752 23,752 23,752 22,237 R-squared 0.019 0.037 0.045 0.069 Standard errors in parentheses
*** p<0.01, ** p<0.05, * p<0.1
Source: own elaboration with data from the Living Conditions Survey (LCS) (ECV Módulo 2013 and 2018, 2018).
2. Logit regressions
Additionally, it has been assessed some more regressions using the LOGIT method. Using this method, the variable regarding job satisfaction answered by the individuals, has been differentiated and transformed into a discrete or dummy variable.
From the formula of the Logistic distribution function, it is easy to see that the probability that Y (our dependent variable, job satisfaction) is equal to 1 is always positive and comprised between 0 and 1 by definition.
The predicted probability is a non-linear function of the explanatory variables. So, the estimated coefficient from a Logit model cannot be directly interpreted as changes in the probability that Y is equal to 1, while it is only possible to interpret the sign (i.e. direction of the effect).
The variables included in the first four regressions, are the same as in the OLS table. Concerning the fifth regression, it includes all the variables as in the fourth regression. The reference categories are the same as in the OLS regressions.
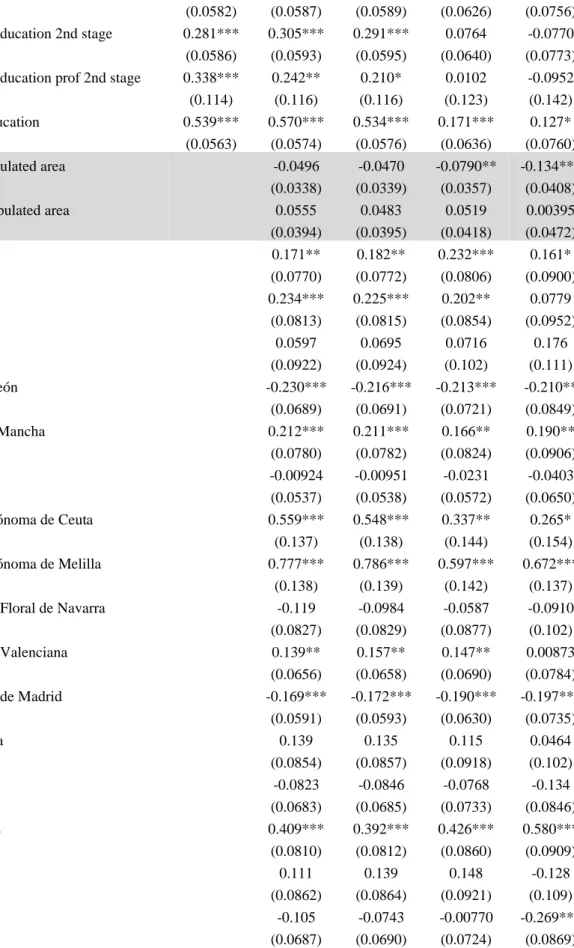
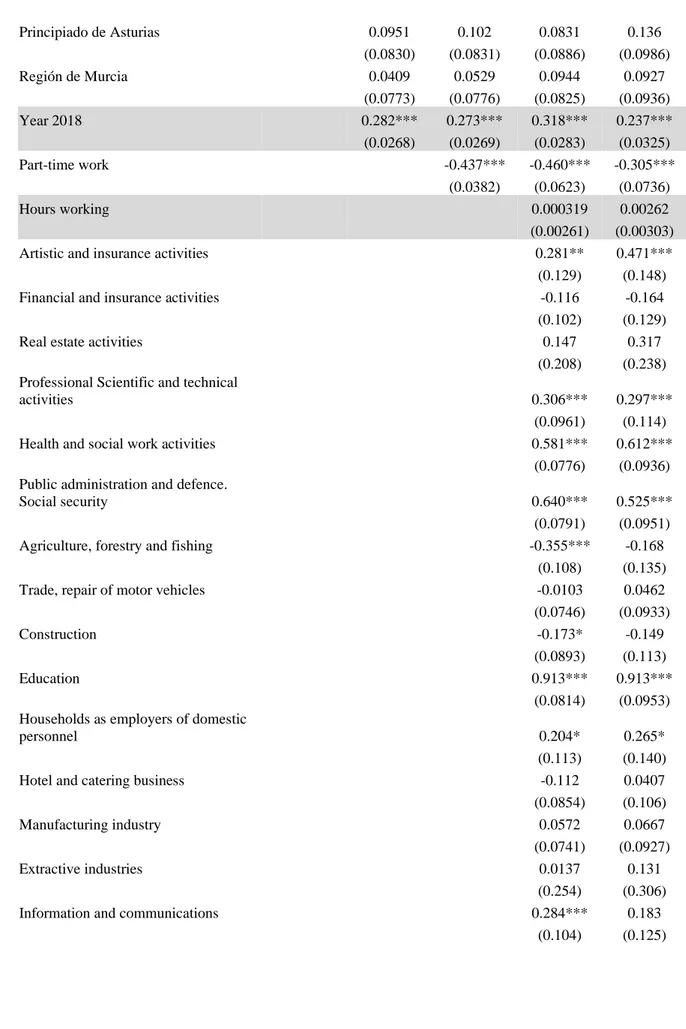
The table 4 displayed below, contain 5 different regressions. The first four, belong to the Logit regressions computed taking into consideration that job satisfaction is bigger than 7