VOLUME85, NUMBER7 P H Y S I C A L R E V I E W L E T T E R S 14 AUGUST2000
Alignment of Hexatic Langmuir Monolayers under Shear
Jordi Ignés-Mullol and Daniel K. SchwartzDepartment of Chemistry, Tulane University, New Orleans, Louisiana 70118
(Received 10 April 2000)
We have studied the structural changes that fatty acid monolayers in the Ov phase undergo when a simple shear flow is imposed. A strong coupling is revealed by the changes in domain structure that are observable using Brewster angle microscopy, suggesting the possibility of shear alignment. The depen-dence of the alignment on the molecular polar tilt proves that the mechanism is different than in nematic liquid crystals. We argue that the degenerate lattice symmetry lines of the underlying pseudohexago-nal lattice align in the flow direction, and we explain the observed alignment angle using geometrical arguments.
PACS numbers: 68.15. + e, 83.20.Hn, 83.70.Jr The structure of fatty acid monolayers at the air-water interface has been extensively studied during the past decade [1]. Of particular interest are the condensed phases in which the polar heads form a hexatic lattice, while the alkane tails that protrude into the vapor phase may be either tilted or untilted with respect to the surface normal. Observation using Bewster angle microscopy (BAM) [2 – 4] of the tilted phases shows a polydomain structure revealing long range correlations of orientational order. X-ray diffraction studies have contributed to the significant knowledge we currently have concerning the nature of both the ordering of the underlying lattice and the ordering of the alkane tails (polar tilt, azimuth 兾lattice-bond coupling, and herringbone order).
Classical studies of flow in monolayers focused on mea-surements of effective surface viscosity, with little knowl-edge of the effects of flow on the underlying structure. The use of recent observation techniques, such as BAM, has allowed a closer analysis of the coupling between an imposed flow and the structure of Langmuir monolayers. In recent work, Fuller’s group [5 – 7] showed that a strong coupling between external flow and the orientational or-der of the monolayer may exist, and that the nature of the coupling differs for different tilted condensed phases. By studying the L2, L02, and S phases, they found that, depend-ing on the phase, the initially rich mosaic structure may be annealed by a shear flow, so that only two reflectivities are observed, which they relate to the tails being oriented either along or against the flow. They also reported the observation of propagating fronts across domains, which they described as shear bands. By analogy with some bulk nematic phases [9], it is generally expected that the chains forming the Langmuir monolayer may align under shear like a two-dimensional nematic.
In this Letter, we present experiments where shear is applied to monolayers in the Ov phase [4], which is char-acterized by a lack of herringbone order in the backbone plane, by an azimuthal orientation towards next-nearest-neighbor (NNN) bonds, and by a lattice structure that is hexagonal in the plane perpendicular to the tails [1,8]. We find that these monolayers undergo a flow-induced
align-ment of the alkane tails, observable at all surface pressures and for a wide range of shear rates. Our analysis reveals that the nature of this alignment is different from the order-ing of a two-dimensional nematic, and that it results from the alignment of the underlying hexagonal lattice.
Experiment. — Monolayers of docosanoic acid, CH3 -共CH2兲20-COOH (C22), are prepared by depositing drops of a chloroform solution on the surface of pure water (Millipore Milli-Q UV1), contained in a custom-built Teflon Langmuir trough kept at 46±C 6 1±C throughout the experiments. The surface pressure of the monolayer is monitored using a filter paper Wilhelmy plate and an R&K electrobalance. Shearing of the monolayer is achieved by rotating in opposite directions two Buna-N O-rings, stretched between a pair of Delrin-covered stainless steel rods. This generates a simple shear flow in a region about 6.5 cm long and 1.5 cm wide. The bands remain submerged in the water subphase while the monolayer is deposited at the interface, and are subsequently lifted until they pierce through the monolayer. The observation of the monolayer is performed by means of a custom-built BAM [10]. We send p-polarized light at Brewster angle for water (⯝53±) and set the analyzer at 60±to the right of the incidence plane, which maximizes the contrast in the images. This is the configuration that we use throughout our experiments. Images from a CCD video camera are recorded on video tape for digital analysis.
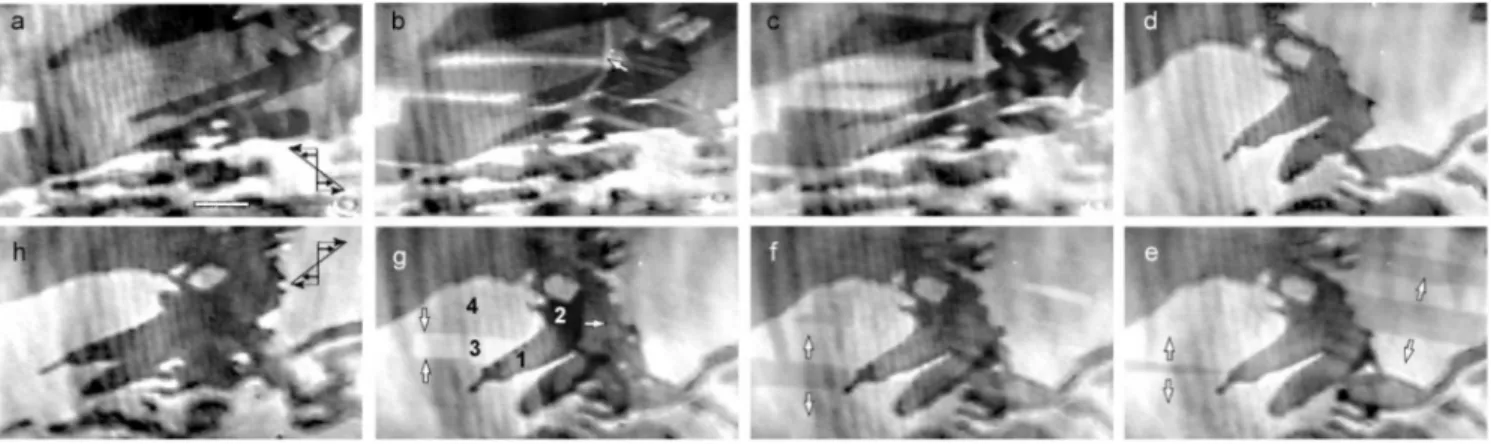
Upon formation of the monolayer in the Ov phase, a mosaic structure with domains of different reflectivities is observed [see Fig. 1(a)]. Since the polar tilt of the tails is uniform throughout the monolayer, different domains are characterized by different tilt azimuths [6].
Almost immediately after the shear flow is estab-lished, a sudden transition takes place: straight fronts nucleate and propagate across all domains until only two highly contrasted values of the reflectivity are observed [Fig. 1(b) – 1(d)]. These fronts are either horizontal or vertical, at 45±relative to the principal axes of the strain tensor [see Fig. 1(b)]. An analysis of the correspon-dence between observed reflectivity and tilt azimuth in our configuration [6] shows that the highest contrast is 1476 0031-9007兾00兾85(7)兾1476(4)$15.00 © 2000 The American Physical Society
VOLUME85, NUMBER7 P H Y S I C A L R E V I E W L E T T E R S 14 AUGUST2000
FIG. 1. C22 monolayer under shear. T 苷 46±C, P苷 21 mN兾m (Ov phase), ᠨg 苷 0.2 s21. A freshly prepared monolayer
under-goes a single shear cycle. The orientation of the flow is as illustrated on frame (a) for the sequence (a) – (d), and as illustrated on frame (h) for the sequence (e) – (h). The line segment on frame (a) is 100 mm long. The elapsed times from frame (a) are 0.1 s (b), 0.2 s (c), and 5 s (d). The flow is subsequently inverted (e) – (h). The elapsed times from (e) are 0.13 s (f ), 0.23 s (g), and 0.25 s (h). On frames (e) – (g) arrows show the propagation of fronts. In (g), the four observable reflectivities are labeled. In all frames, uninteresting artifacts such as interference fringes and small illumination gradients are unavoidable.
between domains where the azimuths are parallel and antiparallel to the flow, with the ones having an azimuth of w ⯝ 90± (to the right of the laser beam) appearing dark, and domains with an azimuth w ⯝ 270±(90±to the left of the laser beam) appearing bright. Upon inversion of the flow [Fig. 1(e)] propagating fronts appear again in all the domains, both bright and dark. When the rotational component of the shear flow is clockwise (counterclock-wise), all domains are slightly darkened (brightened) by the propagating fronts. Despite these changes, the domains that were darker prior to the inversion of the flow remain also darker afterwards. As shear reversal cycles continue, so do these slight alternating changes in domain reflectivity. It is notable that the boundaries in the mosaic of domains remain roughly unaltered by these processes. The above observations are consistent with the fatty acid tails being aligned by the flow. What happens when we invert the flow, however, suggests that the domains are not aligned parallel to the velocity field, but maintain a nonzero angle with the flow.
These observations suggest that two particular values of the tilt azimuth are induced by shear in a given direction and that two different azimuthal orientations are associated with shear in the reverse direction. This is qualitatively similar to the phenomenon known as shear alignment in some bulk liquid crystals. By comparing these relative changes in reflectivity to the shape of the reflectivity curve expected for our monolayer we are able to extract mean-ingful measurements of the alignment angle.
This picture suggests that the two azimuth orientations stable for clockwise shear are w 苷 90±1 a and w苷 270±1 a (w 苷 90±2 a and w 苷 270±2 a for coun-terclockwise shear). Here, a is the alignment angle. This is compatible with the shape of the reflectivity curve (see Fig. 2). Thus, the observed reflectivities in the dark do-mains under shear correspond to an orientation with an azimuth w 苷 90±6 a, and those observed in the bright
domains correspond to an azimuth w 苷 270±6 a. On Fig. 1(g), the azimuth w 苷 90±2 a (w 苷 90±1 a) cor-respond to the reflectivity labeled R1 (R2), and the azi-muth w 苷 270±2 a (w 苷 270±1 a) correspond to the reflectivity labeled R3(R4).
In order to perform a meaningful calculation of the alignment angle, it is important to accurately determine the shape of the reflectivity curve. The reflectivity of a Lang-muir monolayer under BAM conditions can be calculated using the transfer matrix formalism [11 – 13] assuming the monolayer to be a uniaxial anisotropic medium. The length of the C22molecules (d 苷 27.5Å) and the dielectric tensor of the monolayer (e⬜ 苷 2.16 and ek苷 2.37) have been measured using multiple-angle ellipsometry [14]. The reflectivity also depends on the value of the polar tilt, which changes with the surface pressure of the monolayer.
FIG. 2. The alignment angle is estimated by fitting the reflec-tivity curve to the four reflectivities that can be extracted from a monolayer under shear, according to the model discussed in the text. The three different symbols correspond to three experi-mental realizations.
VOLUME85, NUMBER7 P H Y S I C A L R E V I E W L E T T E R S 14 AUGUST2000 The polar tilt can be related to the area per molecule of
the monolayer with the simple expression cos共u兲 苷 A0兾A [8,15], where A0 is the area per molecule at the tran-sition to the untilted phase (u0苷 0). With a combina-tion of P 2 A isotherms and optical inspeccombina-tion we have seen that, at 46±C, C22 has the L2-Ov phase transition at P1 ⯝ 13.8 mN兾m and the Ov-LS (untilted) phase transi-tion at P0 ⯝ 31.5 mN兾m. Using x-ray diffraction Durbin
et al. [8] measured the polar tilt at the L2-Ov phase tran-sition (u1) for a configuration consistent with ours (we estimate u1 ⯝ 20.8±from their data). Since the P 2 A isotherm is close to a straight line in the Ov phase, using the above information it is possible to express u as a func-tion of P.
Since we do not have an absolute calibration for the reflectivity in our images, we must find a way to relate the 8-bit gray scale images to the calculated reflectivity curve r共w兲. In general, r共w兲 must be linearly trans-formed in order to match the digitized values, i.e., R共w兲 苷
R0 1 DR r共w兲, where R0and DR are unknown constants corresponding to offset and gain of the digitization pro-cess. As we detailed above, we extract four reflectivi-ties from our images [Fig. 1(g)], which we will relate to
R共w兲 assuming that R1苷 R共90 2 a兲, etc., where a is also unknown. The three unknown parameters (a, R0, and DR) are obtained by finding the best fit of the reflectiv-ity curve to the four measured reflectivities. Performing quantitative reflectivity measurements under BAM condi-tions is a difficult task, since illumination gradients, in-terference patterns, etc., introduce a significant amount of noise. In order to add accuracy to the fitting process, we have combined reflectivity measurements obtained inde-pendently under the same experimental conditions (same a). Different sets will have different, but linearly related,
R共w兲, and we can combine them by choosing a reference
set and linearly transforming the others to best overlap the reference. The combined sets of data are used to extract a value for a as shown in Fig. 2.
Although the tilted condensed phases of fatty acid monolayers have hexatic order, one may define an in-plane director as the azimuthal tilt direction, analogous to the director field of a two-dimensional nematic. One may attempt to use conventional nematohydrodynamics to explain the phenomena described above. The coupling be-tween nematic elasticity and an external flow field is well described by the Ericksen-Leslie-Parodi theory [9]. In this model, a three-dimensional nematic is characterized by six viscosity coefficients, a1though a6. When this theory is applied to a simple shear flow, it predicts the possibility of flow alignment of the nematic director field at an angle (a) with the velocity field, tan2共a兲 苷 a3兾a2, which is typically a small angle. Using geometrical arguments, Helfrich [16] proposed a relationship between the aspect ratio of ellipsoidal nematic molecules and the ratio a3兾a2. In the limit of a circular molecule (aspect ratio equal to 1), a 苷 45±, and it decreases from that value as the
shape departs from circular. If the analogy between the in-plane projection of the fatty acid molecules and the nematic phase is valid, then we would expect a to steadily increase towards the 45±limit as P increases towards the untilted transition.
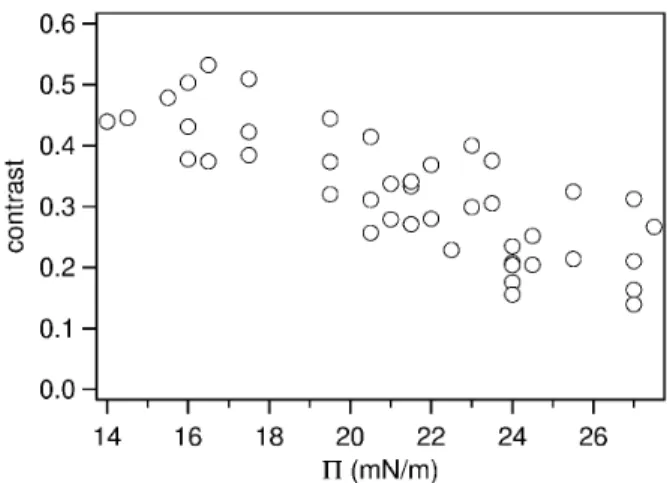
A simple analysis of the reflectivities obtained for dif-ferent P reveals a clear trend in how important the reflec-tivity change is when compared to the overall contrast of the images (see Fig. 3). We construct a contrast parame-ter comparing the average change in reflectivity that takes place in either bright or dark domains when the monolayer is under shear with the difference in reflectivity between the average of dark and the average of bright domains. The contrast parameter decreases with increasing P. Since a lower value of a would give a lower value for the contrast parameter, Fig. 3 appears to suggest that a is decreasing with increasing P. This agrees with an optical inspection of the images: the change in contrast introduced by the alignment appears less important at higher P. One might think that this trend reflects a trend in the value of a.
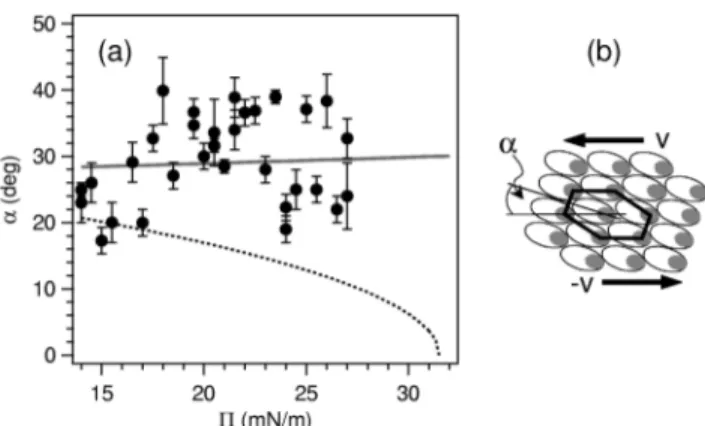
We have measured a in the manner described above (see Fig. 2) for a wide range of values for P. Loss of contrast at high P reduces our signal to noise ratio, and sets an upper limit to the pressures for which we can extract a. Our data [see Fig. 4(a)] show only a marginal departure from a constant value a ⯝ 30±, i.e., roughly independent of P, different from the trend suggested by the nematic analogy of values of a that increase towards a 苷 45±.
In order to understand these results, we must abandon the analogy with nematic liquid crystals, and analyze our experimental observations taking into account the presence of the hexatic lattice. An important feature in our experi-ments is the fact that stopping the shear flow at any time, including when the fronts are propagating (see Fig. 1), re-sults in the instantaneous configuration being frozen. The absence of relaxation implies that the monolayer is in a configuration that would be in equilibrium in the absence
FIG. 3. A contrast parameter is constructed with the four measured reflectivities, c 苷 R12R34兾共R3R42 R1R2兲, where Rab苷 jRa 2 Rbj.
VOLUME85, NUMBER7 P H Y S I C A L R E V I E W L E T T E R S 14 AUGUST2000
FIG. 4. (a) The alignment angle a as a function of the surface pressure P for Ov monolayers (≤). The solid line corresponds to a苷 arctan共cos关u共P兲兴 tan关30±兴兲. The dashed line is our es-timation of the polar tilt, u共P兲. (b) Diagram representing the projection of the fatty acid tails in Ov monolayers along the air-water interface. We assume that the lattice arranges so that the flow will be as shown by the arrows.
of shear. In the case of the Ov phase, this means that the fatty acid tails are tilted towards NNN at all times. Clearly, the only way to make this compatible with the observed changes in reflectivity (and, therefore, in tilt azimuth), is to assume that shear results in a reorganization of the hex-atic lattice. The Ov phase is characterized by hexagonal packing in the plane normal to the molecular tails [8]. The projection in the interface plane is expanded along the tilt direction of the molecules (NNN) by a factor 1兾 cos共u兲 [see Fig. 4(b)]. If the monolayer is arranged by the external shear so that one of the degenerate lattice directions aligns with the flow direction, a can be determined geometri-cally, a苷 arctan共cos关u共P兲兴 tan关30±兴兲. We have plotted this expression on Fig. 4 along with our measured values for a, and it is quite consistent with our data. The equa-tion suggests that a will approach a 苷 30±at the untilted transition point (u 苷 0), and will decrease as u increases, although this decrease is very small. A small uncertainty in the knowledge of u共P兲 will have a very small effect in the value of a determined from the above equation. Any change in u, however, will introduce roughly an equal change in the value of a determined experimentally. This
leads to significant experimental uncertainty in the value of a as reflected in Fig. 4(a).
Our experiments have shown a strong coupling between the structure of Langmuir monolayers in the Ov phase with an external shear flow, which is revealed by the change in the domain structure in BAM observations. Our quanti-tative analysis has shown that the change in structure is consistent with an alignment of the degenerate symmetry lines of the underlying molecular lattice with the flow. The alignment mechanism, therefore, is different from what is observed in nematic liquid crystals.
We thank Robijn Bruinsma for helpful discussion. This work was supported by the National Science Foundation (Grant No. CTS-9733281) and by the donors of the Petro-leum Research Fund.
[1] V. M. Kaganer, H. Möhwald, and P. Dutta, Rev. Mod. Phys. 71, 779 (1999).
[2] S. Hénon and J. Meunier, Rev. Sci. Instrum. 62,936 (1991). [3] D. Honig and D. Möbius, J. Phys. Chem. 95,4590 (1991). [4] G. A. Overbeck and D. Möbius, J. Phys. Chem. 93,2097
(1993).
[5] M. C. Friedenberg, G. B. Fuller, C. W. Frank, and C. R. Robertson, Langmuir 12,1594 (1996).
[6] T. Maruyama, G. Fuller, and C. Frank, Science 274, 233 (1996).
[7] T. Maruyama et al., Langmuir 14,1836 (1998). [8] M. K. Durbin et al., J. Phys. Chem. 98,1753 (1994). [9] P. G. De Gennes and J. Prost, The Physics of Liquid
Crys-tals (Oxford University Press, New York, 1993), 2nd ed. [10] M. L. Kurnaz and D. K. Schwartz, Phys. Rev. E 56,3378
(1997).
[11] D. W. Berreman, J. Opt. Soc. Am. 62,502 (1972). [12] D. S. Bethune, J. Opt. Soc. Am. B 8,367 (1991). [13] M.-W. Tsao, T. M. Fischer, and C. M. Knobler, Langmuir
11, 3184 (1995).
[14] M. Paudler, J. Ruths, and H. Riegler, Langmuir 8, 184 (1992).
[15] P. Tippmann-Krayer and H. Möhwald, Langmuir 7, 2303 (1991).
[16] W. Helfrich, J. Chem. Phys. 50,100 (1969).