POLITECNICO DI MILANO COMO CAMPUS
SCHOOL OF INDUSTRIAL AND INFORMATION ENGINEERING
COMPOSITE FMEA
FOR RISK ASSESSMENT IN THE CONSTRUCTION PROJECTS
BASED ON THE INTEGRATION OF THE CONVENTIONAL FMEA WITH THE METHOD OF PAIRWISE COMPARISON AND MARKOV CHAIN
A THESIS
SUBMITTED IN PARTIAL FULFILLMENT OF THE REQUIREMENTS FOR THE DEGREE OF
MASTER OF SCIENCE in
MANAGEMENT ENGINEERING by:
AHMED MOHAMED MAGED MAHMOUD AHMED supervisor
PROF. ALESSANDRO BRUN © December 2014
Dedication
This thesis is dedicated to the memory of a person who was cut from the
same cloth and who was in fact a real brother and friend,
MOHANNAD RAGAB
There are so many great times that we have had shared together and
which will never be forgotten. You are gone, but your memory will live
in my heart and mind forever.
RIP My Brother.
Abstract
Purpose: The purpose of this research is to provide risk assessment tool for the construction projects by integrating three methodologies, Failure Mode and Effective Analysis (FMEA), The Method of Pairwise Comparison, and Markov Chain.
Design/ methodology/ approach: A literature of the traditional FMEA was reviewed with the aim of demonstrating its framework, highlighting the main advantages and shortcomings, and to study the application of the FMEA in the construction domain. A new methodology named Composite Failure Mode and Effective Analysis (COMP-FMEA) has been introduced aiming at addressing the limitations of the conventional FMEA that make it inconvenient for the construction projects. The integration of the three methodologies provided an improved version of FMEA that considers wider range of criticality factors instead of the traditional three factors (Occurrence (O), Severity (S) and Detection (D)). Additionally, the proposed methodology provides long-term risk assessment using Markov Chain as a correction process for the possible inadequate evaluation during the first stage. Moreover, the interdependence effect between several failures/risks has been taken into consideration for further assessment. Afterwards a case study of a residential building was presented to validate the concept of the proposed methodology.
Findings: The results obtained confirm the capability of COMP-FMEA to provide better risk assessment for the construction projects by addressing several drawbacks of the conventional FMEA. The use of the proposed approach can support the project management team with reliable information to establish effective correction action process. Limitations: However COPM-FMEA succeed in addressing several shortcomings of the traditional FMEA and in giving better risk assessment for the construction projects, it still depends on linguistic evaluation for the criticality parameters which provides uncertainty and variety in the experts’ provided information. In addition, COMP-FMEA does not include a corrective actions process, which can be a future research to be integrated with the proposed work.
Acknowledgement
Foremost, as part of being a Muslim and part of our traditions, I would like to begin this acknowledgement with the name of Allah, the most compassionate and the most merciful. It would not have been possible to write this M.Sc. thesis without the motivation, help and support of the kind people around me, to only some of whom it is possible to give particular mention here.
Above all, I would like to thank my parents, two brothers, and my dear sister for giving me the unequivocal love and support throughout. In addition, special thanks go to my beloved grandfather Mr. Ali Ashour for his unlimited support.
None of this would have been possible without the support, guidance and patience of my advisor Professor Alessandro Brun. His guidance helped me in all the time of research and writing of this thesis. I could not have imagined having a better advisor and mentor for my M.Sc. thesis. Therefore, I would like to express my special appreciation and thanks to him, you have been a tremendous mentor for me.
It is the honor to be part of such a great university like Politecnico Di Milano; therefore, I would like to thank everyone in this beloved place, where I learned a lot. I would like also to acknowledge the financial, academic and technical support that POLIMI provided. In this occasion, I cannot forget to thank Italy for giving me the chance to live the best two years in my life on its adorable and beloved land.
Life is nothing without friendship. Therefore, I would like to thank my dear friends for supporting and encouraging me to finish my Master’s degree, especially Moataz Mahfouz, Mohamed Ragab, Ahmed Rabiee, Kholoud Mohamed, Maja Urošević, Samir Hasanov, Mahmoud Hamdy, Mohamed Hassan, Mohamed Shaaban, Omar Zaki, Mohamed Moghieb, Sayed Mohamed, Moataz Hussain, Noha Bassyouni, Dalia Elagamy, Saravana Guhan, Azin Golesorkhi, İlgen Bulbul, Mohammad Hassan, Amr Rabie and Muzzamil Hussain.
I would also like to thank Ahmed Mansi for introducing POLIMI to me and for his support. For any errors or inadequacies that may remain in this work, of course, the responsibility is entirely my own.
AHMED MAGED 13/11/2014
List of tables
Table 2-1 Traditional ratings for occurrence of a failure ... 7
Table 2-2 Traditional ratings for severity of a failure ... 8
Table 2-3 Traditional ratings for detection of a failure ... 9
Table 2-4 Format of an FMEA report. ... 14
Table 2-5 Some Risk Analysis Techniques and Risks Addressed ... 17
Table 3-1 The major shortcomings of FMEA ... 22
Table 3-2 Comparison of risk-reduction techniques ... 48
Table 3-3 classification of the risk evaluation methods in FMEA ... 53
Table 4-1 The safety factor evaluation guideline. ... 66
Table 4-2 The cost factor evaluation guideline. ... 67
Table 4-3 The time factor evaluation guideline. ... 68
Table 4-4 The scope factor evaluation guideline. ... 68
Table 4-5 Comparison matrix... 69
Table 4-6 The corresponding average random ... 70
Table 4-7 Failure modes grouping ... 71
Table 4-8 The Failure Risk Matrix ... 72
Table 4-9 Reprioritization correction factor (RCF) ... 73
Table 4-10 Interdependence Correction Factor (ICF) ... 74
Table 5-1 The defined failure modes- Residential Building Case. ... 78
Table 5-2 Risk Rating Matrix-Residential Building Case. ... 82
Table 5-3 Conventional FEMA failures grouping-Residential Building Case. ... 83
Table 5-4 Results from Risk Rating Matrix and Conventional FMEA-Residential Building Case ... 84
Table 5-5 Safety evaluation criteria-Residential Building Case. ... 90
Table 5-6 Cost evaluation criteria-Residential Building Case. ... 91
Table 5-7 Time evaluation criteria-Residential Building Case. ... 92
Table 5-8 The Pairwise Comparison-Residential Building Case. ... 92
Table 5-9 WRPN Results-Residential Building Case. ... 94
Table 5-10 Failures having (WRPN ≤200) - Residential Building Case. ... 100
Table 5-11 The failure risk matrix (F5) - Residential building Case. ... 101
Table 5-12 The failure risk matrix (F8) - Residential building Case. ... 101
Table 5-13 The failure risk matrix (F9) - Residential building Case. ... 102
Table 5-14 The failure risk matrix (F14) - Residential building Case. ... 102
Table 5-15 The failure risk matrix (F15) - Residential building Case. ... 103
Table 5-16 The failure risk matrix (F23) - Residential building Case. ... 103
Table 5-17 The failure risk matrix (F24) - Residential building Case. ... 104
Table 5-18 The failure risk matrix (F26) - Residential building Case. ... 104
Table 5-19 The failure risk matrix (F28) - Residential building Case. ... 105
Table 5-20 The failure risk matrix (F33) - Residential building Case. ... 105
Table 5-21 The failure risk matrix (F35) - Residential building Case. ... 106
Table 5-22 The failure risk matrix (F38) - Residential building Case. ... 106
Table 5-24 The failure risk matrix (F41) - Residential building Case. ... 107
Table 5-25 The One-Step Transition Matrix (F5) - Residential building Case... 108
Table 5-26 The One-Step Transition Matrix (F8) - Residential building Case... 108
Table 5-27 The One-Step Transition Matrix (F9) - Residential building Case... 109
Table 5-28 The One-Step Transition Matrix (F14) - Residential building Case. ... 109
Table 5-29 The One-Step Transition Matrix (F15) - Residential building Case. ... 110
Table 5-30 The One-Step Transition Matrix (F23) - Residential building Case. ... 110
Table 5-31 The One-Step Transition Matrix (F24) - Residential building Case. ... 111
Table 5-32 The One-Step Transition Matrix (F26) - Residential building Case. ... 111
Table 5-33 The One-Step Transition Matrix (F28) - Residential building Case. ... 112
Table 5-34 The One-Step Transition Matrix (F33) - Residential building Case. ... 112
Table 5-35 The One-Step Transition Matrix (F35) - Residential building Case. ... 113
Table 5-36 The One-Step Transition Matrix (F38) - Residential building Case. ... 113
Table 5-37 The One-Step Transition Matrix (F39) - Residential building Case. ... 114
Table 5-38 The One-Step Transition Matrix (F41) - Residential building Case. ... 114
Table 5-39 The risk distribution at the project Steady State- Residential Building Case. ... 115
Table 5-40 RCF for the failures having (WRPN≤200) - Residential Building Case. ... 116
Table 5-41 The relationship between the failures with WRPN ≤200 and the other failures- Residential Building Case. ... 117
Table 5-42 FIR and ICF for the failures having (WRPN≤200) - Residential Building Case. 120 Table 5-43The final RPN for the failures having (WRPN≤200) - Residential Building Case. 120 Table 5-44 the Final RPN- Residential Building Case. ... 121
Table 5-45 The correction factors effect- Residential Building Case. ... 131
Table 6-1 The addressed conventional FMEA shortcomings using COMP-FMEA. ... 138
List of figures
Figure 2-1 FMEA procedure (Wang, 2003) ... 15
Figure 2-2 Hierarchical structure of a system. (Hu-Chen Liu L. L.-H.-L.-C., 2011) ... 15
Figure 2-3 Administration process to inflect FMEA in a steel-frame work. (Ji-Won Song, 2007) ... 19
Figure 2-4 Elements of a building. (Chew, 2011) ... 20
Figure 3-1 Distribution of the reviewed articles (Hu-Chen Liu L. L., 2013) ... 21
Figure 3-2 Service-specific FMEA and grey relational analysis. (Y. Geum, 2011) ... 31
Figure 3-3 Overall view of the fuzzy criticality assessment system. (Peldez, 1995) ... 35
Figure 3-4 General assessment system architecture. (K. Xu, 2002) ... 36
Figure 3-5 Proposed product architecture-based framework for failure modes and effects analysis. (Bimal P. Nepal, 2008) ... 38
Figure 3-6 Framework for applying FMEA in construction using combination of Fuzzy Logic and Fuzzy (AHP) (Fayek, 2010) ... 41
Figure 3-7 Cost of faults. (Ahsen, 2008) ... 47
Figure 3-8 Risk evaluation methods in the reviewed papers. (Hu-Chen Liu L. L., 2013) ... 58
Figure 4-1 Composite FMEA framework ... 62
Figure 4-2 Typical example of FMEA hierarchy. (Chew, 2011) ... 65
Figure 4-3 Relative scale to determine the criticality factors weight (𝜶) ... 69
Figure 4-4 the Interdependencies Matrix ... 74
Figure 5-1 Residential building case hierarchical structure ... 77
Figure 5-2 Risk Rating Matrix ... 82
Figure 5-3 Risk distribution- Residential Building Case ... 127
Figure 5-4 Risk level changes from second to the third stage of COMP-FMEA- Residential Building Case. ... 131
Table of Contents
Abstract ... I Acknowledgement ... II List of tables ... III List of figures ... V Table of Contents ... VI
1 Introduction ... 1
1.1 Objectives ... 1
1.2 Research motivations... 3
2 Failure Mode and Effective Analysis (FMEA) ... 5
2.1 Introduction ... 5
2.2 FMEA- failure mode and effective analysis ... 5
2.2.1 Failure ... 6
2.2.2 Occurrence ... 7
2.2.3 Severity ... 7
2.2.4 Detection... 9
2.3 FMECA- failure modes effective and criticality analysis ... 10
2.4 Types of FMEAs and FMEA success factors ... 11
2.4.1 Types of FMEA ... 11
2.4.2 FMEA Success Factors: ... 12
2.5 FMEA procedure ... 13
2.6 FMEA in construction industry ... 16
3 FMEA Limitations... 21
3.1 FMEA shortcomings ... 21
3.2 Risk evaluation methods of FMEA ... 25
3.2.1 MCDM approaches ... 25
3.2.2 Mathematical programing approaches ... 32
3.2.3 Artificial intelligence approaches ... 34
3.2.4 Integrated approaches ... 40
3.2.5 Other approaches ... 44
3.3 Criticality analysis and findings: ... 56
3.3.1 Construction industry ... 56
3.3.3 Limitations of approaches ... 58
3.3.4 Suggestions for future researches ... 59
4 Composite FMEA for risk assessment in the construction projects ... 61
4.1 Introduction ... 61
4.2 The used methodologies ... 63
4.2.1 Pairwise Comparison ... 63
4.2.2 Markov Chain ... 64
4.3 Phase (I): Understand the system ... 64
4.4 Phase (II): The Weighted Risk Priority Number (WRPN) ... 66
4.4.1 Criticality factors selection ... 66
4.4.2 Guideline for choosing and evaluating the criticality factors ... 66
4.4.3 Pairwise Comparison and Weighted RPN ... 69
4.5 Phase (III): Correction process: ... 71
4.5.1 Reprioritization correction factor (RCF) ... 71
4.5.2 Interdependence Correction Factor (ICF) ... 73
5 Case study ... 76
5.1 Introduction ... 76
5.2 Residential building case study ... 76
5.2.1 Introduction ... 76
5.2.2 System identification ... 76
5.2.3 Failure modes identifications ... 77
5.2.4 The application of the Risk Rating Matrix ... 82
5.2.5 The application of the conventional FMEA ... 83
5.2.6 Composite FME Application ... 90
5.2.7 Criticality analysis and results ... 126
6 Conclusion ... 134
7 References ... 141
1 INTRODUCTION
1.1 OBJECTIVES
Although companies, project managers and risk engineers have defined many methodologies and application in order to assess project or system risk and to increase systems reliability and safety, it is very difficult to aver the existence of a complete tool or methodology that assure complete safety, reliability and riskless project or system. In particular, the construction projects considered as one of the most risky projects, therefore hundreds of studies have taken place trying to eliminate, mitigate or transfer the project risks. In addition, due to the especial nature of the construction projects, and the growing need of having innovative and complex projects, the risk assessment process has become more and more complex.
Therefore, the main research question of this study is:
What is the possibility to provide a risk assessment tool that can be convenient for the construction projects and at the same time avoids the complex calculations that come from complex and hazy methodologies?
The aim of the work is to in develop a new risk assessment methodology that can achieve the following objective:
Ease of understanding.
Ease of use from both managers and engineers. Considering a wider range of criticality factors.
Avoiding or at least reducing the conventional FMEA shortcomings. Considering the mutual influence between failure modes.
Providing a good level of flexibility and customization for the user.
Therefore, an integration between the conventional Failure Mode and Effective Analysis (FMEA), the method of Pairwise Comparison and the Markov Chain, has been used to create a Composite FMEA (COMP-FMEA).
A well-structured model has been created in order to assure the ease of use and understanding for the user, taking into consideration different level of users’ mentality. Moreover, the proposed methodology not only allows the user to create his own criticality factors that might affect his project, but also provides him with a guideline of the evaluation criteria. In addition, the methodology uses the Markov Chain in order to evaluate the risk level for the failures in the long-term of the project. Moreover, it also takes into consideration the effect of interdependence between different failures, which is very important to be considered in the construction projects.
Afterwards, a case study for a residential building has been presented as a sample project of how the application of the proposed methodology can take place. It allows the user to figure out not only the potential of the proposed methodology, but also how it can provide reliable and powerful information, through a real case.
1.2 RESEARCH MOTIVATIONS
“The recent trend in the construction sites is that the buildings are becoming more skyscraperalized, complicated and large in scale; the risks of accidents in construction sites are increasing as well. Compared to general industrial accident, construction accidents are relatively more frequent, as it composes the second largest reason for industrial accidents.” (Ji-Won Song, 2007). In addition, (Guikema, 2009) demonstrated that “due to the nature of the different activities involved, construction projects can be complicated and involve a number of uncertainties such as uncertainties about material delivery times and costs, task completion times and costs, and the quality of work completed by subcontractors. These uncertainties can lead to project risks and can be the cause of a construction project’s failure to achieve predefined objectives.”
Moreover, the Modernizing Construction (Report by the Comptroller and Auditor General, was published by the National Audit Office (NAO) on 11 January 2001) highlights that “73% of government projects were delivered over budget and 70% were late”.
In addition, and according to the (International Labor Organization, 2009), “Construction is one of the world’s biggest industrial sectors, including the building, civil engineering, demolition and maintenance industries. It accounts for a large proportion of GDP – 10 percent in the U.K., 17 percent in Japan, for example. In many developing countries, construction is among the fastest growing areas of the labor market, continuing to provide a traditional entry point for laborers. It is, however, one of the most dangerous industries. At least 108 thousand workers are killed on site every year, a figure that represents about 30 per cent of all occupational fatal injuries. Data from a number of industrialized countries show that construction workers are 3 to 4 times more likely than other workers to die from accidents at work. In the developing world, the risks associated with construction work may be 3 to 6 times greater. Many more workers suffer and die from occupational diseases arising from past exposure to dangerous substances, such as asbestos.”
The previous challenges were the motivation to start this research looking for creating a methodology that can provide a reliable assessment for the different types of risks associated to the construction projects.
(Masera, 1999) Mentioned that, “an FMEA technique for building construction could be the most important tool in managing quality plans to obtain a suitable and adequate and subsequently more efficient system to build in conformity with specifications.”
In addition, From the conviction that a powerful tool not only should be easy to use and understand, but also should be built based on strong foundation to have the power of solving several problems in different situation and environment. We also believe that FMEA has a very strong potential to be a powerful risk assessment tool for the construction domain.
The fundamentals of FMEA allow the user to identify and assess the failure or the risk easily by breaking down the system into sub-systems and components. However, the conventional FMEA has many criticisms; it still can provide a reliable result if a sufficient modifications and enhancements provided.
Therefore, and referring to the previous challenges, this research tried to provide an improved version on FMEA that can give a promising results by considering the construction domain requirements for a risk assessment and by eliminating or at least reducing the effect of the conventional FMEA shortcomings.
2 FAILURE MODE AND EFFECTIVE ANALYSIS (FMEA)
2.1 INTRODUCTION
This chapter attempts to describe and analyze the Failure Mode and Effective Analysis tool (FMEA) in all its parts; what is FMEA, the procedures, main limitations, the different Risk evaluation methods…etc.
2.2 FMEA- FAILURE MODE AND EFFECTIVE ANALYSIS
Failure Mode and Effective Analysis (FMEA), which also referred to Failure Mode, Effects and Criticality analysis (FMECA), is a risk assessment tool that explores, identifies, analyzing root causes, and examining the potential failures in a system, process, service or design. Moreover, it also mitigates and reduces the failures by taking the advantage of the early identifications.
Historically, “Failure Mode, Effects, and Criticality Analysis (FMECA) was first developed as a formal design methodology in the 1960s by the aerospace industry with their obvious reliability and safety requirements. Since then, it has come to be used extensively to help assure the safety and reliability of products in a wide range of industries, particularly the aerospace, automotive, nuclear, and medical technologies industries” (Peldez, 1995).
Later on, it has been recommended by international standards such as MIL-STD-1629A (U.S. Department of Defense 1980).
The National Aeronautics and Space Administration (NASA) define FMEA as a forward logic (bottom-up), tabular technique that explores the ways or modes in which each system element can fail and assesses the consequences of each of these failures. Based on their point of view, FMEA is a useful tool for cost and benefit studies to implement effective risk mitigation and countermeasure.
Within the context of the traditional FMEA, there are three main objectives, identifying potential failure modes, evaluate the causes, impacts and the effects of different component failure mode, and determine the possible actions to eliminate or to reduce the effect and the impact of each failure mode.
The degree of criticality of a failure mode is determined by calculating risk priority number (RPN).
“The purpose of FMEA is to prioritize the failure modes of the product or system in order to assign the limited resources to the most serious risk items” (Hu-Chen Liu L. L., 2013).
Generally, the RPN is an index ranges from 1 to 1,000, calculated as the product of the severity (S), occurrence (O), and detection level (D) of a failure mode.
Within traditional FMEA, a numerical scale ranging from 1 and 10 is used to represent the universe of discourse for occurrence (O), severity (S), and detection (D). Based on the values assigned to these terms, the value of the RPN is calculated, that is
RPN = O × S × D (1)
Thus, System components that are assessed to have a high RPN are assumed more critical than those with lower values.
2.2.1 Failure
The first step of implementing FMEA is to define and understand the potential failures in a system. Therefore, the definition of the failure can vary according to several factors such as, industry characteristics, the purpose of applying FMEA (design, maintenance, system development…etc.), the system type (manufacturing system or service system)…etc.
(Venky, 2003) Defined the failure as “the inability of a design or a process to perform its intended function”, (Perry, 1992) referred the failure of a project to “The lack of effective management of risk events, which often leads to overlooking of milestones and targets”. Also (Fayek, 2010) mentioned his own failure definition as “Failure is not limited to design or process weakness but can also be due to errors made during product or process use”).
On the other hand, from a project risk management perspective, failure mode refers to the “risk”, therefore, the Guide to the Project Management Body of Knowledge _PMBOK defined the risk as “an uncertain event or condition that, if it occurs, has a positive or a negative effect on at least one project objective, such as time, cost, scope or quality”
From service perspective, (Chuang, 2007) mentioned that a service failure occurs when customers’ expectations are not met while (Ronald L. Hess Jr., 2003) referred the service failure to the situation when service performance falls below a customer’s expectation.
2.2.2 Occurrence
The occurrence rating (O) is the frequency or the probability of the occurrence of the failure. (Ayyub, 2003) Defined the detection rating (D) as “a measure of the capability of the current controls.” (Peldez, 1995) Mentioned that, occurrence “is ranked according to the failure probability, which represents the relative number of failures anticipated during the design life of the item.” Table 2-1 shows the criteria used to rank the occurrence of failure effects.
Table 2-1 Traditional ratings for occurrence of a failure
(Wang, 2003), (K.S. Chin A. C., 2008), (K.S. Chin Y. W., 2009), (S.M. Seyed-Hosseini, 2006), (Y.M. Wang, 2009)
2.2.3 Severity
The severity (S) rating is used to represent the potential effects associated with the occurrence of a failure mode. “It is ranked according to the seriousness of the failure mode effect on the next higher level assembly, the system, or the user. The effects of a failure mode are normally described by the effects on the user of the product or as they would be seen by the user. For example, some common failure effects Rating Probability of occurrence Possible failure rate
10 Very high: failure is almost inevitable ≥ 1/2
9 1/3
8 High: repeated failures 1/8
7 1/20
6 Moderate: occasional failures 1/80
5 1/400
4 1/2000
3 Low: relatively few failures 1/15,000
2 1/150,000
for automobiles are excessive noise, intermittent operation, impaired control, and rough ride.” (Peldez, 1995).
Table 2-2 shows the criteria used to rank the severity of failure effects. Table 2-2 Traditional ratings for severity of a failure
(Wang, 2003), (K.S. Chin A. C., 2008), (K.S. Chin Y. W., 2009), (S.M. Seyed-Hosseini, 2006), (Y.M. Wang, 2009)
Rating Effect Severity of effect
10 Hazardous without warning
Very High severity ranking when a potential failure mode affects safe vehicle operation and/or involves noncompliance with government regulations without
warning.
9 Hazardous with warning
Very High severity ranking when a potential failure mode affects safe vehicle operation and/or involves noncompliance with government regulations with warning. 8 Very high Vehicle/item inoperable, with loss of primary function.
7 High Vehicle/item operable, but at reduced level of performance. Customer dissatisfied.
6 Moderate Vehicle/item operable, but comfort/convenience item(s) inoperable. Customer experiences discomfort.
5 Low
Vehicle/item operable, but comfort/convenience item(s) operable at reduced level of performance. Customer
experiences some Dissatisfaction.
4 Very low
Cosmetic defect in finish, fit and finish/squeak or rattle item that does not conform to specifications. Defect noticed
by most customers.
3 Minor
Cosmetic defect in finish, fit and finish/squeak or rattle item that does not conform to specifications. Defect noticed
by average customer.
2 Very minor
Cosmetic defect in finish, fit and finish/squeak or rattle item that does not conform to specifications. Defect noticed
by discriminating customers.
2.2.4 Detection
The detection level (D) represents the probability of not detecting the failure. “It is an assessment of the ability of a proposed design verification program to identify a potential weakness before the part or assembly is released to production.” (Peldez, 1995).
One definition of detection (D) difficulty is “’How well the organization controls the development process. Another definition relates to the detectability of failure on the product is in the hands of the customer. The former asks ‘What is the chance of catching the problem before we give it to the customer?’ The latter asks ‘what is the chance of the customer catching the problem before the problem results in a catastrophic failure?” (Palady, 1995). “These definitions confuse the FMEA users when one tries to determine detection difficulty. Are we trying to measure how easy it is to detect where a failure has occurred or when it has occurred? On the other hand, are we trying to measure how easy or difficult it is to prevent failures?” (Ishii S. J., 2003)
Table 2-3 shows the evaluation criteria used for the rankings and the corresponding linguistic terms.
Table 2-3 Traditional ratings for detection of a failure
Rating Detection Criteria
10 Absolutely
impossible
Design control will not and/or cannot detect a potential cause/mechanism and subsequent failure mode; or there is no
design control
9 Very remote Very remote chance the design control will detect a potential cause/mechanism and subsequent failure mode
8 Remote Remote chance the design control will detect a potential cause/mechanism and subsequent failure mode
7 Very Low Very Low chance the design control will detect a potential cause/mechanism and subsequent failure mode
6 Low Low chance the design control will detect a potential cause/mechanism and subsequent failure mode
(Wang, 2003), (K.S. Chin A. C., 2008), (K.S. Chin Y. W., 2009), (S.M. Seyed-Hosseini, 2006), (Y.M. Wang, 2009)
2.3 FMECA- FAILURE MODES EFFECTIVE AND CRITICALITY ANALYSIS
“Failure mode effects and criticality analysis (FMECA) is a widely used technique to improve products and processes safety and reliability in different contexts, such as automotive (Ford Motor Company, 1988), aviation (Bromley and Bottomley, 1994; Buzzatto, 1999), computer science (Becker and Flick, 1996), etc. The FMECA approach is based on a qualitative/quantitative analysis of a system (product or process) and its components in order to identify, by evaluating of failure mode causes and effects, the most critical elements to system operability and safety. For highly critical components, design modifications and maintenance actions have been proposed in order to prevent failure causes or to mitigate their effects.” (Alessandro Brun, 2011) The criticality number calculation described in MIL-STD-1629A (Department of Defencse- United States of America , 1980) is used mostly in the nuclear and aerospace industries.
It first categorizes the severity of the failure mode effect and then develops a criticality ranking which is, in essence, the probability of failure with that severity occurring. The procedure consists of determining the failure-effect probability (β) (i.e., conditional probability that the failure effect will result in the identified criticality classification, given that the failure mode occurs), the failure mode ratio (α), the part
5 Moderate Moderate chance the design control will detect a potential cause/mechanism and subsequent failure mode
4 Moderately
high
Moderately high chance the design control will detect a potential cause/mechanism and subsequent failure mode
3 High High chance the design control will detect a potential cause/mechanism and subsequent failure mode
2 Very High Very High chance the design control will detect a potential cause/mechanism and subsequent failure mode
1 Almost certain Design control will almost certainly detect a potential cause/mechanism and subsequent failure mode
failure rate (ʎ), and its operating time (τ). The product of these parameters gives the criticality index (IC) for each item failure mode.
2.4 TYPES OF FMEAS AND FMEA SUCCESS FACTORS
2.4.1 Types of FMEA
According to (Carlson, 2014), there are three common types of FMEA, System FMEA, Design FMEA and Process FMEA.
“System FMEA: is the highest-level analysis of an entire system, made up of various subsystems. The focus is on system-related deficiencies, including system safety, system integration, interfaces or interactions between subsystems or with other systems, interactions with the surrounding environment, human interaction, service, and other issues that could cause the overall system not to work as intended. In System FMEAs, the focus is on functions and relationships that are unique to the system as a whole (i.e., do not exist at lower levels). Included are failure modes associated with interfaces and interactions, in addition to considering single point failures (where a single component failure can result in complete failure of the entire system). Some practitioners separate out human interaction and service into their own respective FMEAs.
Design FMEA: focuses on product design, typically at the subsystem or component level. The focus is on design related deficiencies, with emphasis on improving the design and ensuring product operation is safe and reliable during the useful life of the equipment. The scope of the Design FMEA includes the subsystem or component itself, as well as the interfaces between adjacent components. Design FMEA usually assumes the product will be manufactured according to specifications.
Process FMEA: focuses on the manufacturing or assembly process, emphasizing how the manufacturing process can be improved to ensure that a product is built to design requirements in a safe manner, with minimal downtime, scrap and rework. The scope of a Process FMEA can include manufacturing and assembly operations, shipping, incoming parts, transporting of materials, storage, conveyors, tool maintenance, and labeling. Process FMEAs most often assume the design is sound. Failure Mode Effects and Criticality Analysis (FMECA) is similar to FMEA, with the added step of a more formal Criticality
Analysis. This added step commonly requires objective data to support the criticality calculation. It is recommended for practitioners who are required to perform a FMECA analysis to understand the basics of FMEA first, and then to learn the FMECA procedure. Some other types of FMEAs include:
Concept FMEA: a short version of FMEA to aid in selecting optimum concept alternatives or to determine changes to system design specifications
Maintenance FMEA: in support of Reliability Centered Maintenance projects
Hazard Analysis FMEA: This focuses on identifying and addressing potential hazards associated with the use of a product
Software FMEA: This identifies system weaknesses, and evaluates the effectiveness of the software architecture and software specifications.”
2.4.2 FMEA Success Factors:
(Carlson, 2014) Has mentioned six broad success factors that are critical to uniformity of success in the application of FMEA in any company as following:
1. “Understanding the fundamentals and procedures of FMEAs, including the concepts and definitions.
2. Selecting the right FMEA projects. 3. Preparation steps for each FMEA project. 4. Applying lessons learned and quality objectives. 5. Providing excellent facilitation.
6. Implementing an effective company-wide FMEA process.
7. Implementing these FMEA success factors will help ensure FMEAs achieve safe, reliable and economical products and processes.”
2.5 FMEA PROCEDURE
Referring to (Wang, 2003), the process for carrying out FMEA can be divided into several steps as shown in Fig. 2-1; these steps are briefly explained as:
1. “Develop a good understanding of what the system is supposed to do when it is operating properly.
2. Divide the system into sub-systems and/or assemblies in order to ‘localize’ the search for components as shown in figure 2-2
3. Use blue prints, schematics and flow charts to identify components and relations among components.
4. Develop a complete component list for each assembly.
5. Identify operational and environmental stresses that can affect the system. Consider how these stresses might affect the performance of individual components.
6. Determine failure modes of each component and the effects of failure modes on assemblies, sub-systems, and the entire system.
7. Categorize the hazard level (severity) of each failure mode (several qualitative systems have been developed for this purpose).
8. Estimate the probability. In the absence of solid quantitative statistical information, this can also be done using qualitative estimates.
9. Calculate the risk priority number (RPN): the RPN is given as the multiplication of the index representing the probability, severity and detectability.
10. Determine if action needs to be taken depending on the RPN.
11. Develop recommendations to enhance the system performance. These fall into two categories:
Preventive actions: avoiding a failure situation.
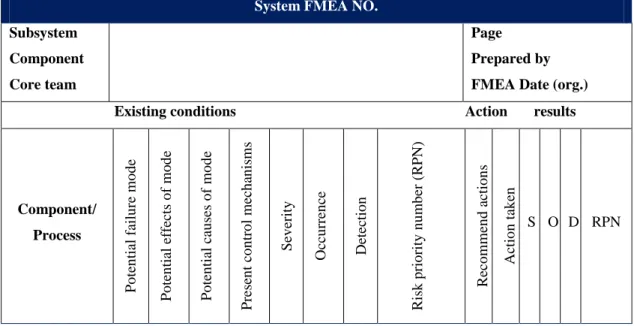
Compensatory actions: minimizing losses in the event that a failure occurs. 12. Summaries the analysis: this can be accomplished in a tabular form as shown in
table 2-4
Generally, an FMEA table will have a major row for each component. As these components may have multiple failure modes, the major row is sometimes divided into sub-rows where
each sub-row summarizes a specific failure mode. The table is organized into the following columns:
a) Component: create a major row for each component.
b) Failure mode(s): identify failure modes and establish a sub-row for each mode. c) Effects (by failure mode): describe the effects on safety and system performance
resulting from the failure. List specific adverse outcomes.
d) Probability: if reliability data does not exist, estimate using qualitative ranks. e) Hazard level (severity): if experience data does not exist, estimate using qualitative
ranks.
f) Causes of failure mode (if known): this includes environmental and/or operational stresses that increase the likelihood of the failure mode.
g) Methods of detecting failure mode (if known): although this entry does not prevent a failure from occurring, it is important to discover that a failure has occurred. This column is used to present signs and symptoms that a component has failed.
h) Suggested interventions: hardware modifications and/or compensatory actions to minimize effects.”
Table 2-4 Format of an FMEA report.
System FMEA NO.
Subsystem Component Core team
Page Prepared by FMEA Date (org.) Existing conditions Action results
Component/ Process Po ten tial f ailu re mode Po ten tial ef fec ts o f m o d e Po ten tial ca u ses o f mode Pre sen t co n tr o l m ec h an is m s Sev er ity Occ u rr en ce Dete ctio n R is k p rio rity n u m b er ( R PN) R ec o m m en d ac tio n s Actio n tak en S O D RPN (Hu-Chen Liu L. L.-H.-L.-C., 2011)
Figure 2-1 FMEA procedure (Wang, 2003)
2.6 FMEA IN CONSTRUCTION INDUSTRY
According to the (International Labour Organization, 2009), “Construction is one of the world’s biggest industrial sectors, including the building, civil engineering, demolition and maintenance industries. It accounts for a large proportion of GDP – 10 percent in the U.K., 17 percent in Japan, for example. In many developing countries, construction is among the fastest growing areas of the labour market, continuing to provide a traditional entry point for labourers. It is, however, one of the most dangerous industries. At least 108 thousand workers are killed on site every year, a figure which represents about 30 per cent of all occupational fatal injuries. Data from a number of industrialized countries show that construction workers are 3 to 4 times more likely than other workers to die from accidents at work. In the developing world, the risks associated with construction work may be 3 to 6 times greater. Many more workers suffer and die from occupational diseases arising from past exposure to dangerous substances, such as asbestos.”
Thus, to improve this situation, many systems have been implemented by construction firms such as, Occupational Health & Safety Advisory Services (OHSAS 18001) for Occupational Health and Safety (OHS) management, ISO 14001 for environmental management and ISO 9001 for quality management.
Moreover, in order to predict and hence mitigate or prevent the risks of a construction projects, “Various techniques have been developed for use in the management of risks in construction. However, these techniques are limited to addressing risks relating to only cost, schedule, or technical performance individually or at best a combination of cost and schedule risks” (William Imbeah, and Seth Guikema, 2009). These techniques are summarized in table 2-5.
In addition, (William Imbeah, and Seth Guikema, 2009) demonstrated that “The exceptions to this general conclusion are approaches based on Failure Modes and Effects Analysis (FMEA).” As “FMEA addresses budget, schedule, and technical risk together, but it does so based on ordinal, rather than cardinal, scales.” However, in the other hand, he urged, “FMEA does not provide a sound basis for allocating resources to manage risk. For example, if there are sufficient funds to address either a potential failure event given a score of 10 or two potential failure events each with a score of 5, which should be addressed?
FMEA cannot answer this question because ordinal scales do not provide a sound basis for optimizing the use of scarce resources to best manage project risk.”
Table 2-5 Some Risk Analysis Techniques and Risks Addressed
(William Imbeah, and Seth Guikema, 2009)
Despite the importance of FMEA as a risk assessment tool, still the “Studies with FMEA in construction industry are at their first step compared to the application of FMEA in manufacturing industry. Application of FMEA is also limited to reliability and influence of the types of constructions.” (Ji-Won Song, 2007)
In addition, most of the authors used the conventional FMEA for the construction projects risk assessment without major modifications except some authors who proposed modified FMEA, which has been combined with a fuzzy logic in most of the cases. In the following part of this section we are presenting the major researches done regarding the applications of FMEA in the construction industry.
Risk analysis technique
Addresses schedule risk Addresses budget risk Addresses technical risks _quality_ Computer Aided Simulation for Project Appraisal
and Review (CASPAR) Yes Yes No
Schedule Risk System Yes No No
Judgmental Risk Analysis Process (JRAP) Yes No No
Estimating Project and Activity Duration Using
Network Analysis Yes NO No
Data-Driven Analysis of Corporate Risk Using
Historical Cost-Control Data No Yes No
Estimating Using Risk Analysis (ERA) No Yes No
Failure Modes and Effects Analysis (FMEA) Yes Yes Yes
Utility-Functions in Engineering Performance
Assessment No No Yes
Program Evaluation and Review Technique—
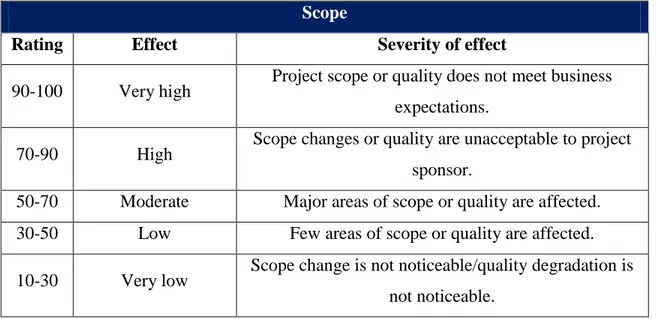
(Fayek, 2010), Proposed an extension application of FMEA to risk management in construction industry. They used combination of Fuzzy Logic and Fuzzy Analytical Hierarchy process (AHP) to build their model. In order to avoid the crisp evaluation of the conventional FMEA, they referred the severity (S) to impact (I) with three dimensions: Cost Impact (CI), Time Impact (TI) and Scope Impact (SI).
Although (Amir Mohammadi, 2013) used the same concept of fuzzy-AHP based FMEA but their model considered more dimensions in the evaluation process. They presented a practical approach for construction project risk assessment based on combined Fuzzy and FMEA. The proposed approach allows the project management team to use their judgment and experience in order to have a combination of Likelihood, Impact and Detection of risks. The judgment has been made using linguistic terms, which has been expressed in trapezoidal fuzzy members. This fuzzy concept has been used to address the limitation of the conventional FMEA. Moreover, AHP is utilized to engage cost impact, time impact, quality impact and safety impact, which gave this approach flexible structure since it considered all aspects of risk impact. The proposed framework has been applied in a subway construction project to investigate how this approach works.
(Ji-Won Song, 2007), proposed a model for the construction safety management using the conventional FMEA technique, that is shown in figure 2-3. The proposed model established a system for the safety management of steel-frame work by applying FMEA sheet based on the analysis of precedents.
Figure 2-3 Administration process to inflect FMEA in a steel-frame work. (Ji-Won Song, 2007) (Ltd, 1997): Demonstrated that although FMEA is most frequently used in in the initial design and the development phase of the project, it also has a valuable contribution in the manufacturing stage. Moreover, the author not only demonstrated the importance of FMEA in driving the most visible construction method and schedule, it also adds value in the analyses of day-to-day plant operations and maintenance activities. The paper proposed a frame-wok for applying FMEA at each project life-cycle stage, with suggested FMEA worksheets for each stage.
(Sai X. Zeng, 2010), Used FMEA technique in order to identify and evaluate twenty potential risk factors from Occupational Health and Safety (OHS), environment and quality for an industrial building construction project.
(Chew, 2011), Proposed a complete FMECA application to enhance Building maintainability through mitigation of defects. The methodology used bottom-up,
qualitative failure mode effect and criticality analysis (FMECA) as a suitable defect-grading tool and develops criticality parameters applicable for buildings. The analysis has been done for two major systems, nine subsystems, and 62 components of Singapore commercial buildings as shown in figure 2-4. In addition, 319 defects were identified. Moreover, the proposed method aptly evaluated defects from both complex (mechanical and electrical) and simple (Civil and architectural) subsystems whose general characteristics matched with the identified nature of associated defects.
3 FMEALIMITATIONS
This chapter mainly concerns of the shortcomings of traditional FMEA, and the methodologies used to evaluate the risk. Moreover, at the end, the chapter provides a criticality analysis and future research suggestions. The analysis is based on the literature review done by (Hu-Chen Liu L. L., 2013) and other papers.
3.1 FMEA SHORTCOMINGS
However, FMEA is one of the most important tool for early preventative actions in system, process, design etc., it has been extensively criticized for having many shortcomings, which lead to crisp risk priority number (RPN) and subsequently low reliability of the FMEA process especially in the complex systems. Therefore, a lot of research has been carried out in order to come up or decrease the effect of these shortcomings. In this section we are providing the most complete classification in the best of our knowledge, which has been done by (Hu-Chen Liu L. L., 2013), Table 3-1 summarizes the eleven major shortcomings of the conventional FMEA. Moreover, The statistics made by (Hu-Chen Liu L. L., 2013) showed that the importance of doing researches in order to enhance FMEA reliability has been increased over time especially between 2007 and 2011 as shown in Figure 3-1
Figure 3-1 Distribution of the reviewed articles (Hu-Chen Liu L. L., 2013)
6 8 17 40 4 0 5 10 15 20 25 30 35 40 45 1992-1996 1997-2001 2002-2006 2007-2011 2012-N O . O F A R TICL E YEAR
Table 3-1 The major shortcomings of FMEA
NO. Shortcomings Literature
1 The relative importance among O, S and D is not taken into consideration.
(Arash, 2004) , (Ahsen, 2008), (Carmignani, 2009), (Gabbriellib, 2011), (N.C. Xiao, 2011), (S.M. Seyed-Hosseini, 2006), (C.L. Chang C. W., 1999), (C.L. Chang P. L., 2001), (Rajiv Kumar Sharma D. K., 2005), (Rajiv Kumar Sharma D. K., 2007b), (Rajiv Kumar Sharma D. K., 2007c), (R.K. Sharma, 2007d), (Rajiv Kumar Sharma D. K., 2008c), (Rajiv Kumar Sharma P. S., 2010), (Wang, 2003), (Ying-Ming Wang, 2009), (P. A. A. GARCIA, 2005), (Prabhu, 2001), (Fayek, 2010), (Zhang, 2011), (Chang K.-H. a.-C., 2010), (Kutlu, 2012), (Peldez, 1995), (Bimal P. Nepal, 2008), (Zaili Yang, 2008), (Lim, 2006a), (FIORENZO FRANCESCHINI, 2001)
2
Different combinations of O, S and D may produce exactly the same value of RPN, but their hidden risk implications may be totally different.
(Arash, 2004) , (Ahsen, 2008),
(Carmignani, 2009), (Marcello Braglia M. F., 2003), (C.L. Chang C. W., 1999), (C.L. Chang P. L., 2001), (Rajiv Kumar Sharma D. K., 2005), (Rajiv Kumar Sharma D. K., 2007b), (Rajiv Kumar Sharma D. K., 2007c), (R.K. Sharma, 2007d), (Rajiv Kumar Sharma D. K., 2008c), (Rajiv Kumar Sharma P. S., 2010), (Wang, 2003), (Ying-Ming Wang, 2009), (Zhang, 2011), (Kutlu, 2012), (Chen, 2007),
(Zaili Yang, 2008), (Lim, 2006a), (FIORENZO FRANCESCHINI, 2001)
3 The three risk factors are difficult to be precisely evaluated.
(K. Xu, 2002), (Gabbriellib, 2011), (J. Yang, 2011), (K.H. Chang, 2010), (Braglia, 2000), (Ying-Ming Wang, 2009), (Gargama, 2011), (Liang-Hsuan Chena, 2009a), (Liang-Hsuan Chen, 2009b). (P. A. A. GARCIA, 2005), (Fayek, 2010), (Kutlu, 2012), (Zaili Yang, 2008)
4 The mathematical formula for calculating RPN is questionable and debatable.
(Gilchrist, 1993) , (Raouf, 2006), (C.L. Chang C. W., 1999), (C.L. Chang P. L., 2001), (Y. Geum, 2011),
(Gargama, 2011), (Kutlu, 2012), (Rajiv Kumar Sharma D. K., 2005)
5 The conversion of scores is different for the three risk factors.
(Gilchrist, 1993) , (Raouf, 2006), (Ahsen, 2008), (Carmignani, 2009), (K.S. Chin Y. W., 2009), (C.L. Chang C. W., 1999), (C.L. Chang P. L., 2001), (R.K. Sharma, 2007d),
(Gargama, 2011), (Prabhu, 2001), (Hu-Chen Liu L. L.-H.-L.-C., 2011), (Chen, 2007)
6 The RPN cannot be used to measure the effectiveness of corrective actions.
(Arash, 2004) , (Gilchrist, 1993), (Raouf, 2006), (Carmignani, 2009), (C.L. Chang C. W., 1999), (C.L. Chang P. L., 2001), (R.K. Sharma, 2007d), (Wang, 2003), (Gargama, 2011), (Chen, 2007), (Zaili Yang, 2008)
7 RPNs are not continuous with many holes.
(Carmignani, 2009), (K.H. Chang, 2010), (H.C. Liu, 2012), (P. A. A. GARCIA, 2005), (Chang K.-H. ,
(Hu-Chen Liu L. L., 2013)
2009), (FIORENZO FRANCESCHINI, 2001)
8 Interdependencies among various failure modes and effects are not taken into account.
(K. Xu, 2002), (K.S. Chin A. C., 2008), (M. Braglia, 2007), (Arash, 2004) , (Ahsen, 2008), (Carmignani, 2009) , (Carmignani, 2009),
(Gabbriellib, 2011), (K.S. Chin A. C., 2008), (Bimal P. Nepal, 2008), (O.P. Gandhi, 1992)
9
The mathematical form adopted for calculating the RPN is strongly sensitive to variations in risk factor evaluations.
(K.S. Chin Y. W., 2009), (Gargama, 2011), (Chang K.-H. , 2009). (Kutlu, 2012), (Zaili Yang, 2008)
10 The RPN elements have many duplicate numbers.
(S.M. Seyed-Hosseini, 2006), (K.H. Chang, 2010), (Gargama, 2011), (P. A. A. GARCIA, 2005). (Prabhu, 2001), (Chang K.-H. , 2009)
11 The RPN considers only three risk factors mainly in terms of safety.
(Carmignani, 2009) (Gabbriellib, 2011) (K.S. Chin Y. W., 2009), (Braglia, 2000), (Hu-Chen Liu L. L.-H.-L.-C., 2011), (Zaili Yang, 2008), (Kuei-Hu Chang and Ching-Hsue Cheng, 2010)
3.2 RISK EVALUATION METHODS OF FMEA
The literature done by (Hu-Chen Liu L. L., 2013) proposed a complete classification for the different methodologies used to evaluate the risk. Therefore, our literature will follow the same structure trying to propose more criticality analysis for the most important papers that can enrich our research.
In total, this section reviewed more than seventy scientific paper covered different applications in different domains. The followed framework divides the methods into five main categories, which are multi-criteria decision-making (MCDM), mathematical programming (MP), artificial intelligence (AI), hybrid approaches and others. Each category has been divided into sub-categories as showed in table 3-3.
3.2.1 MCDM approaches
3.2.1.1 ME-MCDM
(FIORENZO FRANCESCHINI, 2001), presented a multi-expert MCDM (ME-MCDM) technique for carrying out the calculation of the risk priority of failures in FMEA, which is able to deal with the information provided by the design team, normally given on qualitative scales, without necessitating an arbitrary and artificial numerical conversion. The method considered each decision-making criterion as a fuzzy subset over the set of alternatives to be selected. After the aggregation of evaluations expressed on each criterion for a given alternative, the failure modes were determined with the maximum risk priority code (RPC). If two or more failure modes have the same RPC a more detailed selection was provided to discriminate their relative ranking.
3.2.1.2 Evidence theory
(K.S. Chin Y. W., 2009) : Proposed a new FMEA methodology using the group-based Evidential Reasoning approach in order to help in capturing the diversity, incompleteness and uncertainty of information provided by FMEA team members. This methodology allows FMEA team members to independently assess risk factors and express their opinions individually. “It also allows the risk factors to be aggregated in a rigorous yet nonlinear rather than simple addition or multiplication
manner.” Moreover, it “includes assessing risk factors using belief structures, synthesizing individual belief structures into group belief structures and aggregating the group belief structures into overall belief structures, converting the overall belief structures into expected risk scores and ranking the expected risk scores using the MRA.”
(J. Yang, 2011) : In order to integrate the multiple evaluation of the risk done by experts, the paper proposed a modified evidence theory deals which different opinions of the FEMA team and multiple failure modes. It also provides simplified discernment frames according to practical engineering application. “The fused three risk factors are regarded as the discrete random variables. Consequently, the RPN is a function of the discrete random variable. The mean value of RPN is used for the risk priority ranking of failure modes.” A case study of aircraft turbine rotor blades has been used in order to demonstrate the methodology, in which the information of eight failures were evaluated by three different expertise and have been aggregated together. As a result, the risk ranking of the failure modes were consistent with the practical engineering background.
3.2.1.3 AHP/ANP
(Braglia, 2000) : Developed a Multi-attribute failure model analysis (MAFMA) using Analytic Hierarchy Process (AHP) technique in order to help the analyst to formulate more efficient and effective failure priority ranking. The proposed model integrates four factors (chance of failure, chance of non-detection, severity, and expected cost) instead of the three traditional factors proposed by the conventional FMECA.
The process starts with defining hierarchy form for the decision criteria; the goal in the top, criteria and sub-criteria (on which subsequent levels depend in) the intermediate level and the alternatives at the lowest level. Following, a judgment matrix based on Pairwise Comparison used for weighting the criteria, sub-criteria and alternatives in terms of expected cost attribute. Later on, the overall preference rating is calculating on a scale of from 0.000 to 1.000 with which each decision alternative is likely to achieve its objective.
(Carmignani, 2009) : Making reference to (Braglia, 2000), the paper proposed a priority-cost FMECA (PC-FMECA) in order to exceed some of traditional FMECA method such as; arbitrariness of attribution of the three parameters Severity, Occurrence, Detection, absence of a range of homogeneously distributed values for the RPN, and that the correlation of the RPN to economic aspects in non-safety- critical-cases.
The proposed method is an original and innovative approach based on a new interpretation of the RPN, on the AHP technique which allowed for new calculation of RPN and the introduction of the new parameter of Profitability taking into consideration the corrective action cost. In particular, the AHP technique has been used to give different weights to traditional parameters such as Severity, Occurrence and Detection. On the other hand, profitability, which is a new parameter based on costs and potential profit to reduce the losses caused by failure occurrence, problem is easily resolvable through an automated equation solver tool and its optimal solution gives the most convenient mix of failures to be repaired compared to the available budget.
(Allen H. Hua, 2009) : Presented a novel framework for a green component risk priority number (GC-RPN) to analyze the risk of green components of Hazardous Substance in compliance with the European Union (EU) the restriction. Applying the fuzzy analytic hierarchy process (FAHP), they determined the relative weightings of four risk factors (Occurrence (O), Detection (D) and Severity (S), which divided into two components, The Declaration Statement (S1) and The Frequency of Green Component Used by Project (S2)). Then the (GC-RPN) is calculated for each one of the components to identify and manage the risks derived from them.
(Gabbriellib, 2011) : The paper urged that (M. Braglia, 2007) HOR model captures only the immediate dependency between two causes and neglected the existence of higher order domino effects, however it was the only approach that tackled the criticism of the interdependency and correlation between the failures in the
conventional FMEA. Therefore, the paper proposed ANP/RPN model, which is more comprehensive risk assessment procedure combining FMEA, and ANP. This model enhanced the capability of the conventional FMEA taking into account the possible relationship among the causes of failure. Furthermore, a Pairwise Comparison has been used in order to calculate the RPN. Finally, the paper presented a graphical tool to clarify the results.
3.2.1.4 Fuzzy TOPSIS
(Marcello Braglia M. F., 2003) : proposed a new approach to calculate the risk priority number based on fuzzy version of the technique for order preference by similarity to ideal solution (TOPSIS). They have adopted this technique in order to simplify and enhance the risk assessment procedures in traditional FMECA, taking advantage of the basic idea of TOPSIS that allows measurement of the Euclidean distance of an alternative from an ideal goal. In addition, in order to eliminate the possible errors and uncertainty by directly evaluate the crisp linguistic assessment of FMECA three factors (O, S, D); a fuzzy logic version of TOPSIS has been developed. The benefits of this approach as mentioned in the conclusion are; “Introducing a potentially larger number of failure criteria;giving different degrees of importance to the criteria themselves; and making the analysis easier to carry out, due to the possibility of using imprecise data in the form of fuzzy numbers.” At the end, the paper demonstrated the capability of the methodology to manage a criticality analysis easily through case study, which also confirmed that the proposed approach gave reasonable and robust results using the sensitivity analysis of the fuzzy weights.
3.2.1.5 Grey theory
(C.L. Chang C. W., 1999) : Proposed an approach for RPN calculation using combination of the Fuzzy Method and the Grey Theory. They used the Fuzzy Logic in order to evaluate the FMEA factor levels using linguistic measures, while the Grey used to determine the risk priority of the failures. The conclusion demonstrated three main advantages of this approach as following:
o “The linguistic terms such as ``high'', ``low'' and ``moderate'' can be used to evaluate the degree of occurrence, undetection and severity; this is believed to increase the applicability of FMEA.”
o “The grey relational analysis is capable of assigning relative weight to the decision factors; therefore, the rationality of FMEA can be improved. This is the first attempt to consider the relative importance of factors.”
o “The grey theory can prioritize the potential risks of product or process failures without any utility function, this is also a breakthrough.”
(Rajiv Kumar Sharma D. K., 2008c) : proposed a structured framework that helps in analyzing the system behavior for a maintenance project using fuzzy logic. In addition, the proposed framework included various reliability parameters such as repair time, failure rate, availability, mean time between failures, and expected number of failures. The author concluded that,
“The application of fuzzy methodology in system failure engineering in general will help the system/reliability analysts to deal with the notion of uncertainty and imprecision related with subjective, imprecise and incomplete information.”
(Wang, 2003) : Proposed methodology for enhancing the conventional FMEA using the Fuzzy Set theory. The proposed methodology has been divided into two main steps. The first step uses fuzzy rule base (without the weighting factors of the linguistic variables) to perform the first step of the formal safety assessment (FSA) process by determining the risk level of failures. Second, The grey theory has been used (with the weighting factors of the linguistic variables) for the second step of the (FSA) process by providing more detailed analysis for each failure in order to provide ranking order determines the allocation of the limited resources.
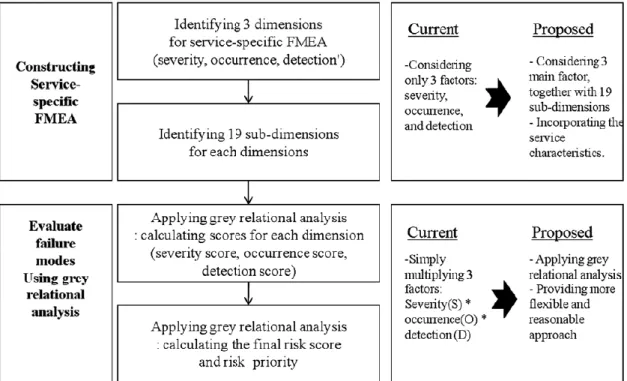
(Y. Geum, 2011) : Proposed a systematic approach for identifying and evaluating potential service failures using service-specific failure mode and effect analysis (service-specific FMEA) and grey relational analysis. This approach is divided into two main stages; the first one is to construct the service-specific FEMA by
identifying the three dimensions: severity, occurrence, and detection. For each dimension, they identify 19 service-specific elements (sub-dimensions) required to evaluate the service system. The aim of this framework is to have a holistic view of the service system and to provide the appropriate decision criteria required to evaluate the failure modes. Following, a calculation for the risk priority number for each failure takes place using grey relational analysis characterized by the multiple criteria decision making in a complicated interrelated situation. The overall framework is shown in figure 3-2
The advantage and the contribution of this paper has been summarized as following: “The contribution of this paper can be summarized in two ways. Firstly, this study incorporates the various service characteristics to the service by introducing the service-specific FMEA, incorporating 3 dimensions and 19 sub-dimensions to represent the service characteristics, thus modifying the traditional FMEA to a more concrete and systematic one. The criteria included in this paper, however, are by no means exhaustive or fixed, but can be customized depending on the context according to the firm. The criteria can be selectively used or aggregated according to the judgment of a firm. Using the service-specific dimensions, managers in practice can get an insight to identify as well as evaluate failure modes. It is also expected to be a guideline for managing service failure in practice. Secondly, from the methodological perspective, this paper contributes to the field in that it combines FMEA and grey relational analysis, addressing the limitations of previous calculations of risk priority, which are too simple to apply in a practical setting. In addition, two-phase grey relational analysis is applied to reflect the multilateral perspective of service, providing the aggregated risk score of each dimension, together with the overall score. Since the service-specific FMEA consists of many inter-related different dimensions, the use of grey relational analysis fits the service-specific FMEA by providing a simple, straightforward, but flexible approach.”
Figure 3-2 Service-specific FMEA and grey relational analysis. (Y. Geum, 2011) 3.2.1.6 DEMATEL
(S.M. Seyed-Hosseini, 2006) : proposed a novel technique named Decision Making Trial and Evaluation Laboratory (DEMATEL) as an effective approach to reprioritize the failure modes by analyzing the relation between system components in respect to its type (direct or indirect) and the severity of effect or influence. To distinguish between the direct and the indirect relation they demonstrated the indirect relation, as
“A failure mode (that is under effect of a cause of failure) can be cause of other failure mode (s).”
There are four main advantages of this technique; the consideration of indirect relationships during the analysis, the ability of grouping alternatives in large systems with many failure modes, allocating as possible as a unique rank number to each alternative and the ability to determine the severity relation between an alternative and others.
3.2.1.7 Intuitionistic fuzzy set ranking technique
(K.H. Chang, 2010) : Proposed a new methodology to reprioritization of failure modes in FMECA based on an intuitionistic fuzzy set ranking technique. The main goal of this technique is to reduce the duplicate in the RPN numbers, which make the results more reliable. This technique is very helpful during the design phase of a project as it allows the designer to identify high-risk areas and attain explicit levels of safety through a systematic approach by identifying and implementing ways to reduce failures occurrence and the extent of the respective consequences. By applying the technique in a saline supply system they came up with the following advantages
o Reduction of duplicate RPN numbers.
o More flexible and realistic failures information.
o More accurate and effective information that support decision-making process.
o An evaluation of redundancy place allows the designer to make correct decisions and to have safer and reliable product design.
3.2.1.8 VIKOR
(H.C. Liu, 2012) : “In this paper an extension of the VIKOR, a recently introduced MCDM method, in fuzzy environment is used to deal with the risk factors and identify the most serious failure modes for corrective actions. The VIKOR method focuses on ranking and selecting from a set of alternatives in the presence of conflicting criteria. It determines a compromise solution that could be accepted by the decision makers. Therefore, a new fuzzy FMEA based on fuzzy set theory and VIKOR method.”
3.2.2 Mathematical programing approaches
3.2.2.1 Linear programming
(Ying-Ming Wang, 2009) : Proposed a fuzzy risk priority number (FRPN) to prioritize the failure modes based on alpha-level sets and linear programming models. In addition, the defuzzification procedures used a new centroid formula based on alpha-level sets.