POLITECNICO DI MILANO
Scuola di Ingegneria Industriale e dell’Informazione
Dipartimento di Ingegneria Energetica
ANALYSIS OF LIQUEFIED NATURAL
GAS PRODUCTION CYCLES FOR
LOW-TEMPERATURE NATURAL GAS
PURIFICATION PROCESSES
Supervisor: Prof.ssa Giorgia De Guido
Msc. Thesis by:
Cristian Clerici, ID N° 862485
II I would like to thank some people who followed and helped me during the writing of this thesis work.
My profound gratitude goes to my thesis supervisor, Prof. Giorgia De Guido, who provided me with the details and technical guidance for the theory and the simulations. She has been always available to provide me with the documentation and the right advices necessary to write and complete this thesis work.
I would like to thank my mother, Viviana, and my father, Roberto, who always supported and encouraged me during all my academic career. A thanks also to the other member of my family who more followed me during this adventure.
I would like to thank all my friends. I would particularly like to thank my special friend, Cindy, who have always have been there for me, supporting and encouraging me since I met her three year ago. She always allowed me to confide with her all my doubts, fears and helped me with her valuable advices to overcome difficulties.
III
Extended summary
Introduction
The global energy consumption is forecasted to increase by 30% between today and 2040. The fossil fuels are expected to remain the dominant energy sources into the next future. Today, fossil fuels accounts for about the 85% of the global energy supply, most of which is used in the electrical energy production, industry and transportation sectors. Nowadays, the natural gas is an attractive alternative respect to other fossil fuels (oil products and coal). It offers a relevant advantage in terms of environmental impact because the combustion of natural gas results in lower emissions of CO2 and other pollutants than the combustion of oil and coal. The role of natural gas in the electric energy production is recently growing in importance because of the introduction of the renewable energy resources, which are not constant during the day, and, thus, are not dispatchable sources of electric energy, and cannot alone guarantee the stability of the electric grid. Therefore, the renewables plants, in a stable electric grid, must be helped by power plants able to change rapidly their production, and power plants fed with natural gas (gas turbines and combined cycles) allow higher flexibility rather than steam power plants (generally fed with coal, nuclear or oil).
The composition of natural gas can widely vary according to the extraction site. An important parameter that defines the quality of the natural gas is the content of acid gases (CO2 and H2S): a natural gas with a high amount of acid gases is called “sour” natural gas; a natural gas with low amount of acid gases is called “sweet” natural gas. Generally, the natural gas is extracted from the wells in sour/acid conditions, and it cannot be used as it is, but it must be purified (sweetened) to remove the acid gases. The acid gases deteriorate by corrosion the natural gas equipment for transportation and utilization. Then, they have an environmental impact if released after natural gas combustion. Therefore, acid gases are undesired in the natural gas and must be removed.
There are several technologies currently available for natural gas purification. Examples of conventional technologies currently well established in natural gas sweetening are: physical or chemical absorption with solvents; adsorption methods on solid beds; membrane technologies. All these technologies utilize a second substance or solid medium
IV (above 10% - 15% mol), the regeneration process is too costly, and these technologies are inconvenient from an economic point of view. Therefore, modern technologies have been recently developed to overcome the regeneration of the purification medium issue: these technologies are based on cryogenic methods of separating acid gas from natural gas. An example of cryogenic process is the Dual Pressure Low Temperature (DPLT) distillation process by Pellegrini (2014), in which the CO2 is separated by low temperature distillation operated at two pressure levels. This method allows the natural gas purification in a convenient way also with large contents of acid gas. Another cryogenic technology developed by Exxon Mobil in 1985 is the Controlled Freeze Zone™ (CFZ™). In the CFZ™ the separation of CO2 from natural gas occurs by solidification permitting to achieve high purity of natural gas. Another advantage of using a cryogenic technology for the natural gas purification rather than a conventional technology is in the case of geo-sequestration of CO2. The CO2 is a greenhouse gas and it must not be released into the atmosphere; thus, it can be injected underground for its storage or it can be injected in an oil well to improve the oil recovery. The CO2 must be injected underground at high pressure, but most of conventional purification technologies provide CO2 at a pressure close to 1 atm (because regeneration processes are generally carried out at low pressure), and it must be compressed to allow injection. On the contrary, the cryogenic purification techniques already provide CO2 at high pressure, thus requiring a lower compression expenditure.
In addition to the importance of the different natural gas resources and methods of extraction and purification, there is the role played by the transportation of the natural gas. The natural gas extraction sites are usually dislocated respect to the natural gas utilization zones. Thus, the natural gas must be transported from one place to the other one. The most common method for the natural gas transportation is via pipelines. However, in some cases the natural gas transportation via pipelines is not feasible because of political issues or it is not convenient and safe because of the too long distances. As alternative to pipeline transportation, natural gas can be liquefied and transported in tanks by means of trucks or ships. Liquefied Natural Gas (LNG) transportation methods are preferred for the
V transportation along distances over 3500 km. Moreover, LNG is recently introduced in the transportation sector with the commercializing of LNG vehicles.
Both natural gas pipelines and LNG trade are projected to increase in the next future, but LNG trade is projected to grow at a higher rate respect to the natural gas pipelines. Therefore, many countries are continuously increasing their LNG production capacity to meet the increasing LNG demand. The LNG production facilities are essentially refrigeration plants, in which compressed natural gas is cooled till a certain temperature, then it is expanded to atmospheric pressure obtaining LNG at -162 °C. Currently, all the natural gas liquefaction technologies are developed for a natural gas input coming from a conventional purification process that occurs at nearly ambient temperature and provides sweet natural gas at ambient temperature. However, most of the natural gas resources have a concentration of CO2 that makes not convenient the purification of natural gas using these technologies. Therefore, the cryogenic purification processes are more recommended for the exploitation of these natural gas resources, and liquefaction cycles that accept a natural gas input at low temperature are needed. The aim of this thesis work is to rationalize and optimize some liquefaction cycles currently used to liquefy a natural gas stream at ambient temperature, in order to adapt them to an input natural gas stream at low temperature.
There exist several liquefaction cycles in the market, which can be classified in three main categories: cascade refrigerant cycles that use pure refrigerant; mixed refrigerant cycles that use a mixture of different species to compose the refrigerant; cycles that use expanders to reduce the refrigerant pressure instead of the lamination valve. This work focuses on two mixed refrigerant liquefaction cycles, which are: the Single Mixed Refrigerant (SMR) liquefaction cycle, and the Propane Precooled Mixed Refrigerant (C3-MR) liquefaction cycle. The SMR liquefaction cycle is a very simple mixed refrigerant liquefaction cycle, and it has been used as starting point to develop the optimization procedure analyzed in this work. The C3-MR liquefaction cycle is one of the most used commercial liquefaction cycles. For this reason, in this thesis work, once the optimization procedure has been well established for the SMR liquefaction cycle, it has been extended to the C3-MR cycle.
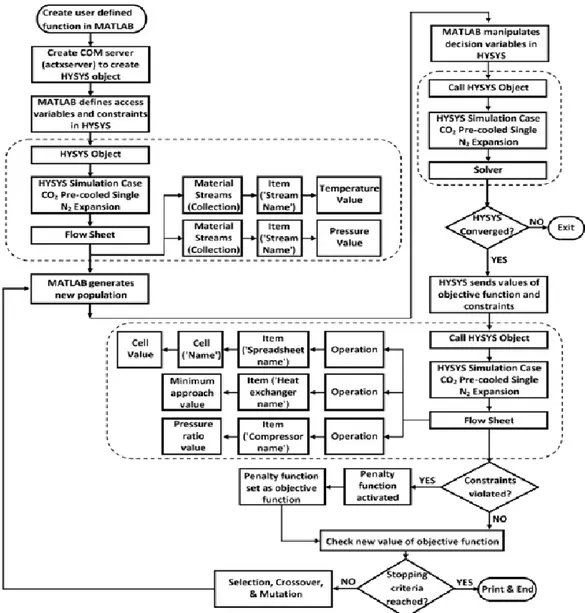
VI The method used to approach the problem explained in the introduction consists in creating the simulation of the liquefaction cycle in Aspen HYSYS® V9 (AspenTech, 2016), and then, to link it with MATLAB®. In this way, it is possible to perform the optimization of the liquefaction cycle in Aspen HYSYS® from MATLAB®. The interface between Aspen HYSYS® and MATLAB® is performed via the ActiveX technology (COM), which creates a communication server that allows to exchange variables between MATLAB® and Aspen HYSYS®. The command that allows to open the communication server is present in MATLAB® and is called “actxserver”. Once the COM object is created, it is possible to use the command “get” to import in the MATLAB® workspace all the streams and components needed in the optimizer as structure variables. This allows to choose the parameter present in the structure (that was imported from Aspen HYSYS® to MATLAB®), or to change its value from MATLAB® to Aspen HYSYS®.
The optimization algorithms used in this thesis work are: a grid approach method, the genetic algorithm (GA), the Pattern Search (PS) algorithm, and the interior point algorithm.
The grid approach method consists in discretizing the decisions the decisions variable over their range starting with a chosen step generating a table of combinations of the decision variable. For each combination, the value of the objective function is calculated, thus, a list of the objective function value for each combination is calculated. Then, the optimal value of the objective function is chosen. The next step consists in refining the result by generating a table of decision variables combination in the neighborhood of the previous result using a smaller step. By proceeding in this way, it is possible to find the optimum value of the decision variables. The constraints are included by eliminating all the combinations of the decision variable that don’t respect the constraints.
The GA is a stochastic optimization method. It belongs to the class of global optimization methods. The GA mimics the process of natural evolution by repeatedly selecting and modify a population of individual solutions. In the GA, the decision variables, embodied in the vector x, are represented by a chromosome and the single decision variable is a gene of the chromosome. Each individual solution is represented by a chromosome. At each step, the algorithm randomly selects some individual solutions from the current population and uses them as parents to produce the children of the next generation of individual solutions.
VII As the number of generations increases, the population approaches the optimum because “good” parents produce “good” children. On the contrary, the bad individual solutions are eliminated by the GA as occurs in the natural selection. Therefore, the GA is able to approach the optimum by selecting “good” individual solutions as parents and eliminating the “bad” solutions.
The PS optimization method, likewise the GA, belongs to the class of gradient-free methods. Thus, the optimization algorithm is not based on the gradient calculation, and the convergence is not affected by the typical issues of the gradient-based methods. The PS algorithm generates a pattern at each iteration. The pattern is a sequence of non-increasing solutions that the algorithm uses to determine in which point to search at each iteration. The PS algorithm starts from an initial point (the point consists in the list of the decision variables that represent the coordinates of the point, the initial values of the decision variables are decided by the user), and it generates a grid in the neighborhood of the initial point using a step determined by the algorithm. Then, the PS algorithm evaluates the value of the objective function at each neighboring point, and it finds the point characterized by the lower value of the objective function (if the algorithm is performing a minimization). Then, the PS uses as point for the next iteration the point characterized by the lower value of the objective function found in the previous iteration. If no point characterized by a lower value of the objective function is found, the PS reduces the step with which it finds the neighboring points. Proceeding in this way, the PS algorithm generates a pattern of solutions that approaches the optimal point.
The interior point algorithm, described in detail in the article by Robere (2012), is a conventional optimization method based on the evaluation of the gradient and the Hessian matrix of the objective function in order to find a local optimum of the function. The local optimum of the objective function is characterized by a gradient equal to 0. If the Hessian matrix is a positive-definite matrix, the optimal point is a local minimum. If the Hessian matrix is a negative-definite matrix, the optimal point is a local maximum. The gradient-based methods are very fast, and the computational time is in the order of some seconds till few minutes maximum. However, a gradient-based method cannot be used alone efficiently to perform the optimization of the problem faced in this thesis work because, due to the high non-linearity of the objective function, these algorithms can stuck at a local minimum and are not able to provide the best solution.
VIII PS are not able to improve this tolerance, even though different values of constraint’s tolerance are specified in the options. Therefore, when the values of optimized molar fractions are set in the Aspen HYSYS® flowsheet, it recalculates the molar fractions to make the stoichiometric equation to be respected, thus giving a slightly different result respect to the optimized one. For this reason, once the optimal point has been found using the GA or the PS, it would be better to perform a run using a gradient-based method such as the interior point method. Moreover, a second run using a gradient based-method allows to slightly refine the optimum in some cases.
Results
According to the optimization method utilized to optimize a liquefaction cycle, different results have been achieved. In this section the results obtained, and the performances of the optimization methods used to optimize the liquefaction cycles taken into account (i.e., the SMR cycle and the C3-MR cycle) are discussed.
The grid approach method is a quite simple algorithm to implement as MATLAB® code. However, the reliability of the optimized results given by the code depends on the initial step chosen for the generation of the table of the combination of decision variables. The smaller the chosen initial step, the more accurate the optimal result, but it would require much more time to calculate all the values of the objective function for each combination of the decision variables.
The GA is able to find an optimal point of the analyzed problem; however, being an optimization method based on a stochastic approach, it converges to different optimal point at each run. For this reason, it would be necessary to perform more runs to obtain a good result. Moreover, it was found that each run requires a lot of time to find a result.
The PS algorithm can find the optimum of this optimization problem using much less computational time than the GA. However, unlike the GA, in which the initial point is not an algorithm input, for the PS algorithm the result can slightly depend on the initial point. Therefore, the result could be improved by running several attempts with different initial points, thus having several results and, then, choosing the best one.
IX The interior point method is not able to find a result if it is performed starting from a casual point because, being a gradient-based method, it is affected by the high non-linearity of the studied objective function. This causes the algorithm to stuck in a local minima that is not the global optimum. Thus, the result obtained is not optimized. The interior point method can be suitable to improve the result obtained from a global optimization method that utilizes an algorithm free from the gradient evaluation for finding the optimum, such as the PS algorithm or the GA.
Conclusions
For all the reasons reported above, the best optimization method that has been found in this thesis work consists in performing the PS algorithm several times starting from different initial point each run in order to find a global optimal solution. The result can be further improved by performing a local optimization with a gradient-based method.
This thesis work focused on optimizing the composition and flow rate of the mixed refrigerant in the liquefaction cycle fed with a natural gas stream at low temperature, and in the discussion of the effects of other decision variables, such as pressure and temperature, on the compression power. Future works could be aim at finding a method for an overall optimization of the liquefaction cycle including all the decision variables instead of only the flow rate and the composition of mixed refrigerant. In addition to that, instead of optimizing only the decision variables, it would be possible to modify the scheme of the liquefaction cycle in order to make it more suitable to liquefy a purified natural gas stream at low temperature.
Moreover, future works could be extended to liquefaction cycles other than those considered in this thesis, which could be more suitable for the liquefaction of a purified gas stream at low temperature.
X
Acknowledgements………. II
Extended summary………... III
Index……….X
Abstract………... XIII
Key Words……… XV
Introduction………. 1
Chapter 1: CO
2removal from natural gas……… 5
1.1 Physical absorption………. 7
1.2 Chemical absorption………... 7
1.3 Membranes………. 9
1.4 Cryogenic distillation methods………. 10
1.4.1 Ryan-Holmes………11
1.4.2 Dual Pressure Low-Temperature distillation……….………. 15
1.4.3 Controlled Freeze Zone™ (CFZ™) ……….….……… 17
Chapter 2: Production of Liquefied Natural Gas………... 23
2.1 Fundamental principles………... 25
2.2 Cascade liquefaction processes………... 28
2.2.1 Liquid cascade process……….………. 28
2.2.2 Philips Optimized Cascade (POC) process……… 29
2.3 Mixed refrigerant processes……… 29
2.3.1 Single Mixed Refrigerant (SMR) process………... 29
2.3.2 PRICO process………... 29
2.3.3 Propane Precooled Mixed Refrigerant (C3-MR) process………...30
2.3.4 Dual Mixed Refrigerants (DMR) process……….…………. 32
XI
2.4 Expander processes………. 33
2.4.1 Single Nitrogen Expander process………. 33
2.4.2 Double Nitrogen Expander process………... 33
Chapter 3: Description of the optimization methods………. 35
3.1 Grid-based approach………. 35
3.2 Genetic algorithm (GA)……… 40
3.2.1 How to use MATLAB® to optimize a flowsheet in Aspen HYSYS® with GA... 41
3.3 Pattern Search (PS) method………. 42
3.3.1 How the PS method works in MATLAB®………43
3.4 Conventional optimization methods……… 47
3.4.1 Interior point method……….………. 48
3.5 Penalty function………... 49
Chapter 4: Single Mixed Refrigerant (SMR) liquefaction cycle……... 51
4.1 Description of the cycle……… 51
4.2 Cycle specifications……….……… 53
4.3 Effect of the decision variables……… 55
4.3.1 Effect of the mixed refrigerant composition and flow rate………. 55
4.3.2 Effect of the pressure at the end of the compression………... 65
4.3.3 Effect of the expansion temperature……… 67
4.4 Analysis of results……… 68
4.4.1 SMR fed with a natural gas stream purified by means of a conventional technology………... 68
4.4.2 SMR fed with a natural gas stream purified by means of a low-temperature distillation process……….………. 74
Chapter 5: Propane Precooled Mixed Refrigerant (C3-MR) liquefaction
cycle……… 77
5.1 Description of the cycle………. 77
5.2 Description of the optimization process………. 81
5.3 Cycle specifications……… 82
5.4 Effect of the decision variables………... 85
5.4.1 Effect of the mixed refrigerant composition and flow rate………. 85
XII
5.5 Analysis of results………. 106
5.5.1 C3-MR fed with a natural gas stream purified by means of a conventional technology……… 107
5.5.2 C3-MR fed with a natural gas stream purified by means of a low-temperature distillation process……… 109
Chapter 6: Exergy analysis……… 113
Conclusions and future developments……….………. 117
Figures list………... 120
Nomenclature and acronyms………. 126
XIII
Abstract
The recent increase of the natural gas demand in the world has required the development of natural gas reserves that were not considered economically viable in the past because of the high content of CO2. This makes the conventional CO2 removal technologies not energetically convenient and, thus, novel technologies have been proposed for this purpose. Some of these innovative technologies perform the purification by means of cryogenic distillation, producing a purified natural gas at low-temperature. In many cases, the natural gas must be liquefied after CO2 removal for LNG production, so to reduce its volume and to facilitate its transportation. However, nowadays, researches targeted to the optimization of liquefaction plants characterized by a natural gas inlet stream at low-temperature are not available in the literature. The aim of this thesis is to find a general method to optimize a natural gas liquefaction cycle that could work even if the inlet natural gas stream is at low temperature. The method used for the analysis consists in linking the plant simulation carried out in Aspen HYSYS® V9 with some optimization algorithms written in MATLAB®. The comparison among the results obtained with the different algorithms taken into account has allowed determining the most suitable one for the optimization of the LNG production process depending on the conditions of the inlet purified natural gas stream.
Sommario
La recente crescita della domanda di gas naturale nel mondo ha determinato lo sviluppo di riserve di gas naturale che in passato non erano considerate economicamente convenienti a causa del contenuto troppo alto di CO2. Il contenuto troppo alto di CO2 fa sì che le tecnologie convenzionali di rimozione della CO2 non siano energeticamente vantaggiose, quindi, nuove tecnologie sono state proposte per questo scopo. Alcune di queste tecnologie innovative eseguono la purificazione del gas naturale mediante distillazione criogenica, producendo gas naturale purificato a bassa temperatura. In molti casi, il gas naturale deve essere liquefatto dopo la rimozione della CO2 per la produzione di LNG, così da ridurne il volume e facilitarne il trasporto. Tuttavia, oggi, non sono disponibili in letteratura ricerche
XIV di liquefazione di gas naturale che possa funzionare anche se il gas naturale in ingresso si trova a bassa temperatura. Il metodo usato per l’analisi consiste nel collegare la simulazione d’impianto eseguita in Aspen Hysys® V9 con alcuni algoritmi di ottimizzazione scritti in Matlab®. Il confronto dei risultati ottenuti con i differenti algoritmi considerati permette di determinare quale algoritmo è più indicato per l’ottimizzazione del processo di produzione di LNG a seconda delle condizioni del gas naturale purificato da liquefare.
XV
Key Words
Natural Gas: It is a naturally occurring hydrocarbon gas mixture consisting primarily of methane, but commonly including varying amounts of other higher alkanes, as well as non-hydrocarbon compounds such as carbon dioxide and hydrogen sulfide.
Low-Temperature Distillation: Distillation process that occurs at low temperature and allows the separation of compounds characterized by different boiling points.
Carbon Dioxide: It is a colorless gas. The molecule consists of a carbon atom covalently double bonded to two oxygen atoms. Its presence in natural gas is responsible for its acidic nature.
LNG (Liquefied Natural Gas): It is natural gas that has been liquefied to facilitate its transportation and storage.
SMR (Single Mixed Refrigerant): Liquefaction process used to produce LNG characterized by a single refrigeration cycle that uses a mixture of nitrogen and hydrocarbons as refrigerant fluid.
C3-MR (Propane Precooled Mixed Refrigerant): Liquefaction process used to produce LNG characterized by two refrigeration cycles connected in series. The first uses pure propane as working fluid, the second uses a mixture of nitrogen and hydrocarbons as refrigerant fluid.
Parole Chiave
Gas Naturale: È una miscela presente in natura costituita principalmente da metano, ma può includere comunemente anche altri alcani caratterizzati da una massa molecolare maggiore di quella del metano, e altri composti non idrocarburici come anidride carbonica e acido solfidrico.
Distillazione a Bassa Temperatura: Processo di distillazione che avviene a bassa temperatura e che permette la separazione di componenti caratterizzati da diversi punti di ebollizione.
XVI carattere acido.
LNG (Liquefied Natural Gas): È gas naturale che è stato liquefatto per facilitatane il trasporto e lo stoccaggio.
SMR (Single Mixed Refrigerant): Processo di liquefazione utilizzato per produrre LNG caratterizzato da un ciclo di refrigerazione singolo che utilizza una miscela di azoto e idrocarburi come fluido refrigerante.
C3-MR (Propane Precooled Mixed Refrigerant): Processo di liquefazione utilizzato per produrre LNG caratterizzato da due cicli di refrigerazione collegati in serie. Il primo utilizza propano puro come fluido di lavoro, il secondo utilizza una miscela di azoto e idrocarburi come fluido refrigerante.
1
Introduction
The global energy consumption is forecasted to increase by 30% between today and 2040 (World Energy Outlook, 2017). The fossil fuels are expected to remain the dominant energy sources into the next future. Today, fossil fuels account for about the 85% of the global energy supply, most of which is used in the electrical energy production, industry and transportation sectors.
Nowadays, the natural gas is an attractive alternative respect to other fossil fuels (i.e., oil products and coal). It offers a relevant advantage in terms of environmental impact because the combustion of natural gas results in lower emissions of CO2 and other pollutants than the combustion of oil and coal.
The natural gas consumption is forecasted to grow at an average of 0.9% / year from 2015 to 2040 in the OECD (Organization for Economic Co-operation and Development) countries, and of 1.9% / year in the non-OECD countries. Regarding electric energy production and industrial sector, the total natural gas consumption is projected to increase by 75% from 2015 to 2040 (IEA). Recently, natural gas is also being used in the transportation industry thanks to the recently developed LNG (Liquefied Natural Gas) vehicles for road transportation. In the marine transportation sector, the natural gas is an attractive alternative to the oil products in order to meet the regulation of the International Convention for the Prevention of Pollution from Ships (MARPOL) Annex IV, which limits the sulfur content in the marine fuels.
The role of natural gas in the electric energy production is recently growing in importance because of the introduction of the renewable energy resources, which are not constant during the day, and, thus, are not dispatchable sources of electric energy, and cannot alone guarantee the stability of the electric grid. Therefore, the renewable plants, in a stable electric grid, must be helped by power plants able to change rapidly their production, and power plants fed with natural gas (gas turbines and combined cycles) allow higher flexibility rather than steam power plants (generally fed with coal, nuclear or oil).
Thera are several types of natural gas resources: conventional associated natural gas, in which natural gas is associated with an oil well; conventional non-associated natural gas, in
2 which natural gas is present alone in the well; gas-rich shale; tight sand gas; coal-bed methane. The first two natural gas resources require conventional technologies, such as physical absorption, chemical absorption and membrane; the last three natural gas resources require new developed technologies, such as cryogenic distillation processes, to be exploited. Recently, shale and tight sand resources are increasing their importance in the worldwide natural gas supply scenario. Shale gas accounted for the 50% of U.S. total natural gas production in 2015, and it is forecasted to increase to 70% by 2040 (IEA). Shale resources are projected to increase to 50% of the total natural gas production in China by 2040 (IEA).
The composition of natural gas can widely vary according to the extraction site. An important parameter that defines the quality of the natural gas is the content of acid gases (CO2 and H2S): a natural gas with a high amount of acid gases is called “sour” natural gas; a natural gas with a low amount of acid gases is called “sweet” natural gas. Generally, the natural gas is extracted from the wells in sour/acid conditions, and it cannot be used as it is, but it must be purified (sweetened) to remove the acid gases. The acid gases deteriorate by corrosion the natural gas equipment for transportation and utilization. Then, they have an environmental impact if released after natural gas combustion. Therefore, acid gases are undesired in the natural gas and must be removed.
The amount of CO2 in the natural gas can be a lot different, ranging from few tenths to above 80% mol according to the location of the extraction well (Burgers et al., 2011). It is estimated that the global sour natural gas resources are about 4×10¹² m3, but most of these natural gas accumulations are not exploited till now because of the high content of CO2, which can vary from 15% to 80% mol (Burgers et al., 2011). When a sour natural gas contains a concentration of CO2 higher than 10% - 15% mol, it is not convenient to exploit it because of the too high management cost of the purification process if a conventional technology is adopted.
There are several technologies currently available for natural gas purification. Examples of conventional technologies currently well established in natural gas sweetening are: physical or chemical absorption with solvents; adsorption methods on solid beds; membrane technologies (Yeo et al., 2012). All these technologies utilize a second substance or solid medium in which the acid gas is captured. Thus, they require a regeneration process that allows the reutilization of the purification medium. If the content
Introduction
3 of acid gas in the natural gas is high (above 10% - 15%), the regeneration process is too costly, and these technologies are inconvenient from an economic point of view. Therefore, modern technologies have been recently developed to overcome the regeneration of the purification medium issue: these technologies are based on cryogenic methods for separating acid gas from natural gas. An example of cryogenic process is the Dual Pressure Low Temperature (DPLT) distillation process by Pellegrini (2014), in which the CO2 is separated by low temperature distillation operating at two pressure levels. This method allows the natural gas purification in a convenient way also with large contents of acid gas. Another cryogenic technology developed by Exxon Mobil in 1985 (Valencia et al., 1985) is the Controlled Freeze Zone™ (CFZ™). In the CFZ™ the separation of CO2 from natural gas occurs by solidification permitting to achieve high purity of natural gas. Another advantage of using a cryogenic technology for the natural gas purification rather than a conventional technology is in the case of geo-sequestration of CO2. The CO2 is a greenhouse gas and it must not be released into the atmosphere; thus, it can be injected underground for its storage or it can be injected in an oil well to improve the oil recovery (Northrop and Valencia, 2009). The CO2 must be injected underground at high pressure, but most of conventional purification technologies provide CO2 at a pressure close to 1 atm (because regeneration processes are generally carried out at low pressure), and it must be compressed to allow injection. On the contrary, the cryogenic purification techniques already provide CO2 at high pressure, thus requiring a lower compression expenditure. In addition to the importance of the different natural gas resources and methods of extraction and purification, there is the role played by the transportation of the natural gas. The natural gas extraction sites are usually dislocated respect to the natural gas utilization zones. Thus, the natural gas must be transported from one place to another one. The most common method for the natural gas transportation is via pipelines. However, in some cases the natural gas transportation via pipelines is not feasible because of political issues or it is not convenient and safe because of the too long distances. As alternative to pipeline transportation, natural gas can be liquefied and transported in tanks by means of trucks or ships. Liquefied Natural Gas (LNG) transportation methods are preferred for the transportation along distances over 3500 km (Lim et al., 2013). Moreover, LNG is recently introduced in the transportation sector with the commercializing of LNG vehicles.
4 Both natural gas pipelines and LNG trade are projected to increase in the next future, but LNG trade is projected to grow at a higher rate respect to the natural gas pipelines. Therefore, many countries are continuously increasing their LNG production capacity to meet the increasing LNG demand. The LNG production facilities are essentially refrigeration plants, in which compressed natural gas is cooled till a certain temperature, then it is expanded to atmospheric pressure obtaining LNG at -162 °C.
In this introduction, it has been discussed that the supply chain of LNG is composed by the following main steps: natural gas extraction from the well, natural gas purification from the acid gases, natural gas liquefaction by means of an opposite facility. Currently, all the natural gas liquefaction technologies are developed for a natural gas input coming from a conventional purification process that occurs at nearly ambient temperature and provides sweet natural gas at ambient temperature. However, most of the natural gas resources have a concentration of CO2 that makes not convenient the purification of natural gas using these technologies. Therefore, the cryogenic purification processes are more recommended for the exploitation of these natural gas resources, and liquefaction cycles that accept a natural gas input at low temperature are needed. The aim of this thesis work is to rationalize and optimize some liquefaction cycles currently used to liquefy a natural gas stream at ambient temperature, in order to adapt them to an input natural gas stream at low temperature.
5
Chapter 1: CO
2removal from natural gas
The exact composition of raw natural gas depends on the location of the gas field. However, the main components of the natural gas are: methane; heavier hydrocarbons as ethane, propane, butane; some acidic gases as CO2 and H2S. Table 1.1 show a typical composition of raw natural gas.
Table 1.1. Typical chemical composition of natural gas (Boehm and Tarek, 2009).
Compound Symbol
Molar fractions in natural gas [mol%] Methane CH4 60 – 90 Ethane C2H6 0 – 20 Propane C3H8 0 – 20 Butane C4H10 0 – 20 Carbon dioxide CO2 0 – 8 Oxygen O2 0 – 0.2 Nitrogen N2 0 – 5 Hydrogen sulphide H2S 0 – 5
Rare gases Ar, Xe, Ne, He 0 – 2
The natural gas is formed when organic matter was buried and subjected to pressure of earth over millions of years. The natural gas can be found in the wells associated with oil (the oil is generally composed by heavier hydrocarbons as it is present in liquid form), it can be found alone in the well (non-associated natural gas), or it can be trapped by different geological structures (shale gas, tight sand gas, coal-bed methane). Once a natural gas resource is found, a well is drilled in order to extract the natural gas. The raw natural gas usually cannot be used as is because of the too high content in acid gases, so it must be purified, then it can be sent to the final users. Usually, the final users are far from the location gas field, so natural gas must be transported. The most common way of natural gas transportation is by pipeline. However, for great distances, or if the construction of pipeline implies some political issues (usually, the pipes must pass through different countries), the natural gas pipelines is not convenient. In these cases, it is preferred to
6 liquefy natural gas to reduce its volume, and easily transport it via ground (using trucks) or via ships (bunkers).
The main component of acid gas is methane, but it may contain other hydrocarbons, water and acid gases as CO2 and H2S. Table 1.2 reports the content of acid gases of several gas fields. Acid gases must be removed from natural gas because they damage the equipment used for transportation and utilization of natural gas. For the transportation via pipeline the regulation allows a CO2 content in the natural gas of maximum 2% mol, for LNG production the maximum CO2 allowed content is 50 ppm (Valencia et al., 2014). For these reasons, technologies able to reduce the CO2 content in the natural gas are necessary. There are several categories of natural gas purification, two main categories have been considered in this work: the first technologies are well established, so they are conventional technologies, and they exploit a third medium to capture CO2; the second category involves a cryogenic distillation, in which the different normal boiling point (NBP) of methane and CO2 is exploited for separation, they have been recently developed. In this section some of the purification technologies are shown.
Table 1.2. Acid gas content in some natural gas reserves (Langé and Pellegrini, 2016).
Gas field Location Acidic gases [mol%]
Natuna Indonesia >70% CO2
Kapuni New Zealand 43.8% CO2
Uch Pakistan 46.2% CO2
LaBarge USA 65% CO2
Harweel Cluster Oman 20% CO2
Bearberry Canada 90% H2S
Sepat, Noring, Inas Malaysia 60% CO2
Beranang Malaysia 28% CO2
Shah United Arab Emirates 23% H2S, 10% CO2
El Tapial Argentina 72.24% CO2
Molve Croatia 23% CO2
Chapter 1
7
1.1 Physical absorption
Physical absorption is a class of natural gas purification processes in which the CO2 is captured by a solvent. This process exploits the different solubility of the CO2 in a solvent respect to the solubility of the methane in the solvent. The CO2 solubility in the solvent depends on the partial pressure of CO2 and on the temperature: high values of CO2 partial pressure and low temperature improve the solubility. Therefore, the physical absorption is usually carried at high pressure and low temperature (Yeo et al., 2012). It requires a regeneration unit to allow the reutilization of the solvent in the absorption column. The regeneration unit is usually carried out at low pressure to reduce the solubility of the CO2 in the solvent and allow its release from the solvent.
1.2 Chemical absorption
Chemical absorption usually uses a combination of aqueous organic solvents (generally amines) that creates chemical bounds with the acid gases contained in the sour gas allowing its sweetening. Then, the solvents must be put in some conditions allowing the break of the chemical bounds between the solvent and the acid gas, which can be, after some treatments (i.e.: recompression), reinjected in a well for acid gas sequestration. Thus, the solvent can be regenerated and reutilized.
The organic solvents are generally combinations of DiEthanolAmine (DEA) and MonoEthanolAmine (MEA). DEA is a secondary amine, and it is less active with CO2 and H2S than the primary amine MEA. However, DEA requires less energy for regeneration and it allows to reduce the operative costs (Peters et al., 2011).
Figure 1.1 shows the scheme of a usual amine absorption process. The natural gas enters the bottom of the absorber tower, a stream of lean amine enters the top of the absorber. The lean amine stream is a solution of water and amines poor in acid gases. The concentration of amines in water of usually 30 wt.%, and never above 35 wt.% because amines in water hava a highly corrosive behavior (Peters et al., 2011). In the absorber the natural gas is brought in contact with the amine liquid stream, so the acid gases present in the natural gas can dissolve in the solution and react with the amines. The sweetened natural gas comes
8 out from the top of the absorber. At the bottom of the tower, the amine solution rich in acid gases is collected, laminated and sent to the regeneration block.
The laminated rich amine solution enters the hydrocarbon flash, in which the hydrocarbons entrained by the amine solution is separated, and it is usually used to provide part of the thermal duty required for the regeneration process. Then, the rich amine solution collected at the bottom of the hydrocarbon flash is sent to the regeneration column (stripper), in which the reboiler provides the thermal duty to allow the breaking of the chemical bound between acid gases and amine and the releasing of acid gases that are collected at the top of the column. The condenser at the top of the regeneration column permits the condensation of the water that is piped back into the regeneration column, thus to reduce the losses of water during the process.
Figure 1.1 shows a simple scheme of the amine absorption process.
Figure 1.1. Simplified flow scheme of the amine absorption process (Peters et al., 2011).
Chapter 1
9 The lean amine solution is collected at the bottom of the regeneration column, and it is pumped and sent to the absorber to complete the cycle.
The absorption tower works at high pressure (usually around 100 bar), and at low temperature (from 30 to 40 °C), since these operating conditions permit the acid gas to react with amines being the reaction exothermic and with reduction of moles number (Peters et al., 2011). On the contrary, the regeneration tower works at low pressure (2.1 bar) and at elevated temperature (100 -125 °C), since this helps the breaking of the chemical bound between acid gases and amines (Peters et al., 2011). Thus, the regeneration process is energetically expensive, due to the heat supplied by the reboiler.
Chemical and physical absorption suffer from several disadvantages in natural gas purification when the content of CO2 in natural gas is large. Such disadvantages include: the amount of solvent needed that increases with the amount of CO2 in the natural gas; the solvent regeneration process is energy intensive, so the operating cost is large if the amount of solvent being regenerated is high; the complexity of the plant, which requires the regeneration tower increasing the installation cost; the maintenance cost is high due to the corrosive nature of the solvents; the degradation of the solvents overtime requires their substitution with additional costs.
1.3 Membranes
The membrane technologies for separating CO2 from CH4 are a quite recent method, and they allow separation. The most common membranes are made of cellulose acetate membranes, but recently, fixed site carrier membranes show potential in natural gas sweetening (Peters et al., 2011). The main transport mechanism for membrane is the diffusion, and the diffusive flux Ji of the i-component can be expressed by the Fick’s law in the Eq. (1.1).
𝐽
𝑖=
𝐷𝑖10 In the Eq. (1.1), Di is the Fick’s diffusion coefficient and depends on the membrane material, the l is the thickness of the membrane, Ci,f is the concentration of the i-component in the feed stream, the Ci,p is the concentration of the i-component in the permeate side of the membrane (Peters et al., 2011).
The sweetening processes with membrane have several disadvantages, including: they are less competitive respect to other CO2 capture technologies because of their lower selectivity, and they are currently not suitable to treat large volumes of natural gas: membranes suffer degradation overtime, so they must be operated in near ambient temperature; they can suffer problem of plasticizing if the pressure of CO2 is too high (Yeo et al., 2012).
1.4 Cryogenic distillation methods
The natural gas purification methods described above have different limitations when the CO2 amount in the natural gas is large. Therefore, the recent need to exploit new natural gas resources rich in CO2 induced the research to develop cryogenic methods to separate CO2 from natural gas.
The novel cryogenic distillation technologies for acid gas removal are methods that exploit the difference in boiling point between methane and CO2, so the relative volatility of methane to CO2. Relative volatility (α) is defined in Eq. (1.2).
𝛼 =
𝑃𝑒𝑣,𝐶𝐻4𝑃𝑒𝑣,𝐶𝑂2 (1.2)
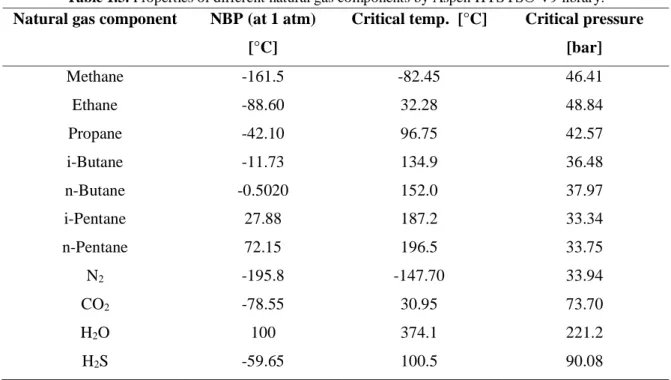
Where the Pev is the evaporation pressure of the component at a fixed temperature. While the evaporation pressure is strongly dependent on the temperature, the relative volatility is slightly depended on temperature, and it can be considered constant with temperature. In Table 1.3, the normal boiling points (NBP) and critical properties of some components of natural gas are reported.
Chapter 1
11
Table 1.3. Properties of different natural gas components by Aspen HYSYS® V9 library. Natural gas component NBP (at 1 atm)
[°C]
Critical temp. [°C] Critical pressure [bar] Methane -161.5 -82.45 46.41 Ethane -88.60 32.28 48.84 Propane -42.10 96.75 42.57 i-Butane -11.73 134.9 36.48 n-Butane -0.5020 152.0 37.97 i-Pentane 27.88 187.2 33.34 n-Pentane 72.15 196.5 33.75 N2 -195.8 -147.70 33.94 CO2 -78.55 30.95 73.70 H2O 100 374.1 221.2 H2S -59.65 100.5 90.08
Table 1.3 shows that it is possible to separate CO2 from methane by means of distillation at cryogenic temperatures, obtaining liquid CO2 and gaseous methane. Moreover, cryogenic distillation also separates from methane all the hydrocarbons present in natural gas with large NBP (propane, butane, etc.), which can be recovered downstream as NGLs (Natural Gas Liquids) in an NGLs recovery unit.
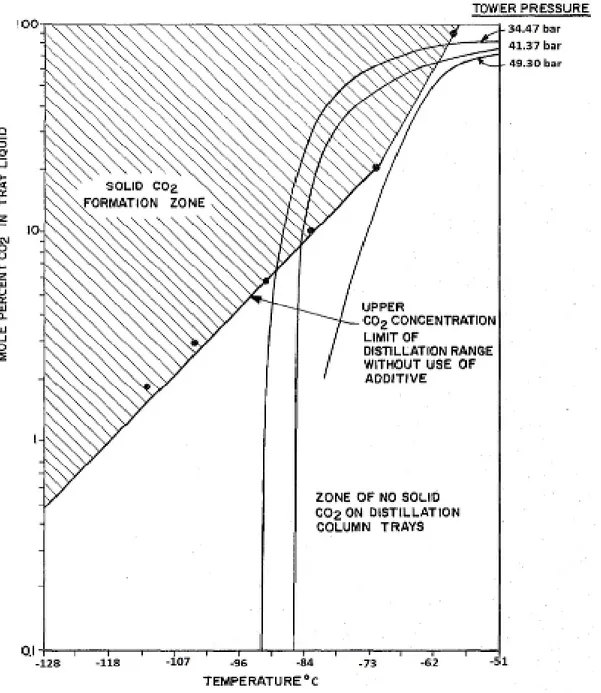
The main issue of cryogenic distillation, which prevented the method from becoming commercially feasible, is the freezing of CO2. Figure 1.2 shows that at cryogenic temperatures, when the fraction of CO2 in gas stream is important, solidification of CO2 can occur.
12
Figure 1.2. Solid CO2 formation zone diagram by Ryan and Holmes
(1982).
Solid CO2 formation is not desirable because it could plug the distillation column and other equipment making the distillation process inoperative. Moreover, Figure 1.2 shows that operating the distillation column at a pressure close to 50 bar, solid formation of CO2 does not occur. However, Table 1.3 shows that the critical pressure for methane is 46.41 bar, thus, at pressures where CO2 solidification does not occur, the mixture becomes critical stopping further improvements in the purification of methane from CO2. Therefore, by operating the distillation column at high pressure to avoid the solidification of CO2, it is
Chapter 1
13 possible to only partially purify natural gas because: at the bottom of the distillation column a CO2 rich mixture exists, having a critical pressure close to the one of CO2 (Table 1.2: critical pressure of CO2 73.70 bar); whereas, at the top of the distillation column a methane rich mixture is formed, having a critical point close to the one of methane (Table 1.2: critical pressure of methane 46.41 bar), which may be lower than the operating pressure of the distillation column, thus causing supercritical conditions and the impossibility of obtain high-purity product (Ryan and Holmes, 1982).
To overcome these inconvenient of the cryogenic distillation, several processes have been developed. In the following, three of them are analyzed in more detail.
1.4.1 Ryan-Holmes
In the Ryan-Holmes process, the feed gas (consisting of methane, acid gases such as CO2 and H2S, and other heavier hydrocarbons) enters the cryogenic distillation column (18), which is run at a temperature, composition and pressure that produce a “solid potential zone” for CO2. The term “solid potential zone” refers to the possibility of CO2 solidification in certain zones of the distillation column if no action to prevent it is taken. These conditions are necessary to obtain high purity methane at the top of the distillation column (Ryan and Holmes, 1982).
To prevent the CO2 solidification in the “solid potential zone” within the distillation tower, a solids-preventing agent is added to the column. The solids-preventing agents are additives that increase the solubility of CO2, preventing solid formation. The additives are generally heavier hydrocarbons (C3 – C6) that can be added to the column or in alternative, they are taken from the bottom of the distillation tower and recirculated in the tower. In any case, the solids-preventing agents must be added in sufficiently quantity in order to avoid CO2 solidification. Moreover, the solid preventing agents rise the critical pressure and temperature of the mixture within the distillation column improving the separation (Ryan and Holmes, 1982).
14
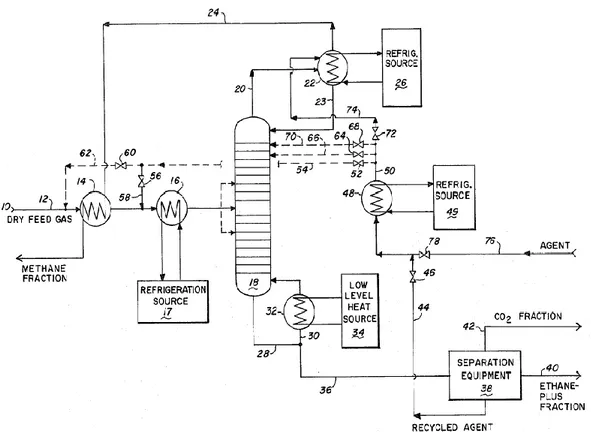
Figure 1.3. Schematic flow diagram of Ryan Holmes process by Ryan and Holmes (1982).
The main advantage of Ryan-Holmes process over a conventional amine absorption process is: in the amine absorption two towers are used, one for absorption and one for regeneration casing high complexity of the plant and capital cost; in the Ryan-Holmes process, the separation of methane from acid gases occur in only one tower, the complexity of the system is reduced.
However, heavier hydrocarbons are used as additives to avoid CO2 solidification. If the amount of acid gas in the feed stream is high, a larger amount of additive is required, and this leads to an increase in operating costs (purchasing cost of additive). Moreover, the additives must be stored, and being hydrocarbons, there are security issues (as the risk of fire).
Chapter 1
15 1.4.2 Dual Pressure Low-Temperature distillation
The Dual Pressure Low-Temperature (DPLT) distillation process is a cryogenic distillation in which the formation of solid CO2 is prevented by applying two distillation steps at different pressure with an intermediate heating step. The feed stream is usually a mixture of methane, other heavy hydrocarbons (C2 – C3) and acid gases as CO2 and H2S. The process can accept a content of CO2 in the gas feed stream above 80 mol%, and any amount of H2S (Pellegrini, 2014). The temperature of the feed stream should be at its dew temperature or below.
The first distillation step occurs in a pressure range of 45 – 55 bar, usually about 50 bar. This allows to partially reduce the CO2 content in the natural gas stream avoiding the solids formation but yielding to a top gas stream in which the concentration of CO2 is still high (Pellegrini, 2014).
The top product of the first step is expanded in a valve and sent to the second distillation step that operates at lower pressure to allow the production of high purified methane. In order to avoid CO2 solidification, part (at least 20%) of the top product from the first step is heated up to a temperature 3 – 8 °C higher than the dew point of the mixture. The heated stream (constituted of vapor) is preferably fed in a section of the second distillation tower below where the non-heated stream (containing liquid phase) is entered (Pellegrini, 2014). The bottom product of the first distillation step consists mainly of acid gases, heavier hydrocarbons that can be recovered as NGLs. The acid gases, produced by this process, are at relatively high pressure making geo-sequestration more easily and economically (Pellegrini, 2014).
The second distillation step occurs in a pressure range of 38 – 43 bar, usually about 40 bar. Thanks to the lower pressure, the second distillation step yields as a top product methane with the desired purity in according to the downstream application. The temperature of the top product is the dew point of methane respect to the pressure at which the second distillation step is operated (e.g., if the pressure is 40 bar the product temperature is -87.34 °C). A partial condenser provides the reflux stream to the second distillation step (Pellegrini, 2014).
16 The bottom product of the second distillation step is recirculated in the first step. Appropriate pumps permit to rise the pressure of the second bottom product from the pressure of the second step to the pressure of the first step.
The first and second distillation steps can be disposed in two distinct distillation towers, or in the same distillation tower having sections operating at different pressure (dual-pressure distillation column). Figure 1.4 by Pellegrini (2016), shows a simplified scheme of the DPLT distillation process.
Figure 1.4. Flow scheme of the DPLT distillation process (Pellegrini, 2014).
Chapter 1
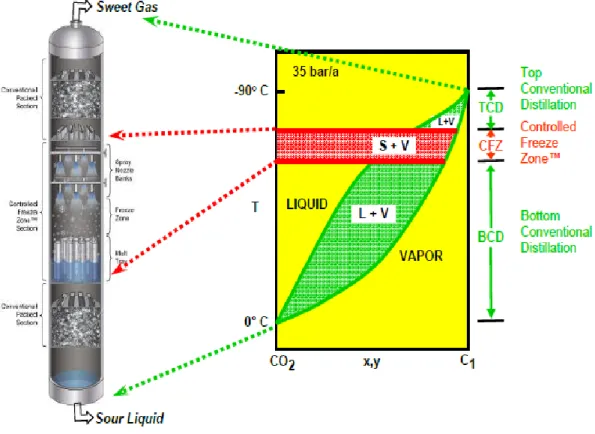
17 1.4.3 Controlled Freeze Zone™ (CFZ™)
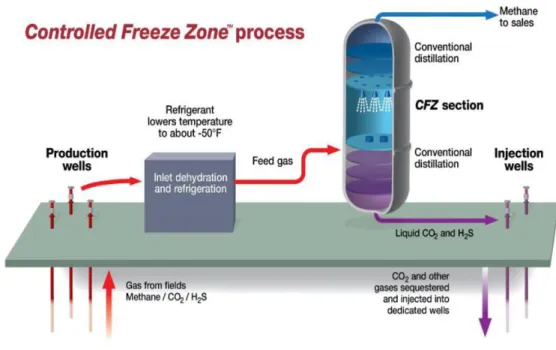
The main objective of the cryogenic distillation process described so far, is to obtain high purity methane avoiding the solidification of CO2 in the distillation tower. The CFZ™ is a process (Figure 1.5) developed by ExxonMobil (Valencia et al., 1985), and it consists of a single-step natural gas purification where the formation of solid CO2 is allowed in a specially designed section of the distillation tower. The CFZ™ process yields, as top product, to high-purity methane, and, as bottom product, to by-products consisting of acid gases present in the natural gas, which can be injected underground for geo-sequestration.
Figure 1.5. Simplified schematic of CFZ™ process by Valencia et al. (2014).
The CFZ™ tower consists of three sections: the CFZ™ section is the specially designed section where solid CO2 is allowed to form; the upper section is for rectifying the final gas product (rectifying section), a conventional distillation occurs for improving the quality of gas product to meet the restriction of acid gas content in gas of the downstream facilities; in the lower section a conventional distillation occurs for recovery or “stripping” valuable methane from the bottom stream consisting mainly of acid gases (stripping section). Figure 1.6 shows the relationship between the sections of the CFZ™ distillation tower and the phase diagram of the methane-CO2 mixture at a pressure of 35 bar.
18
Figure 1.6. Relationship between CFZ™ tower sections and methane-CO2 phase diagram by Valencia et al. (2014).
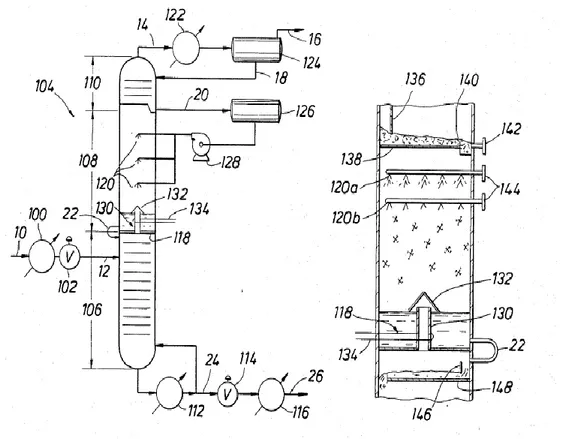
Figure 1.7 by Valencia et al. (1985) shows how the CFZ™ distillation tower is operated. The feed gas stream 12, after being cooled, is immitted in the stripping section where the vapors that form, ascend the tower encountering colder temperature till to have condensation and solidification of the CO2 in droplets within the CFZ™ section, then they consequently fall. The lighter components as methane and nitrogen ascend the tower till the top where they are partially condensed in the reflux condenser 122: the liquid stream 18 from the partial condenser is sent back to the rectifying section as reflux; the vapor stream 16 is the final product. The liquid stream 20 collected in the rectifying section of the CFZ™ tower is about to enter in solidification condition, and it is sprayed by nozzles 120 in the CFZ™ section of the tower, where the design of the section provides an unobstructed space allowing the CO2 to solidify and fall. As the solid droplets fall, they encounter warmer conditions and start to melt. The methane and other lighter components, if present, vaporize. In the tray at the bottom of the CFZ™ section, the temperature is maintained by an electric heater (134), above the CO2 melting point, and liquid CO2 is
Chapter 1
19 collected and fed to the stripping section. At the bottom of the stripping section, liquid CO2 is collected and re-boiled (112). The vapor from reboiler is sent back to the stripping section, the liquid bottom product stream 24 can be used elsewhere.
Figure 1.7. Schematic representation of a CFZ™ tower by Valencia et al. (1985).
The ExxonMobil’s Shute Creek Treating Facility near LaBarge, in the Wyoming, hosts a Commercial Demonstration Plant (CDP), which is widely discussed in the article by Valencia at al. (2014). Three feed streams are blended to provide flexibility in the testing. They are constituted by a methane stream (with a minor amount of nitrogen), an acid gas stream made of 1/3 of CO2 and 2/3 of H2S. The CFZ™ unit was tested for different combination of feed stream composition, characterized by a content of CO2 from 8 mol% up to 71 mol%. In all cases, the unit was successfully able to process the feed gas stream, giving a product with a content of CO2 well below the 2% necessary to meet the targeted pipeline quality.
20 The CDP has been operated at three distinct operating of pressures: at an operating pressure of 41 bar, it has provided a product with a content of CO2 below the 1% and with a temperature of about -86 °C; at an operating pressure of 38 bar, it has provided a product with a content of CO2 around 60 ppm, close to the quality required for LNG production (i.e., 50) ppm, the temperature of the product is evidently lower (i.e., about -89 °C); at an operating pressure of 36 bar, the content of CO2 in the product goes down to about 20 ppm meeting the required quality for LNG production, and the temperature of the product stream drops to about -90 °C. In all the tested cases, the content of H2S in the product stream is reduced to value well below the required 4 ppm (Valencia et al., 2014).
The solids formed in the CFZ™ section is pure CO2, thus providing higher separation factors and higher efficiency than a conventional vapor-liquid distillation process. Moreover, a specific study discussed by Valentia et al. (2014), in which for a gas feed stream composed of 68 mol% of CO2, 20 mol% of methane, 5 mol% of H2S (the remaining was non-hydrocarbons), showed that the CFZ™ technology had a CAPEX (CAPital EXpediture) estimation 5% lower than the Ryan-Holmes process and 10% lower than the Selexol process. In addition to that, another study, always discussed by Valencia et al. (2014), in which for a gas feed stream composed of 8 mol% of CO2 and 90 mol% of methane, showed that the CFZ™ technology had a CAPEX estimation 10% lower than conventional amine absorption.
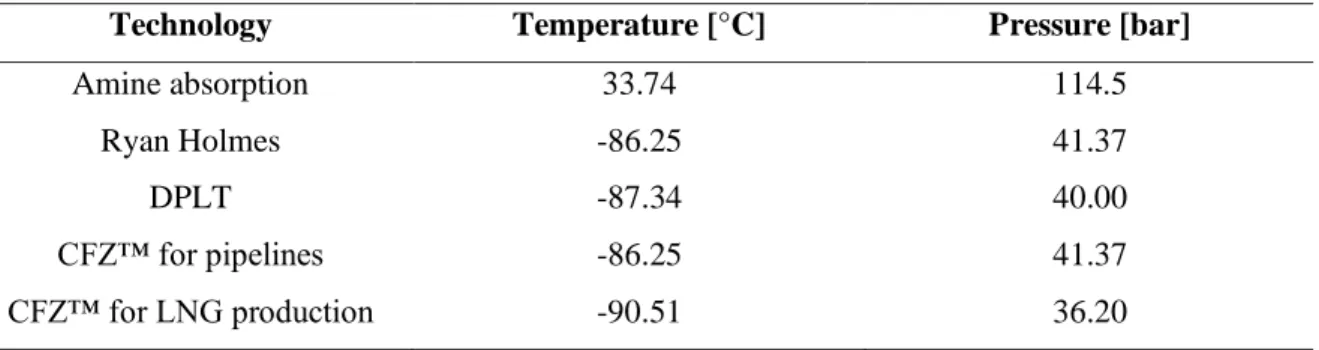
Table 1.4 summarizes typical values of temperature and pressure of the product stream of different purification methods reported in the papers by: Peters et al. (2011), Ryan and Homes (1982), Pellegrini (2014) and Valencia et al. (2014).
Table 1.4. Temperature and pressure of methane purified from acid gas by different purification technologies.
Technology Temperature [°C] Pressure [bar]
Amine absorption 33.74 114.5 Ryan Holmes -86.25 41.37 DPLT -87.34 40.00 CFZ™ for pipelines -86.25 41.37 CFZ™ for LNG production -90.51 36.20
Chapter 1
21
The main difference between a conventional amine absorption technology and a cryogenic distillation process is the temperature of the gas product stream that in the first case is close to the ambient temperature, while in the cryogenic distillation the product is obtained at cryogenic temperatures.
Table 1.5 compares the typical product stream composition of these acid gas removal technologies. As it can be observed in Table 1.5, the purified natural gas product by a conventional amine absorption process may have a higher content of heavy hydrocarbons than the natural gas product of a cryogenic distillation, and it can also contain water.
Table 1.5. Typical product composition of different acid gas removal technologies.
Amine
absorption
Ryan – Holmes DPLT CFZ™
Molar fractions [mol%]
Nitrogen - 16.3 - 1.198 Methane 79.5 81.64 99.98 98.39 CO2 0.5 1.7 0.02 0.414 H2S 5 x 10⁻⁹ 1 ppm 0.0000 0.0004 Ethane 9.8 - 0.0000 0.001 Propane 5.7 0.03 0.0000 - Butane 3.2 0.25 - - Pentane 0.7 0.05 - - Hexane 0.6 - - - H2O 0.1 - - -
In the following, some differences between a conventional amine absorption natural gas purification process and a cryogenic distillation are discussed.
- Gas stream dehydration: in a conventional process (i.e., amine absorption), it usually occurs after the acid gas removal unit, while for the cryogenic distillation it is necessary to have a dried gas stream to avoid ice formation in the tower.
22 - Precooling: in the cryogenic distillation, the feed gas stream is generally introduced in the tower at its dew point temperature or lower (that is at cryogenic temperature), and this may require a refrigeration cycle upstream the purification process.
- LNG production: the purified gas product must be cooled till liquefaction in a refrigeration cycle; if a cryogenic technology is adopted for purification, it is necessary to have a natural gas liquefaction cycle rationalized and optimized for a gas input at cryogenic temperature.
Nowadays, the natural gas liquefaction processes available on the marked have been designed to liquefy a gas stream deriving from a commercial natural gas purification process (i.e., amine absorption process). Because of the recent development of the more efficient cryogenic distillation technologies in the acid gas removal industry: the scope of this work is to rationalize and optimize some of the commercial liquefaction cycles in order to permit them to efficiently liquefy a gas stream deriving from a cryogenic distillation process.
23
Chapter 2: Production of Liquefied Natural Gas
The natural gas, after being purified, is sent to the downstream utilization facilities. The natural gas can be shipped to the final user via pipeline or it can be sent to an LNG production facility. Because of the growing of importance of the LNG for natural gas shipping industry in the recent years, liquefaction of natural gas plays a significant role in the natural gas trade.
The composition of the natural gas entering a liquefaction unit depends on the purification technology used upstream. If a conventional purification technology is used (e.g., chemical absorption with amines), the purified natural gas can still contain water and heavier hydrocarbons, so a dehydration unit is used upstream the liquefaction facility, and a natural gas liquids (NGLs) recovery unit within the liquefaction facility. If a cryogenic purification technology is used, the purified natural gas is almost pure methane, so no dehydration and NGLs recovery units are required in the liquefaction plant. With cryogenic distillation unit, the natural gas dehydration occurs upstream of the purification unit, and the NGLs recovery may be done upstream or downstream the CO2 removal unit.
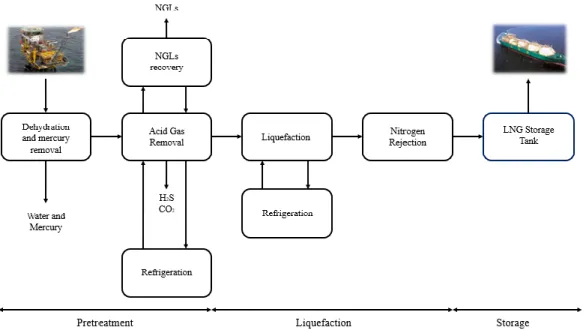
There are some differences in the scheme of the LNG production chain. Figure 2.1 shows the LNG production chain, if a conventional amine absorption process is applied for acid gas removal form raw natural gas. On the contrary, Figure 2.2 shows the LNG production chain if a cryogenic distillation process is applied for acid gas removal.
24
Figure 2.1. Conventional process for LNG production (Lim et al., 2013).
Figure 2.2. LNG production process if the cryogenic distillation is used for acid gas removal.
The natural gas liquefaction process occurs in a refrigeration cycle, where natural gas is cooled till liquefaction and expanded to atmospheric pressure obtaining liquefied natural gas at 1 atm and -162 °C. The process is highly energy intensive and costly: the cost of the natural gas liquefaction is the greatest in the value chain, accounting for more than 40% of the total cost. For this reason, the main effort of research is the development of more
Chapter 2
25 efficient refrigeration cycles that allow to reduce the impact of the cost of natural gas liquefaction on the LNG value chain.
2.1 Fundamental principles
The liquefaction of natural gas occurs by removing sensible heat over a wide range of temperature allowing the natural gas temperature reduction till two phases region. This requires a refrigeration cycle that uses one or more refrigerants.
The ideal refrigeration cycle and the temperature-entropy (T-s) diagram are shown in Figure 2.3. In step 1-2, the refrigerant evaporates in a heat exchanger absorbing heat at constant pressure and providing refrigeration. In step 2-3, the refrigerant is compressed in an adiabatic compressor at constant entropy. In step 3-4, the refrigerant vapor is cooled till saturation and condensed at constant pressure allowing the removal of heat from the cycle. In step 3-4, the refrigerant is adiabatically expanded at constant entropy (i.e., by means of an ideal turbine).
Figure 2.3. Ideal refrigeration cycle (left) and the T-s diagram (right).
From the thermodynamic laws, it is possible to derive the definition of the coefficient of performance (COPrev) of the reversible refrigeration cycle. Figure 2.4 shows a schematic of the energy flows in a reversible refrigerator. Ẇrev is the net power consumed by the reversible cycle; Q̇ is the heat power extracted by the refrigerant in process 1-2; Q̇0 is the heat power provided to the environment; T is the temperature of the cold side of the cycle;