DEPARTMENT OF CHEMISTRY
AND BIOLOGY “A. ZAMBELLI”
Ph.D COURSE IN CHEMISTRY
XXX CYCLE
Tutor:
Prof. Antonio Proto
Scientific Referee:
Prof. Riccardo Zanasi
Prof. Vincenzo Venditto
External Tutor:
Dr. Federica Camin
Ph.D Course Coordinator:
Prof. Gaetano Guerra
Ph.D student:
Concetta Pironti
Innovative applications of stable carbon isotope ratio
in environmental and food chemistry
Academic years 2016-2017
Ph.D student:
Concetta Pironti
88001000031
« Come un aquilone senza corda e
una farfalla senza ali, mia madre mi ha
insegnato a volare con i sogni »
2
Publications
R. Cucciniello, A. Proto, M. Ricciardi, C. Pironti, O. Motta. Il tesoro dei sottoprodotti di reazione: dalla 2-monocloroidrina agli additivi per benzine. Libro degli Abstracts XV Congresso di Chimica Dell’ambiente e Dei Beni Culturali SCI ISBN:978-88-86208-95-6.
C. Pironti, A. Proto, R. Cucciniello, O. Motta, F. Rossi. Monitoraggio ed arricchimento isotopico della CO2 in acque termali. Book of Abstracts XV
Congresso di Chimica Dell’ambiente e Dei Beni Culturali SCI
ISBN:978-88-86208-95-6.
A. Proto, R. Cucciniello, F. Rossi, C. Pironti, O. Motta. Determinazione simultanea di NOx in
atmosfera mediante l’impiego di un nuovo substrato per il campionamento attivo. Book of Abstracts XV Congresso di Chimica Dell’ambiente e Dei Beni Culturali SCI ISBN:978-88-86208-95-6.
I. Zarrella, R. Cucciniello, A. Proto, C. Pironti, O. Motta. Effetto antimicrobico della fase gas di formulazioni chimiche sui rifiuti domestici. Book
3 of Abstracts XV Congresso di Chimica Dell’ambiente e Dei Beni Culturali SCI
ISBN:978-88-86208-95-6.
R. Cucciniello, C. Pironti, C. Capacchione, A. Proto, M. Di Serio. Efficient and selective conversion of glycidol to 1,2-propanediol over Pd/C catalyst. Catalysis Communications (2016), 77, 98-102.
A. Proto, I. Zarrella, R. Cucciniello, C. Pironti, F. De Caro, O. Motta. Bacterial and fungicidal in the gas phase of sodium dichloroisocyanurate (NaDCC). Current Microbiology. (2016) 73,2,287-291.
C. Pironti, R. Cucciniello, A. Proto, I. Zarrella, O. Motta. Comparison of Isotopic Ratio Mass Spectrometry (IRMS), Non-Dispersive Infrared Spectroscopy (NDIRS) and Infrared Spectroscopy for the isotopic composition analysis of food. Book of Abstracts Workshop 1st IRMS Day, Fondazione Edmund Mach (2016) ISBN: 978-88-7843-046-4
C. Pironti, A. Proto, F. Camin, R. Cucciniello, I. Zarrella, O. Motta. FTIR and NDIRS as valuable
4 alternatives to IRMS for the δ13C analysis of food.
Talanta (2016), 160, 276-281.
C. Pironti, R. Cucciniello, I. Zarrella, O. Motta, F. Camin, A. Proto. 13C NMR Spectroscopy as valuable alternative for the δ13C determination of carbonates. Book of Abstracts Merck Young Chemists Symposium, 25-27 October (2016), Rimini (Italia).
ISBN: 978-88-86208-92-5
R. Cucciniello, M. Ricciardi, C. Pironti, C. Capacchione, A. Proto. Preparation of 1,2-propanediol through glycidol hydrogenolysis. Book of Abstracts Merck Young Chemists Symposium, 25-27 October (2016), Rimini (Italia). ISBN: 978-88-86208-92-5
R. Cucciniello, A. Proto, R. La Femina, C. Pironti, A. Farina, O. Motta. A new sorbent tube for atmospheric NOx determination by active
sampling. Talanta. (2017), 164, 403-406.
A. Proto, C. Pironti, R. Cucciniello, I. Zarrella, O. Motta, A. Picascia, F. Beneduce. Patent 2016 Miscela multi attiva inodore per la disinfezione e la sanificazione di piscine, acque reflue, superfici,
5 tessuti e vasche di lavaggio per la decontaminazione di animali da allevamento. C. Pironti, R. Cucciniello, F. Camin, A. Tonon,
O. Motta, A. Proto. Determination of the 13C/12C Carbon Isotope Ratio in Carbonates and Bicarbonates by 13C NMR Spectroscopy.
Analytical Chemistry (2017) 89, 11413-11418.
C. Pironti, R. Cucciniello, F. Camin, O. Motta, A. Proto. Determination of the Ggeographical origin of vanillin using δ13C analysis as discrimination tool. Book of abstracts 5 th MS Food Day, Bologna, October 11-13 (2017 )
ISBN: 978-88-90738-83-8.
Congress presentations
A. Proto, R. Cucciniello, F. Rossi, C. Pironti, O. Motta. Determinazione simultanea di NOx in
atmosfera mediante l’impiego di un nuovo substrato per il campionamento attivo. XV Congresso Nazionale di Chimica dell’Ambiente e dei Beni Culturali, 14-18 Giugno 2015, Bergamo I. Zarrella, R. Cucciniello, A. Proto, C. Pironti, O.
Motta. Effetto antimicrobico della fase gas di formulazioni chimiche sui rifiuti domestici. XV
6 Congresso Nazionale di Chimica dell’Ambiente e dei Beni Culturali, 14-18 Giugno 2015, Bergamo. C. Pironti, A. Proto, R. Cucciniello, O. Motta, F.
Rossi. Monitoraggio ed arricchimento isotopico della CO2 in acque termali. XV Congresso
Nazionale di Chimica dell’Ambiente e dei Beni Culturali, 14-18 Giugno 2015, Bergamo.
R. Cucciniello, A. Proto, M. Ricciardi, C. Pironti, O. Motta. Il tesoro dei sottoprodotti di reazione: dalla 2-monocloroidrina agli additivi per benzine. XV Congresso Nazionale di Chimica dell’Ambiente e dei Beni Culturali, 14-18 Giugno 2015, Bergamo.
C. Pironti, A. Proto, F. Rossi, R. Cucciniello, O. Motta, F. Camin. Analytical methods comparison for stable carbon isotope ratio determination in food and environmental samples. 15°EuCheMS International Conference on Chemistry and Environment, 20-24 Settembre 2015, Lipsia (Germania).
I. Zarrella, R. Cucciniello, C. Pironti, A. Proto, F. Rossi, A. Intiso, O. Motta. Miscele gassose per l’inibizione della crescita microbica nei rifiuti
7 domestici. Workshop Chimica, Ambiente e Territorio, 30 Settembre 2015, Caserta (Italia). R. Cucciniello, R. La Femina,F.Rossi, C.Pironti,
O.Motta, A. Proto. Nuove fiale adsorbenti per la determinazione di NOx in atmosferWorkshop Chimica, Ambiente e Territorio, 30 Settembre 2015, Caserta (Italia).
R. Cucciniello, M. Ricciardi, C. Pironti, A. Proto. Sintesi di additivi per carburanti mediante la conversione di 2-cloro-1,3propandiolo. Workshop Chimica, Ambiente e Territorio, 30 Settembre 2015, Caserta (Italia).
A. Intiso, R. Cucciniello, O. Motta, C. Pironti, A. Proto, F. Rossi. Transport properties of Trichloroethylene in water and micellar solutions. Workshop Chimica, Ambiente e Territorio, 30 Settembre 2015, Caserta (Italia).
C. Pironti, I. Zarrella, A. Proto, F. Rossi, A. Intiso, R. Cucciniello, O. Motta. Applicazioni di nuovi metodi analitici per la determinazione del rapporto degli isotopi stabili del carbonio in ambito ambientale ed alimentare. Workshop Chimica, Ambiente e Territorio, 30 Settembre 2015, Caserta (Italia).
8 C. Pironti, R. Cucciniello, A. Proto, I. Zarrella,
O. Motta. Comparison of Isotopic Ratio Mass Spectrometry (IRMS), Non-Dispersive Infrared Spectroscopy (NDIRS) and Infrared Spectroscopy for the isotopic composition analysis of food. The 1st Isotope ratio MS Day, 9-11 Maggio 2016, S. Michele all’Adige Trento (Italia).
C. Pironti, R. Cucciniello, O.Motta, I. Zarrella, L. Petretta, F. Camin, A.Proto. Applicazione delle tecniche spettroscopiche NDIRS, FTIR e 13C NMR per la determinazione del rapporto degli isotopi stabili del carbonio in campioni di interesse ambientale. XVI Congresso Nazionale di Chimica dell’Ambiente e dei Beni Culturali, 26-29 Luglio 2016, Lecce.
C. Pironti, R. Cucciniello, I. Zarrella, O. Motta, F. Camin, A. Proto. Application of FT-IR and NDIR spectroscopy for the isotopic composition analysis of food. 6th EuCheMS Chemistry Congress,11-15 Settembre 2016, Siviglia (Spagna).
C. Pironti, R. Cucciniello, F. Camin, A. Proto. Determination of 13C/12C carbon isotope ratio in carbonates and bicarbonates by 13C NMR
9 spectroscopy. NanoMeetsBio@Nanomates - 3rd Workshop on research at interface between bio-medical and nano-science, 16 Febbraio 2017, Salerno, (Italia).
L. Ferrero, G. Močnik, C. Rostagno, A. Proto, R. Cucciniello, C. Pironti, O. Motta, C. Rizzi, E. Bolzacchini. Aerosol behavior at the Museum of Last Supper of “Leonardo Da Vinci”: secondary formation and volatilization. European Aerosol Conference 2017, 27 Agosto-1 Settembre 2017, Zurich.
C. Pironti, R. Cucciniello, F. Camin, O. Motta, A. Proto. Carbon Isotope Ratio in Carbonates and Bicarbonates determinated by 13C NMR Spectroscopy. XXVI Congresso Nazionale della Società Chimica Italiana 10-14 Settembre 2017, Paestum.
C. Pironti, R. Cucciniello, D. Cespi, G. Matteucci, P. Rossini, F. Passarini, I. Zarrella, O. Motta, A. Picascia, A. Proto. LCA as suitable tool to improve industrial processes. XXVI Congresso Nazionale della Società Chimica Italiana 10-14 Settembre 2017, Paestum.
10 E. Bolzacchini, L. Ferrero, A. Proto, C. Pironti, R. Cucciniello, O. Motta, C. Rizzi, G. Močnik, L. Dall’Aglio, C. Rostagno. Particulate and gaseous indoor contamination at the Museum of “Last Supper” of Leonardo Da Vinci: results from one year of monitoring activity. XXVI Congresso Nazionale della Società Chimica Italiana 10-14 Settembre 2017, Paestum.
A. Proto, R. Cucciniello, C. Pironti, O. Motta. Gli isotopi stabili del carbonio per la valutazione della qualità dell’aria. Workshop Chimica per la Protezione dell’Ambiente, 28 Settembre 2017, Caserta (Italia).
12
Index
Index of figures
Index of tables
Glossary
Abstract
1. Introduction to stable carbon isotope ratio
1.1 Stable carbon isotopes fractionation in nature 1.2 Use of carbon isotope ratio as marker1.2.1 Food chemistry
1.2.2 Environmental and Cultural Heritage References
2. Aims of work
3. Experimental part
3.1 Determination of isotopic composition
3.1.1 Isotopic Ratio Mass Spectrometer IRMS 3.1.2 FTIR infrared-Spectroscopy Fourier Transform
3.1.3 NDIRS Non Dispersive Infrared Spectroscopy
3.1.4 NMR Spectroscopy
3.2 Determination of FT-IR and NDIRS analysis to food samples
13 3.2.1 Material and Methods
3.2.2 Statistical analysis 3.2.3 Results and discussion References
3.3 Development of 13C NMR method for bulk determination of isotope composition in carbonates samples
3.3.1 Material and Methods
3.3.2 Linear calibration and validation 3.4.3 Results and discussion
References
3.4 Application of isotope carbon ratio for Cultural Heritage
3.4.1 S. Pietro a Corte and Palazzo Fruscione, a part of SNECS project
3.4.2 Material and Methods 3.4.3 Results and discussion
3.4.4 Cenacolo of Leonardo da Vinci 3.4.5 Material and Methods
3.4.6 Results and discussion References
Conclusions.
Aknowledgements.
14
Index of figures
Figure Description Pag.
Figure 1. Examples of the types of fields using stable isotopes (from Z.D. Sharp
Principles of Stable Isotope Geochemistry 2017).
24
Figure 2. Carbon isotope composition of some natural substances.
26
Figure 3. Calvin cycle to fix CO2 for C3 plants
with expression of isotope fractionation.
28
Figure 4. Hatch-Stack cycle to fix CO2 for C4
plants with expression of isotope fractionation.
29
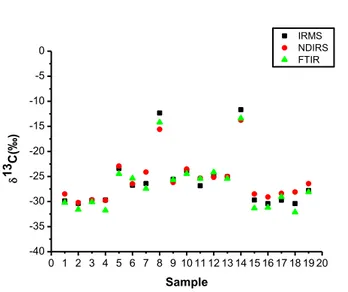
Figure 5. Summary of the delta values obtained by IRMS, NDIRS and FTIR.
67
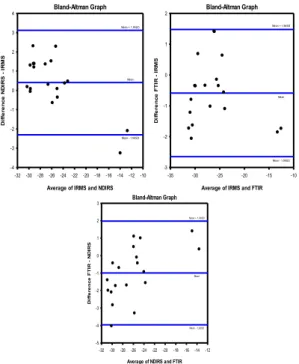
Figure 6. Linear regression line for the comparison between IRMS, NDIRS and FTIR.
65
Figure 7. Altman-Bland plot. The difference in the delta values versus the average of the data pairs.
69
Figure 8. Linear calibration plot between the
13C/12C ratio obtained by 13C-NMR
and the δ13C (‰) obtained by IRMS.
15
Figure 9. 13C NMR spectrum of oxalic acid ( ) IAEA-C8 (International reference material for stable isotopes) in D2O
with CH313CO2Na (●) and relaxation
agent Cr(acac)3 .
85
Figure 10. a) Paintings in S. Pietro a Corte with
salt deposits; b) the first level of church with external sewer c) white powder deposits in S. Pietro a Corte.
94
Figure 11. Ion chromatography of powder salt
deposits.
98
Figure 12. Ion chromatography of water in first
level of S. Pietro a Corte.
98
Figure 13. Map of the refectory of Santa Maria
delle Grazie in Milan.
16
Index of tables
Table Description Pag.
Table 1. List of the current stable isotope ratio standard methods.
36
Table 2. Detailed description of samples used for
the δ13C analysis. 62
Table 3. δ13C values resulting from three different
techniques. 64
Table 4. Longitudinal relaxation times of carbonates and bicarbonates obtained by the inversion-recovery sequence at 600 MHz.
78
Table 5. 13C NMR chemical shifts and isotope
ratio obtained by δ13C analysis*. 82
Table 6. Comparison of δ13C value obtained. 82
Table 7. Concentrations of pollutants during and
after cultural events.
95
Table 8. Atmospheric concentration of pollutants
in S. Pietro a Corte.
97
Table 9. δ13C (‰) value obtained from passively collecting.
104
Table 10. δ13C (‰) value obtained from active collecting.
17
Glossary
AOAC Association of Official Analytical Chemists
ATP Adenosine Triphosphate
CAM Crassulacean acid metabolism
D1 Pulse intervals of spectra
EA Elemental Analyser
EC European Commission
EEC European Economic Community
ENV-CEN European Committee for Standardisation
EU European Union
FAO Food and Agriculture Organisation
FT-IR Fourier Transform Infrared
IOC International Olive Council
IAEA International Atomic Energy Association
IRMS Isotope Ratio Mass Spectrometry
OIV International Organization of Vine and Wine PDO Protected Designations of Origin
PGI Protected Geographical Indication
13C/12C The ratio of the isotope of carbon with atomic
mass 13 to the isotope of carbon with atomic mass 12
18
δ13C‰ Isotope value refer to the international standard Vienna-Pee Dee Belemnite.
15N/14N The ratio of the isotope of nitrogen with
atomic mass 15 to the isotope of nitrogen with atomic mass 14
δ15N‰ "Delta nitrogen-1515N/14N per mil". The ratio expressed to the international standard N2
NADP Nicotinamide Adenosine Diphoshate
NIOSH National Institute for Occupational Safety and Health, the United States federal agency for research and prevention of work-related injury and illness
NDIRS Non-Dispersive Infrared Spectroscopy
NMAM The analytical methods were reported in the manual of NIOSH
OAA Oxaloacetic Acid
PEP Phosphoenolpyruvate
PGA Phosphoglycerate
PGAL 3-Phospho-glyceraldehyde
RuDP Ribulose-1,5-diphosphate
R Ratio between the heavier isotope and the lighter one
SNIF 2H NMR
Site Specific Natural Isotope Fractionation Nuclear Magnetic Resonance spectroscopy
T1 relaxation time
TSG Traditional Speciality Guaranteed
V-PDB Pee Dee Belemnite - Calcium carbonate used as an international standard for δ13C‰ scale
20
Abstract
In the last year, the stable isotope ratio analysis has become a useful tool with many applications in different scientific area. In particular the characteristic isotope signature of materials has permitted to identify authenticity and traceability of food sample and isotope composition has become a valuable marker in environmental studies. This work shows the applicability of analytical methods for isotopic carbon determination in food and environmental samples and the innovative use of δ13C in cultural heritage as valuable tool to trace pollutant fate. The first part is dedicated to the improvement of spectroscopic methods as Fourier Transform Infrared (FT-IR) and Non-Dispersive Infrared spectroscopy (NDIRS) and their application to identify geographical origin in sample like pasta, cocoa, olive oil. The results conducted in order to assess the robustness of the two alternative methods respecting IRMS showed a strong correlation like a demonstration of the positive relationship between the tested analytical methods. A new method was developed 13C NMR spectroscopy to determine the bulk 13C/12C carbon isotope ratio of inorganic carbonates and bicarbonates at natural abundance. In literature the use of 13C NMR spectroscopy
21 was focused on 13C position-specific isotope analysis of organic molecules; in this work it was reported the improvement of NMR methodology able to obtain stable carbon isotope ratio in bulk material using an internal standard.
The last part of project has regarded the application of isotope analysis to environmental studies and in the field of cultural heritage. The study was focused on identification of carbon dioxide sources thanks to stable carbon isotope composition and on correlation of carbon dioxide δ13C value with presence of visitors and others pollutants such as NH3, NO2, BTEX, H2S, SO2.
In fact the carbon isotope composition of carbon dioxide captured by passive sampler using a Ca-based solid absorbent (CaO/Ca12Al14O33 75:25 w/w) was analysed in
three different archaeological places: Fruscione Palace and S.Pietro a Corte in Salerno (part of SNECS project), at The Last Supper of Da Vinci museum in Milan. The results of the isotope composition of CO2 correlated with
the variation of concentration in the air have proved to be a valid tool to follow the flux of people in the different area of museum and it could be used as a non-invasive marker for monitoring of filtering system.
22
Introduction to stable carbon isotope ratio
“…the masses of the elements are approximately
expressed by whole numbers, where oxygen is taken as 16-with the exception of hydrogen itself. But the real interest, as we now see it, is not the whole number rule itself, but rather the departures from it. ” Rutherford et
al. 1929 talking about the experiments of F.W. Aston on masses measurements.
The first discovery of two isotopes of Cl was published by F.W. Aston, who has measured the atomic weight of chlorine by a different method and found substances with atomic weights of 35 and 37. Although other important scientists including J.J. Thomson, E. Rutherford, F. Soddy and J. Chadwick, G. Gamow were studying on masses of elements, this was the first evidence of two isotopes. The general assumption was that the isotopic compositions were homogeneously distributed throughout all substances; until 1925 was demonstrated that physical chemical processes could cause isotopic fractionation of light elements in natural substance.1 During this period, Harold Urey (Nobel Prize in chemistry in 1934 for discovery of deuterium) sponsored his result on calculations about the isotopic fractionation using stable
23 isotope ratios of the light elements defined by mass spectrometer travelling to several important universities in Europe.2 These studies had permitted to use stable isotope measurements in a wide range of applications, first of all for geochemistry studies and kinetic ratios of geochemical systems: crystal growth and mineral recrystallization; equilibrium and kinetic processes evaporation of water; different incorporation of CO2
during photosynthesis.3,4,5 The principle was that there was a preferential fractionation of isotopes, with incorporating preferentially in one phase the heavy (or light) isotope relative to other coexisting phases. In last year the analytical instrumentation has been developed thanks to more sensibility and high precision of isotopic analysis about traditional elements such as H, C, N, O, S, which also had permitted to introduce the analysis of additional elements B, Cl, Si, Li, Mg, Ca, Cr, Fe, Cu, Zn, Se, and Mo. The most of natural materials contain one or more of these elements; therefore, stable isotopes ratio became a chemical parameter with important applications in various fields and types of scientific researches. For example, the carbon isotope composition was a useful tool in environmental sciences to monitor climate change7, 8 and the environmental impact on the
24 environment9. The carbon isotope composition has also found the extensive use in archaeological studies10-13 as well as in geochemical studies to monitor volcanic activity14 and also in noninvasive medicine tests to test the presence of Helicobacter pylori infection15, 16.
Figure 1.Examples of the types of fields using stable isotopes (from
Z.D. Sharp. Principles of Stable Isotope Geochemistry 2017).
The study of the isotopic delta was considered of great importance also in the field of forensic science17 and food sciences18 to distinguish the presence of natural and synthetic substances of some ingredients or to trace the
25 origin product. This was possible because the value of the
13C / 12C and the isotopic composition of plants and their
products were linked to the photosynthetic fixation of atmospheric carbon dioxide in organic compounds.
The carbon isotope ratio was expressed in δ‰ relative to V-PDB (Vienna-Pee Dee Belemnite), according to the following IUPAC protocol:
δ = (Rsample – Rstandard)/Rstandard
where R is the ratio between the heavier isotope and the lighter one.
1.1 Stable carbon isotopes
fractionation in
nature
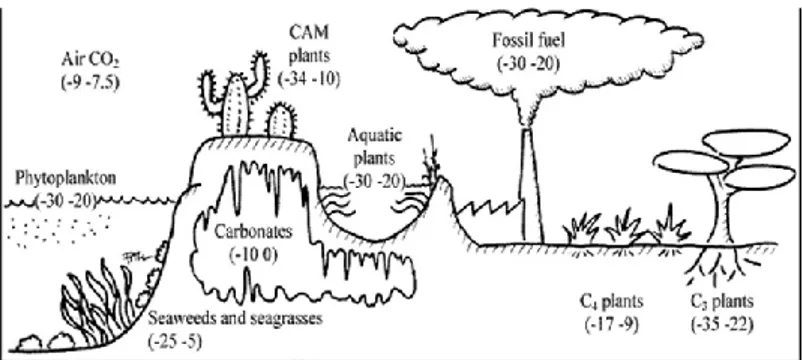
Atmospheric carbon dioxide contains approximately 1.1% of isotope13C and 98.9% of 12C. In the absence of human activity (industrial, agricultural, cities centers, etc), the δ13C value of atmospheric CO2 is -8‰, while was slowly
becoming more negative in the cities due to the high number of vehicles and to combustion of fossil fuel (δ13C for fossil fuel is approximately -30‰).19 In literature was reported the influence of environment and single processes on isotope carbon fractionation: for example, there were three classes of plants (C3, C4 and CAM) with
26 process and carbon dioxide storage; or stable carbon isotope ratio of carbonates influenced by the presence of carbon dioxide gas phase and some ion such as Magnesium, silicates, phosphates during growing process (dolomite, travertine, etc).
Figure 2.Carbon isotope composition of some natural substances.
During photosynthesis plants discriminated against 13
C-12C due to small differences in chemical and physical
properties influenced by the difference in mass. This discrimination could be used to identify various photosynthetic groups of plants. The most important reactions used by plants to fix CO2 follow the C3 and C4
pathways.20 Plants C3 have used the Calvin cycle for CO2
fixation and their carbon isotope compositions were in the range of -34 to -22 ‰.
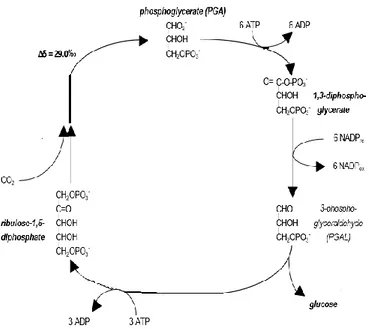
27 concentration of carbon dioxide more than 50 ppm, the plants have used the Calvin cycle and CO2 was fixed as
molecules with three atoms of carbon (phosphoglyceraldehyde (PGAL) first sugar of photosynthesis), as showed in Figure 3. After the formation PGAL was used to produce others organic compounds: to synthesize ribulose bisphosphate carboxylase (RuDP) thanks to a series of complex reactions driven by adenosine triphosphates (ATP); to synthesize the end product of photosynthesis, glucose. The initial reaction of CO2 with RuDP has produced an
enrichment of 13C isotope associated with kinetic and equilibrium effects of process, even if the final δ13C‰ value of plant was influenced temperature, fertilization, salinity, CO2 concentration, light intensity and
photorespiration. In fact it was possible to distinguish the same plants from different countries of world: the δ13C‰ value of Italian wheat was different from the Australian one.
28
Figure 3.Calvin cycle to fix CO2 for C3 plants with expression of
isotope fractionation.
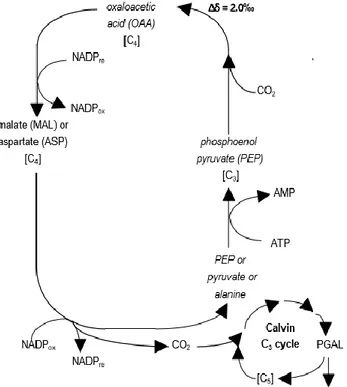
C4 plants have consisted of many tropical plants,
including, for example, cane and cane sugar, using the Hatch-Stack cycle and had a higher isotopic delta value than C3 plants. In this case, as reported in Figure 4., the
plants could fix the carbon dioxide at low concentrations and in presence of high level of oxygen: carbon dioxide reacted with phosphoenolpyruvate to form oxaloacetic acid (OAA), a four carbon compound. The first step of reaction has produced lower 13C isotope enrichment, about 2.0 ‰. OAA was reduced to form malate or
29 aspartate; it could then oxidize to form a compound with three carbons and CO2, which started the Calvin cycle to
synthesize glucose.
Figure 4.Hatch-Stack cycleto fix CO2 for C4 plants with expression
of isotope fractionation.
Another group of plants uses Crassulacean acid metabolism (CAM) as a photosynthetic pathway and their isotopic composition falls in the range of -33/ -11 ‰.21 The most famous plants were vanilla, pineapple, agave
30 and they used an improvement C3 mechanism: during the
night stomata were open and CO2 was fixed as organic
acids and stored in vacuoles; during the day when the stomata were closed to avoid the water loss, the plants used and the storage of high concentrations of organic acids and released the carbon to permit the photosynthesis. In summary, during the night the plants followed the Calvin cycle, while during the day used the same mechanism of C4 plants; although the δ13Cvalue had
a widely range influenced by local climatic conditions and if in some cases was predominant C3 or C4 pattern.
Thus the analysis of δ13C composition of specific compounds had permitted to distinguish between C3 and
C4 plants, to evaluate the presence of natural and
non-natural additives used, and thus to certify the quality and purity of the analyzed samples. In the same way different carbon isotope ratio was considered in geochemistry samples, such as carbonates, to obtain information about groundwater and soil. Several studies have analyzed both aqueous and solid-phase components of terrestrial groundwater and results have indicated that the primary controls on precipitation of carbonates were a combination of water parameters such as pH,[HCO3-],
31 degassing, steaming, evaporation, and dilution), hydrology and biotic activities.22, 23, 24
32
1.2 Use of carbon isotope ratio as marker
33
1.2.1 Food chemistry
The safety and the authenticity of food was a critical point for consumers that come in contact with a wide variety of food from around the world. The General EU Food Regulation introduced criteria to identify safe or unsafe food and feed and only the safe food can be placed on the Union market. The public sensitivity was also influenced by some food scares and international scandals about products on market, such as the eggs contaminated by pesticide or presence of adulterants in olive oil, fruits juice and honey. For this reason European Union instituted a Traceability Regulation (178/2002/EC) which defined “food and feed traceability.” Moreover, one of the most important problems of industries was the requirement to protect against mislabeling the products manufactured according to rigorous criteria to guarantee the quality, safety and respect for the environment. These types of foods were certificated through Protected Geographical Indications (PGI), Protected Designations of Origin (PDO), and Traditional Specialties Guarantee (TSG), defined by European laws EC N. 510/2006 and 1151/2012. The authenticity of foods was identified
34 uncovering mislabeling of foods, substitution with cheaper ingredients or using adulterants, incorrect origin (such as geographical), species, or production method. In recent year the food industry needs international validated methods to screen food samples, to provide proof of authenticity and originality of food samples. Among the exploitable techniques stable isotope ratios analysis (SIRA), measured using isotope ratio mass spectrometry (IRMS), has taken on increasing importance in determining the authenticity of foods of animal origin for producers and control agencies. In the study of the geographic origin of food products25-28 giving the possibility for testing food authenticity29 - 31, quality and typicality 32 -34, carbon isotope ratio has permitted to obtain specific information particularly when conventional analytical methods cannot provide unambiguous results.
For example, it was possible to identify the presence of natural or non-natural fatty acids in samples of chocolates and to discriminate about quality and origin of sample. The different origin and types of fatty acids in cocoa butter have been studied and classified by stable carbon isotopes analysis. In previews studies the δ13C value of cocoa butter was influenced by the presence of other
35 vegetable fats and by thermal or oxidative degradation processes during production (eg drying and roasting cocoa beans or the treatment of butter deodorization obtained from pre-tasting) or conservative process of cocoa butter and the other products (eg chocolate).35 The evaluation of the carbon 13C / 12C isotopes ratio has also be used to characterize principal components of olive oil, 36 honey37 and fruit juice38.
Polyunsaturated fatty acids have become important natural additives with benefits for brain function and cardiovascular health. In literature was reported the addition of Omega-3s in conventional foods, including bread, milk, yogurt, pastry products and oil.39 The carbon isotope analysis can also be applied to evaluate and quantify the omega-3s integrated into foods. At the same time, stable carbon isotope ratio was recognized a valid tool to evaluate the quality and the origin of durum wheat; this analysis has also been applied to monitor variations during the cooking process as well as to verify variations in composition of wheat.
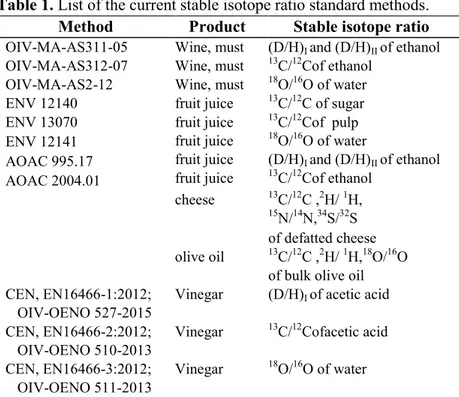
The analytical methods used for stable isotope ratio were reported in Table 1. and there were only the isotopic methods that have been recognized according to EU Regulation for the detection of frauds. The laboratories,
36 which intend to verify the authenticity and originality in food samples, must use methods agreed in national legislation or in the absence of the rules other methods in accordance with scientific protocol.
OIV: International Organization of Vine and Wine. ENV-CEN: European Committee for Standardisation. AOAC: Association of Official Analytical Chemists. IOC: International Olive Council.
The Isotope Ratio Mass Spectrometry (IRMS) is the method of choice for the 13C measurements in terms of δ13C thanks to highly sensitive, up to 0.01‰.40 However
Table 1. List of the current stable isotope ratio standard methods.
Method Product Stable isotope ratio
OIV-MA-AS311-05 Wine, must (D/H)I and (D/H)II of ethanol
OIV-MA-AS312-07 Wine, must 13C/12Cof ethanol
OIV-MA-AS2-12 Wine, must 18O/16O of water ENV 12140 fruit juice 13C/12C of sugar
ENV 13070 ENV 12141 AOAC 995.17 AOAC 2004.01 fruit juice fruit juice fruit juice fruit juice 13C/12Cof pulp 18O/16O of water (D/H)I and (D/H)II of ethanol 13C/12Cof ethanol cheese 13C/12C ,2H/ 1H, 15N/14N,34S/32S of defatted cheese olive oil 13C/12C ,2H/ 1H,18O/16O
of bulk olive oil CEN, EN16466-1:2012;
OIV-OENO 527-2015
Vinegar (D/H)I of acetic acid
CEN, EN16466-2:2012; OIV-OENO 510-2013
Vinegar 13C/12Cofacetic acid CEN, EN16466-3:2012;
OIV-OENO 511-2013
37 it was equally expensive system and new cheaper methods have been designed as alternatives to the IRMS for the 13C analysis.41 In comparative studies was shown the reliability of alternative technique in measuring 13C enrichment, due to be considered as a valid alternative to IRMS such as the use of NDIRS an accuracy of ±0.4‰.
42-43 Moreover, spectroscopic methods proposed were
based on the principle that substitution of 13C and 12C affected the distribution of vibrational and rotational energy of molecule and each distinct isotopomer of carbon dioxide has its own rotational - vibrational infrared spectrum. However, during experimental acquisition the peaks of isotopomers were overlapped and it was very difficult measure the contribution for each molecule. In the recent works, Kidness and Marr reported the measurement of δ13C by using Fourier Transform Infrared Spectroscopy, utilizing high-resolution spectrometers (0.25 cm-1, and 1 cm-1 at elevated sample pressures) obtained an accuracy of ±12‰ and ±8‰.44, 45 During PhD project was improved FTIR (Fourier Transform Infrared) analysis for food samples. The spectroscopic method used was developed by the group of Prof. Antonio Proto: CO2 was absorbed into polystyrene
38 bands for the ν3 antisymmetric stretching mode of both
12CO
2 and 13CO2 isotopomers.46This method has
permitted to avoid overlapping of peaks and the good resolution was a result of the reduction in the rotational mode of CO2 due to the interaction with the aromatic ring
of polystyrene. By this way was obtained an accuracy of ±2.5‰. 46 In a previous work it was compared NDIRS and FTIR with IRMS for determination of 13C-urea breath test in the non-invasive diagnosis of Helicobacter pylori infection15 showing that FTIR and NDIRS methods were as well as valid and accurate analytical tool to obtain a highly specific measurement of 13C enrichment in breath samples and to discriminating between infected and non-infected subjects. Moreover, on the grounds of previews results, one of the aims of PhD project was the improvement of FT-IR and NDIRS methodology for identification of isotopic composition of food samples. The aim was focused not only the analytical methods but also on the preparation of sample to put out an easy and low cost protocol for isotopic analysis of foods. On the other hand, the research was based on development of new independent methodologies for δ13C analysis able to validate the accuracy obtained by using the reference method such as IRMS. In this case, it was introduced 13C
39 NMR spectroscopy to calculate bulk δ13C in inorganic carbonates and bicarbonates.
NMR spectroscopy was the official method applied by the OIV (International Organization of Vines and Wine) and by the European Commission to certify the presence of added sugar to wine.47, 48 In particular SNIF 2H NMR (Site Specific Natural Isotope Fractionation Deuterium Nuclear Magnetic Resonance spectroscopy) has been used to measure the site-specific isotope ratios of D/H at natural abundance to control the origin of commercial products and to understand metabolic pathways. The advantage of SNIF 2H NMR was the identification of isotope contribution for each atom of molecules to have a complete information about samples; however has required large amounts of products, long time of analysis and only molecules with low molecular weight could be analysed.
In the last years, irm-13C NMR spectroscopy was developed to conduct 13C position-specific isotope ratio monitoring to analyse pharmaceutical, flavours and environmental samples with a precision better than 1‰.49 In literature Bayle and co-workers have reported the identification of geographic origin of vanillin and discrimination of its on the basis of the 13C isotopic
40 profiles.50 However, irm-13C NMR is not directly linked to international standards as required by EU Regulation and bulk δ13C values from IRMS analysis was necessary to obtain the reduced molar fraction (fi/Fi) of 13C used to
the site-specific δ13C values for each carbon in a target molecule.
So during the project 13C NMR spectroscopy was improved to determine the bulk 13C/12C carbon isotope ratio of inorganic carbonates and bicarbonates at natural abundance without IRMS analysis. Bayle and co-workers determined δ13C using an dimethylsufone as internal standard, while in this case was evaluated sodium acetate as internal standard and all parameters important to obtain quantitative and accurate analysis of carbon isotope ratio in bulk material.50
41
1.2.2 Environmental and Cultural Heritage
42
1.2.2 Environmental and Cultural Heritage
In environmental sciences, the understanding of the origin and the evolution of contaminants was necessary for the decisions that must be taken by industrial companies and international agencies of healthy. The identification of the pollution sources in industrial site and the remediation activities, with possible temporary closure of industrial production, had a significant impact on the economy of the company. This problem carried out the requirement of appropriate tools, such as stable isotope ratio, to identify pollutants and their sources as well as to verify the performance of the proactive actions on the industrial sites.
The carbon isotope ratios of pollutants were analysed by an isotope ratio mass spectrometer coupled via a combustion interface to a gas chromatograph (GC-IRMS)51 or recently 2HNMR spectrometry has been applied for recognize degradation of gasoline additives in groundwater. The growth in level of carbon dioxide in the atmosphere has raised much interest in the chemical and physical implications of carbon sequestration. The mitigation of impacts of greenhouse gases on global warming was one of the most important aims of
43 International Organization, as showed during Climate Change Conference in Paris in 2015. In urban environments, carbon dioxide was emitted from different anthropogenic and biogenic sources, for this reason stable isotope analyses was a powerful tool for identification and for classification of the source of CO2.52, 53In some
scientific works the isotopic composition of CO2 was
used to assess sources at local scale to discriminate emissions from vehicles from emissions generated by the biological activity in the urban areas.54, 55 One the other hand the disadvantage of this technique was that δ13CO2
value was often influenced by spatially and temporally specific parameters. In the paper of A. Proto the isotopic ratio δ13CO2 has been used as marker of carbon dioxide
collected in three different area: a rural area where there were essentially plants and the contribution of carbon dioxide emission was attributed to sparing process of plants and δ13C values ranging between −18.5 and −27‰; in urban environment δ13C varying from −25.6 to −35‰ and the most important source was the combustion processes of fossil fuels; in civil inhabitation, near a kitchen, the burning of methane and other hydrocarbons was the source and stable carbon isotope value was from −40 to−45‰.53 This studies have showed the reliability of
44 δ13C values as environmental tool to for identification of pollutants. Moreover, many studies were focused on sequestration of carbon dioxide and in particular geological storage was one of the most promising: CO2
was captured, pressurized and pumped deep underground into geological formations. In this case was fundamental the studies on mineral carbonation reactions and the reactivity in aqueous solution, identification and characterization reaction products. NMR spectroscopy has been used as an ideal tool to study reaction of CO2 in
geologic formations, Diefenbacher and co-workers56 have developed a methodology able to study the storage reaction in a water solution, at elevated pressure and temperature. Surface and others have also performed an
in-situ measurement of MgCO3 in the same condition of
CO2 sequestration in the presence of Mg(OH)2.57 13C
NMR spectroscopy was also attractive as quantitative, nondestructive, atom-specific spectroscopic method for the determination of [CO2]/[HCO3-] and [HCO3-]/[CO32-]
ratios.58 Solid-state 13C NMR studies have also demonstrated that this methodology could be used as efficient tool to quantitatively distinguish and characterize magnesium carbonate phases, such as magnesite, hydromagnesite, dypingite and nesquehonite, with small
45 structural.59
Thus, considering the high potential of NMR spectroscopy it was potentially applicable in material research studies of cultural heritage artefacts (carbonates, bicarbonates, marbles, salts etc.).60
46
References
1. Z.D. Sharp. Principles of Stable Isotope Geochemistry 2017.
2. H.C. Urey. J. Chem. Soc. (1947) 562-581.
3. S. Epstein, R Buchsbaum, H. Lowenstam, H.C. Urey, J.
Geol. (1951) 62, 417-426.
4. P. Baertschi. Nature (1951) 168, 288.
5. H. Craig. Geochim. Cosmochim. Acta, (953) 3, 53-92. 6. F. Camin, M. Boner, L. Bontempo, C. Fauhl-Hassek, S. D. Kelly, J. Riedl, A. Rossmann. Trends in Food Science &
Technology (2017) 61, 176-187.
7. M. Stuiver, T.F. Braziunas. Nature (1987) 328, 58-60. 8. R.J. Francey, P.P. Tans, C.E. Allison, I.G. Enting, J. W. C White, M. Trolier. Nature (1995) 373, 326–330.
9. H. Friedli, H. Lötscher, H. Oeschger, U. Siegenthaler, B. Stauffer. Nature (1986) 324, 237-38.
10. R.P. Evershed, K.I. Arnot, J. Collister, G. Eglinton, S. Charters. 1994. Analyst (1994) 119, 909–14.
11 H.P. Schwarcz. J. Archaeol. Sci.(1991) 18, 261–275. 12. A.W. Stott, R.P. Evershed. Anal. Chem. (1996) 68, 4402–8. 13. C. Scarabino, C. Lubritto, A. Proto, M. Rubino, G. Fiengo, F. Marzaioli, I. Passariello, G. Busiello, A. Fortunato, D.
47
Alfano, C. Sabbarese, D. Rogalla, N. De Cesare, A. D’Onofrio, F. Terrasi. Isot. Environ. Healths (2006) 42, 151-158.
14. A. Castrillo, G. Casa, M. van Burgel, D. Tedesco, L. Gianfrani. Opt. Express. (2004) 12, 6515–23.
15. O. Motta, F. De Caro, F. Quarto, A. Proto. Journal of
Infection (2009) 59, 90-94.
16. F. Parente, G. B. Porro. Eur. J. Gastroen. Hepat. (2001) 13, 803–6.
17. M. Desage, R Guilluy, J.L. Brazier, H. Chaudron, J. Girard, H. Cherpin, J. Jumeau. Anal. Chim. Acta (1991) 247, 249–54. 18. F. Camin, D. Bertoldi, A. Santato, L. Bontempo, M. Perini,L. Ziller, A. Stroppa and R. Larcher. Rapid Commun.
Mass Spectrom. (2015) 29, 415–423
19. A. Proto, R. Cucciniello, F. Rossi, O. Motta. Environ. Sci.
Poll. Res.(2014) 21, 3182-3186.
20. M.H. O'Leary. Bioscience (1988) 38, 328-336.
21. F.J. Winkler Chromatography and mass spectrometry in
nutrition science and food safety, (Eds: A. Frigerio, H. Milon),
Elsevier Science Publishers BV, Amsterdam, 1984.
22. R. Amundson, E. Kelly. Geochim. Cosmochim. Ac. (1987) 51, 2883–2890.
23. H.S. Chafetz, P.F. Rush, N.M. Utech. Sedimentology (1991) 38, 107–126.
48
Sturchio,P. C. Burs, M. K. Discipulo. J. Sediment. Res. (2000) 70, 565–585.
25. M. A. Brescia, G. Di Martino, C. Guillou, F. Reniero, A. Sacco and F. Serra. Rapid. Commun. Mass. Spectrom (2002) 16, 2286-2290.
26. J.P. Renou, G. Bielicki, C. Deponge, P. Gachon, D. Micol, P. Ritz.FoodChem. (2004) 86, 251-256.
27. O. Schmidt, J.M. Quilter, B. Bahar, A.P. Moloney, C.M. Scrimgeour, I.S. Begley, F.J. FoodChem. (2005) 91, 545-549. 28. M. A. Brescia, D. Sacco, A. Sgaramella, A. Pasqualone, R. Simeone, G. Peri, A. Sacco. Food Chemistry (2007) 104, 429– 438.
29. J. E. Spangenberg, S. A. Macko, J. HunzikerJ. Agric. Food
Chem. (1998) 46, 4179-4184
30. E. Piasentier, R. Valusso, F. Camin, G. Versini, Meat Sci. (2003) 64, 239-247.
31. M. Boner, H. Förstel. Anal. Bioanal. Chem. (2004) 378,301-310.
32. J. Bricout and J. Koziet J. Agric. Food Chem. (1987) 35, 758-760.
33. A. Faberi, R.M. Marianella, F. Fuselli, A. La Mantia, F. Ciardiello, C. Montesano, M. Mascini, M. Sergi and D. Compagnone. J. Mass Spectrom. (2014) 49, 840–849.
49
34. R. Redondo, J.G. Yélamos. Food Chemistry (2005) 92, 507–514.
35. J.E. Spangenberg, F. DionisiJ. Agric. Food Chem. (2001) 49, 4271-4277.
36. F. Angerosa, L. Camera, S. Cumitini, G. Gleixner, and F. RenieroJ. Agric. Food Chem. (1997) 45, 3044-3048.
37.A. Schellenberga, C. Schlicht, F. Camin, M. Perini, L. Bontempo, K. Heinrich, S.D. Kelly, A. Rossmann, F. Thomas, E. Jamin, M. Horacek. Food Chem. (2010) 12, 770-777. 38. F. Camin, M. Perini, L. Bontempo, S. Fabroni, W. Faedi, S. Magnani, G. Baruzzi, M. Bonoli, M.R. Tabilio, S. Musmeci, A. Rossmann, S.D. Kelly, P. Rapisarda. Food Chem. (2011) 125, 1070–1082.
39. L.Phuong Mai, C. Fraser, G. Gardner, W.W. Liang, J. A. Kralovec, S. C. Cunnane, A. J. Windust. Anal. Bioanal. Chem. (2007) 389, 241–49.
40. B. Fry, Carbon isotope techniques; Academic Press Inc.: San Diego, 1991.
41. D. Weidmann, C. B. Roller, C. Oppenheimer, A. Fried, F. K.Tittel, Isotop. Environ. Health Stud. (2005) 41, 293-302. 42. F. Jäger, G.Wagner, H.A.J.Meijer, E.R.T.Kerstel, Isotop.
Environ. Health Stud. (2005) 41, 373-378.
43.P. Hildebrand, C. Beglinger. Clinical Infectious Diseases (1997) 25, 1003-1005.
50
44. A. Kidness, I.L. Marr. Analyst (1996) 121,205-209.
45. A. Kidness, I.L. Marr. Applied Spectroscopy (1997) 51, 17-21.
46. R. Zanasi, D. Alfano, C. Scarabino, O. Motta, R.G. Viglione, A. Proto. Anal. Chem. (2006) 78, 3080-3083.
47. M. L. Reid, C.P. O’Donnel, G. Downey, Trends in Food
Science and Technology (2006) 17, 344-353.
48. N. Dordevic, F. Camin, R. M. Marianella, G. J. Postma, L. M. C. Buydens, R. Wehrens. J. Grape and Wine Research. (2013) 19,324-330.
49. E. Caytan E. P. Botosoa V. Silvestre, R. J. Robins, S. Akok, G. S. Ramaud. Anal. Chem.( 2007) 79, 8266-8269. 50. K. Bayle, M. Grand, A. Chaintreau, R. J. Robins, W. Fieber, H. Sommer, S. Akoka, G. S. Remaud, Anal. Chem. (2015) 87,7550-7554.
51. A. Horst, J. Renpenning, H.H. Richnow, M. Gehre. Anal.
Chem. (2017) 89, 9131–9138.
52. A. H. Goldstein, S.L. Shaw. Chem. Rev. (2003) 103, 5025– 5048.
53. A. Proto, R. Cucciniello, F. Rossi, O. Motta. Environ. Sci.
51
54. S. E. Bush, D. E. Pataki, J.R. Ehleringer Appl. Geochem. (2007) 22, 715–723.
55. D. Widory, M. Javoy. Earth Planet Sci. Lett. (2003) 215,289–298.
56. J. Diefenbacher, J. Piwowarczyk, R.F. Marzke. Review of
Scientific Instruments (2011) 82, 0761071
57. J. A. Surface, P. Skemer, S. E. Hayes, M. S. Conradi.
Environ. Sci. Technol. (2013) 47,119−125.
58. J.A. Surface, X. Deng, K.S. Thanthiriwatte, V. E. Jackson, C. Wan, O. Qafoku, D. A. Dixon, A. R. Felmy, K.M. Rosso, Z. J. Hu. Environ. Sci. Technol. (2015) 49,1631-1638.
59. J.K. Moore, J. A. Surface, A. Brenner, P. Skemer, M. S. Conradi, S. E. Hayes, Environ. Sci. Technol. (2015) 49, 657– 664.
60. A.Kuchařová, R. Přikryl. Environ. Earth Sci.(2017), 48-76.
52
2. Aims of work
Stable isotope analysis has gained increasing interest in the application of different scientific field; one of the most important regarded the food authenticity, quality and typicality, particularly in the areas where conventional analytical methods cannot provide unambiguous results. However, only IRMS was been recognized international technique for the investigation of food adulterations and other cheaper measuring equipment have been designed as alternatives in orders to enhance the choice of analyst. In view of these requirements, this PhD project has been designed on three different aims:
1) The improvement of analytical methods for isotopic carbon determination in food samples and their application to identify geographical origin in sample like pasta, cocoa, olive oil. The spectroscopic methods such as FT-IR and NDIRS were cheapness and easy-to-operate respect to traditional methodology.
2) The development of 13C NMR spectroscopy to determine the bulk 13C/12C carbon isotope ratio of inorganic carbonates and bicarbonates at natural abundance. In this case it were analysed all
53 parameters to obtained quantitative 13C NMR analysis and thanks to the presence of internal standard could advance the quality of carbon isotope ratio determination of bulk material. 3) The application of isotopic carbon ratio analysis
on samples which have considerable interest in several applications for environmental studies and in the field of cultural heritage. The intention is to correlate the isotopic composition with the variation of concentration in the air for the validation such as a tool to follow the flux of people in the different area of museum and to monitoring of filtering system.
54
3.1 Determination of isotopic composition
3.1.1
Isotopic Ratio Mass Spectrometer IRMSA Delta Plus V Isotope Ratio Mass Spectrometer (ThermoFinnigan, Bremen, Germany) equipped with a Flash EA 1112 Elemental Analyzer (ThermoFinnigan) was used to measure δ13C. The δ13C isotopic values were calculated using 2 homogenized in-house protein standards, which were themselves calibrated against international reference materials: L-glutamic acid USGS 40 (IAEA International Atomic Energy Agency, Vienna, Austria), fuel oil NBS-22 (IAEA) and sugar IAEA-CH-6 for 13C/12C. The measurement uncertainty, computed using the NORDTEST23-24 which combines the internal reproducibility with the performances results achieved in proficiency test FIT-PTS, was 0.3‰. The δ13C values were reported relative to Vienna-Pee Dee Belemnite on a scale that was normalized by assigning a value of 46.6‰ to LSVEC lithium carbonate (IAEA).
3.1.2 FTIR infrared-Spectroscopy Fourier Transform
For FTIR analysis of food samples, the sample was reduced to carbon dioxide gas in the same way as NDIRS analysis. Then, according to the procedure previously
55 described, 500 mg of BaCO3 were introduced into a
10-ml glass flask with aPS (atactic polystyrene) film linked under the cap. Amorphous aPS film, with a thickness of 100-160 μm, was obtained by casting from 1.5% aPS chloroform solutions at room temperature. The flask was evacuated and adsorbed CO2 was released by acidification
with 2.5 mL of orthophosphoric acid. The polymeric film was left for 2 hours at room temperature into CO2 gas and
then introduced into the FTIR spectrometer.
Transmission infrared spectra in the midrange (4000-400 cm-1) were acquired at a resolution of 2.0 cm-1 and a scanning number of 32 with a Bruker Vector 22 FTIR spectrometer.
FTIR calibration was performed by using international standards purchased from the International Atomic Energy Agency (IAEA) (IAEA-CH-3, cellulose, 13C= -24.5 ± 0.2‰; IAEA-C8, oxalic acid, 13C= -18.3 ± 0.2‰; IAEA-CO-1, marble, 13C= +2.5 ± 0.1‰; USGS41, L-glutamic acid, 13C=+37.8± 0.2‰). The measurement uncertainty is 0.4‰, expressed as 2 SR (standard deviation of reproducibility).
56
3.1.3 NDIRS Non Dispersive Infrared Spectroscopy
For NDIRS (Non Dispersive Infrared Spectroscopy) analysis the food samples were preliminary reduced to carbon dioxide. The first step was combustion in atmosphere of pure oxygen at T=1000°C; then carbon dioxide gas was collected in an impringer filled with 100 mL of barium hydroxide solution, Ba(OH)2, 0.3 M. This
reaction started with a flash and carried on by itself. CO2
reacted with Ba(OH)2 and it was quantitatively converted
in barium carbonate, BaCO3.
Ba(OH)2 + CO2 BaCO3 + H2O
Before analysis, BaCO3was washed with boiled water and
dried under vacuum at 120°C for 1 hour.
All carbonates and bicarbonates were analyzed with the following procedure: 100 mg carbonate was introduced into a 10 mL glass flask, that was evacuated, and 2.5 mL of orthophosphoric acid was syringed to produce carbon dioxide. The CO2 gas produced was collected in a specific
aluminized bag. NDIRS spectroscopy was conducted by means of a Heli-FANplus analyzer (Medimars.r.l, Milan) equipped with a single beam non-dispersive infrared industrial photometer. The aluminized bags were directly
57 connected with the inlet ports of the NDIR spectrometer for sequential measurements. The NDIRS device was interfaced to a computer system that enables the software-guided measurement and calculation of results.
All the chemicals were purchased from Sigma Aldrich (Saint Louis, Missouri, USA).
NDIRS calibration was performed by using the international standard purchased from the International Atomic Energy Agency (IAEA) (marble, 13C= +2.5 ± 0.1‰). The measurement uncertainty was 0.6 ‰.
3.1.4 NMR Spectroscopy
The quantitative NMR spectra were recorded using a Bruker 600, with a probe accepting 5 mm o.d. tubes. The sample (0.1000 g), CH313COONa used as internal
standard (0.0100 g) and the accurately weighed relaxation reagent Cr(acac)3 (0.0050 g), were added to 0.5 mL of
deuterated solvent (D2O) in order to lock the field to the
frequency of the spectrometer. Gated decoupling techniques were applied in order to obtain quantitative results. The pulse angle was set at 90° and the pulse intervals, D, were selected (D> 3T1 max) on the basis of
the longitudinal relaxation times, T1, first determined by
58 Before analysis water insoluble carbonates were converted into soluble carbonates following the procedure: CaCO3 was converted in water soluble
Na2CO3 for 13C NMR analysis according to the following
procedure: a portion of 2 g of CaCO3 was introduced into
a 10 mL glass flask, that was evacuated, and 5 mL of orthophosphoric acid was syringed to produce carbon dioxide. The obtained CO2 gas was collected in an
impringer, filled with 20 mL of a saturated solution of sodium chloride and with 50 mL of NH3 solution at
30-33% w/w; then it was quantitatively converted in NaHCO3 and Na2CO3. NaHCO3 and Na2CO3 were
removed by filtration, washed with distilled water and dried under vacuum at 300°C for 2 h to convert NaHCO3
in Na2CO3, following the well-known Solvay method.
Na2CO3 was characterized by thermogravimetric analysis
by using a Netzsch TG 209 apparatus. The analyses were carried out on samples with a mass of about 10 mg placed inside an alumina crucible. The sample temperature was then increased at a heating rate of 10°C min-1 from room temperature up to 800°C under an inert atmosphere of nitrogen.
Typical values of the experimental parameters were as follows: spectrum width (SW) 3000 MHz, pulse width
59 (PW, for a pulse angle of 90°) 12μs, memory size (SI) 32K, delay time 150 s, temperature (T) 300 K, zero filling (Z) 32K, number of transients (NS) 70, number of experiments per sample (NE) 4. Analyses time change in the range 1-2 h, based on the chemical difference of the compounds investigated.
60
3.1 Determination of FT-IR and NDIRS analysis to food samples
61
3.1 Determination of FT-IR and NDIRS analysis to food samples
The 13C/12C carbon isotope ratio was a chemical parameter with many important applications in the study of the geographic origin of food products giving the possibility for testing food authenticity, quality and typicality and the isotope ratio mass spectrometry was the technique currently used for the δ13C determination. This latter is highly accurate (0.1‰) and sensitive (up to 0.01‰), but at the same time expensive and complex. In the first year the objective of project was to assess the reliability of spectroscopic methods such as FTIR and NDIRS techniques for determination of carbon stable isotope ratio of food sample. IRMS, NDIRS and FTIR were used to analyze samples of food, such as oil, durum, cocoa, pasta and sugar, in order to determine the natural abundance isotopic ratio of carbon in a parallel way. The results showed a close relationship among the results obtained by three different techniques. The main advantage in using FTIR and NDIRS is related to their cheapness and easy-to-operate in comparison to IRMS.
62
3.1.1 Material and Methods
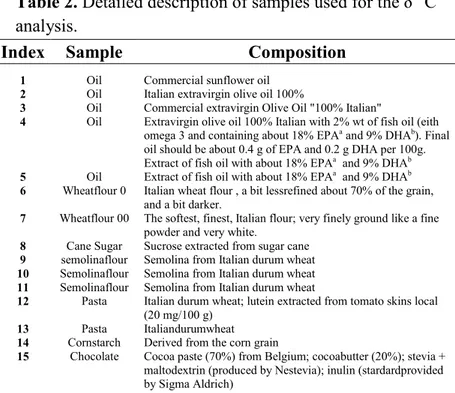
This study was conducted on 19 selected samples typical components of the “Mediterranean Diet” such as pasta, oil, chocolate, cocoa, flour and sugar. These samples were collected within the framework of the Campus Project (Introduction and valorization of healthful foods and productive rationalization in the traditional industries of the Campania region) funded by the Italian Campania Region (POR CAMPANIA FESR 2007-2013). In Table 1 is reported a detailed description of the samples investigated.
Table 2. Detailed description of samples used for the δ13C analysis.
Index Sample Composition
1 Oil Commercial sunflower oil
2 Oil Italian extravirgin olive oil 100%
3 Oil Commercial extravirgin Olive Oil "100% Italian"
4 Oil Extravirgin olive oil 100% Italian with 2% wt of fish oil (eith omega 3 and containing about 18% EPAa and 9% DHAb). Final
oil should be about 0.4 g of EPA and 0.2 g DHA per 100g. Extract of fish oil with about 18% EPAa and 9% DHAb 5 Oil Extract of fish oil with about 18% EPAa and 9% DHAb 6 Wheatflour 0 Italian wheat flour , a bit lessrefined about 70% of the grain,
and a bit darker.
7 Wheatflour 00 The softest, finest, Italian flour; very finely ground like a fine powder and very white.
8 Cane Sugar Sucrose extracted from sugar cane
9 semolinaflour Semolina from Italian durum wheat
10 Semolinaflour Semolina from Italian durum wheat
11 Semolinaflour Semolina from Italian durum wheat
12 Pasta Italian durum wheat; lutein extracted from tomato skins local (20 mg/100 g)
13 Pasta Italiandurumwheat
14 Cornstarch Derived from the corn grain
15 Chocolate Cocoa paste (70%) from Belgium; cocoabutter (20%); stevia + maltodextrin (produced by Nestevia); inulin (stardardprovided by Sigma Aldrich)
63
16 Cocoa Cocoa 100%, the starting product obtained after extraction from plants
17 Cocoa Cocoa 100%, the starting product obtained after extraction from plants
18 Chocolate Cocoa paste (70%) from Belgium; cocoabutter (20%); stevia + maltodextrin (produced by Nestevia); inulin (stardardprovided by Sigma Aldrich)
19 Chocolate Commercial dark chocolate, 50% cocoa. Ingredients:cocoa paste, sugar, butter, anhydrous vaccine, emulsifierlecithin, naturalvanillaflavor
a EPA = Eicosapentaenoic acid; b DHA = docosahexaenoic acid.
3.1.2 Statistical analysis
Statistical analysis was performed using Sigma plot 12.0 software which was used for summary statistics (mean, standard deviation, coefficient of variation, linear regression and Bland Altman plot).
Linear regression analysis was used to determine the correlation between FTIR, NDIRS and IRMS. However, a good correlation does not certainly guarantee a good agreement between two methods. Bland and Altman did not state that in the analysis of measurement method comparison data, neither the correlation coefficient nor techniques such regression analysis are appropriate.5,7 They suggested to integrate these analyses by simply plotting the difference between the results of the methods against their mean. Bland Altman Bias plot was used to determine the 95% confidence limits of agreement and the bias between IRMS, FTIR and NDIRS results.
64
3.1.3 Results and discussions
The results of isotopic carbon analysis was reported in Table 3, food samples was analyzed by the three different methods (IRMS, NDIRS and FTIR) as mean value of three measures on each sample. To avoid some interferences and/or matrix effects on measurement, samples were selected with different composition, chemical nature and geographical origin.
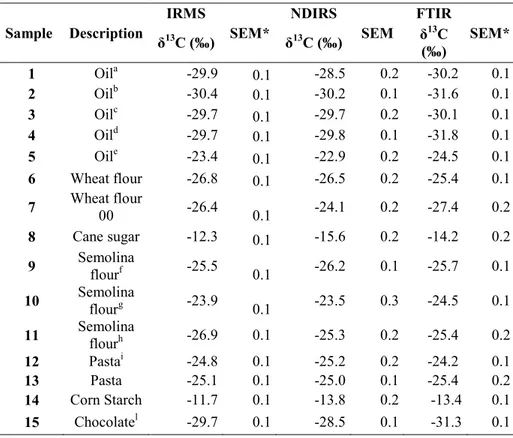
Table 3. δ13C values resulting from three different techniques. Sample Description IRMS SEM* NDIRS SEM FTIR SEM* δ13C (‰) δ13C (‰) δ13C (‰) 1 Oila -29.9 0.1 -28.5 0.2 -30.2 0.1 2 Oilb -30.4 0.1 -30.2 0.1 -31.6 0.1 3 Oilc -29.7 0.1 -29.7 0.2 -30.1 0.1 4 Oild -29.7 0.1 -29.8 0.1 -31.8 0.1 5 Oile -23.4 0.1 -22.9 0.2 -24.5 0.1 6 Wheat flour -26.8 0.1 -26.5 0.2 -25.4 0.1 7 Wheat flour 00 -26.4 0.1 -24.1 0.2 -27.4 0.2 8 Cane sugar -12.3 0.1 -15.6 0.2 -14.2 0.2 9 Semolina flourf -25.5 0.1 -26.2 0.1 -25.7 0.1 10 Semolina flourg -23.9 0.1 -23.5 0.3 -24.5 0.1 11 Semolina flourh -26.9 0.1 -25.3 0.2 -25.4 0.2 12 Pastai -24.8 0.1 -25.2 0.2 -24.2 0.1 13 Pasta -25.1 0.1 -25.0 0.1 -25.4 0.2 14 Corn Starch -11.7 0.1 -13.8 0.2 -13.4 0.1 15 Chocolatel -29.7 0.1 -28.5 0.1 -31.3 0.1
65
16 Cocoam -30.4 0.1 -29.1 0.3 -31.2 0.1
17 Cocoan -29.8 0.1 -28.4 0.1 -29.1 0.2
18 Chocolateo -30.4 0.1 -28.1 0.1 -32.1 0.2
19 Chocolatep -27.8 0.1 -26.4 0.1 -28.1 0.1
*SEM: Standard error of mean.
a sunflower oil, b home made extravirgin olive oil, c extravirgin olive oil, d
extravirgin olive oil with omega3, e fish oil exctract , f, g, h different
commercial semolina flour, i pasta with luteina , ldark chocolate 70%cocoa ,
m dark chocolate 50%, m,n different commercial cocoa, odark chocolate with
stevia, pdark chocolate with 50% cocoa.
The δ13C values obtained show a very good agreement with values reported in the literature for similar food samples 1,2,3,8. NDIRS and FTIR spectroscopies could be used to discriminate the isotopic domain characteristic of the particular kind of food.
The δ13C values of olive oil, for example, respect the range of oil samples from -28.5 to -31.7 ‰ while the oil extracted from fish (see entry 5 in Table 3) has a quite different value (-22.9 to -24.5‰): olive plants have a C3
photosynthetic pathway and their carbon composition was into the typical range -22 to -34‰ [5, 38] reflecting the different origin.
The same results were reported for flour samples (flour 0, flour 00, semolina and durum wheat flour) with an isotopic composition ranging from -27.4‰ to – 24‰, the same range reported by Brescia et al. The δ13C values of
66 chocolate and cocoa, from -26.4 to -32.0‰ show typical isotopic composition for C3 plants (Calvin cycle).The C4
plants, comprising most plants in the tropics including corn and sugar cane, use the Hatch-Stack cycle, and are isotopically heavier (-23 to -6‰) compared to C3 plants.4
As reported in Table 3 cornstarch shows an isotopic composition ranging from -11.7 to -13.8‰ and cane sugar sample shows an isotopic composition in the range -12.3 to -15.6‰.
To better evidence the isotopic domains the delta values, obtained by the three methods, have been plotted vs the food samples in Figure 5.