Research & experimentation Ricerca e sperimentazione
A first reflection on the correlation between urban
density and the spread of COVID-19 in Italy
Anna Richiedei, Maurizio Tira
Department of Civil, Environmental, Architectural Engineering and Mathematics, University of Brescia, IT
Highlights
• It can be assumed that compact settlements suffer over-spread of the virus in the Italian provinces, by using some indicators about form and density of urban settlements.
• The edge density and the urban density on anthropized areas have been associated with the number of positive cases of COVID-19.
• The social and environmental costs of different patterns of urban growth need to be revised. • Health care systems have to be re-tuned in order to face the most challenging crisis of last century.
Over 75% of the European population live in cities and towns where, therefore, the challenge of sustainability is at stake. As it is well known, sustainability has many facets, according to the Sustainable Development Goals (SDGs): one of those is the health and well-being of the population. The social and environmental costs of dif-ferent patterns of urban growth have been addressed in an extensive literature. Nev-ertheless, the COVID-19 pandemic has undermined many established beliefs and raised new questions.
It is not yet clear whether there is a link between the spread of the virus and conse-quences on health and environmental conditions. So, it may be of interest to compare the different patterns of viral contamination among Italian regions and provinces, by using some indicators of population density in urban areas. Some indicators, among the many available in the literature, to assess fragmentation and compactness of set-tlement and population density are selected, collected and represented. In 2020 the analysis shows potentially clusters of settlement suffering over-spread of the virus in the Italian provinces.
The traditional provision of public services and spaces will have to be redefined by planners to protect and serve the population, if a potential link between the density of urban areas and the spread of the COVID-19 pandemic will be identified. That is the goal of the paper.
Received: August 12, 2020 Reviewed: November 15, 2020 Accepted: December 18, 2020 On line: February 20, 2021
Article history
Abstract
Sustainability Urban development Urban density Fragmentation PandemicKeywords
1. Introduction
Urban growth is a significant and growing issue in Europe and all over the world (AA.VV., 2004; Brueckner, 2000; Christiansen & Loftsgarden, 2011; EEA, 2006; Hamidi & Ewing, 2014).
“In 2018, an estimated 55.3 per cent of the world’s population lived in urban settlements. By 2030, urban areas are projected to house 60 per cent of people globally and one in every three people will live in cities with at least half a million inhabit-ants” (UN, 2018, p. 2).
According to the United Nations, “the future of the world’s population is urban. With more than half of the world’s people living in urban areas (55 per cent, up from 30 per cent in 1950), urbanization determines the spatial distribution of the world’s population and is one of the four demographic mega-trends, with the growth of the global pop-ulation, population ageing, and international mi-gration. Estimates and projections of urbanization […] indicate that the future growth of the human population can be accounted for almost entirely by a growing number of city dwellers. By mid-centu-ry, roughly two thirds (68 per cent) of the world’s population will be living in urban areas. The global urban population is projected to grow by 2.5 bil-lion urban dwellers between 2018 and 2050, with nearly 90 per cent of the increase concentrated in Asia and Africa. In many regions, the share of population living in cities, as well as the number and size of cities, will continue to grow, driven by a combination of factors, including a surplus of births over deaths in urban areas, migration from rural to urban areas and from abroad (Lerch, 2017) as well as the urbanization of formerly ru-ral areas” (UN, 2019, p. 1). Europe is characterized by an urban population growth concurrent with rural population decline and an urbanization rate lower than other less urbanized countries (UN, 2019). This confirms the statement that “the pace of urbanization in a country tends to be associated with the level of urbanization, with more urban-ized countries urbanizing more slowly than less urbanized countries” (UN, 2019, p. 48).
Furthermore “urban areas in the EU are often char-acterised by high concentrations of economic ac-tivity, employment and wealth with the daily flow of commuters into many of Europe’s largest cities suggesting that opportunities abound in these hubs of innovation, distribution and consumption. However, cities in the EU are also characterised by a range of social inequalities, and it is
common-place to find people who enjoy a comfortable life living in close proximity to others who may face considerable challenges, for example, in relation to housing, poverty or crime, herein lies the urban paradox” (EU, 2016, p. 11). These features could be linked with the degree of urbanisation. Figure 1 shows, for example, the living environment satis-faction by the degree of urbanisation in the EU. In cities, the living environmental satisfaction is on average good, but for such Country, the liveability in rural areas is better than in cities and in another one, it is the opposite, probably due to the urban paradox.
The evaluation of the degree of urbanisation could be presented in a different way to stress the urban settlements’ degree of sustainability.
Moreover, understanding the key trends, present and future, in urbanization is crucial to the im-plementation of the 2030 Agenda for Sustainable Development, in particular, the Sustainable Devel-opment Goal 11 with the target to make cities and human settlements inclusive, safe, resilient and sustainable.
The topic of healthy cities is well known through the literature (Barton & Grant, 2013; Davies & Kelly, 1993; Duhl et al., 1999; Ramaswami et al., 2016). In the last century, medical and urban plan-ning researches have moved on mutually intrusive but still parallel tracks. On the one hand, public health has focused on the individual and social de-terminants of healthy lifestyles and the intensity and quantity of physical exercise, mainly in terms of prevention. On the other hand, urban planning has focused on the analysis of citizens' behaviours in daily commuting, on the planning of the quanti-ty and qualiquanti-ty of services, on the drafting of tools aimed at defining and creating an adequate hous-ing density, on the virtuous harmonization of in-tended uses, building types and neighbourhoods, social mixes, aesthetic values (D'Onofrio & Tru-siani, 2017).
In many recent urban planning experiences, it is, however, possible to recognize the effects of the in-tegration process of the two subjects. Above all, the approach expressed by the Healthy Cities move-ment aims directly at placing the issue of health as a priority in the political and social choices of the city . According to the World Health Organiza-tion (WHO), the concept of health is an essential element for the well-being of a society and does not refer merely to physical survival, but includes psychological aspects, natural, environmental, cli-matic and housing conditions and also lifestyle
(working, economic, social and cultural life) (see the Ottawa Charter for Health Promotion, 1986). This affirmation of the meaning of health is even more evident following the COVID-19 pandem-ic, during which the problems of managing sick, healed and healthy people emerged very strongly, in particular as regards the space organisation. The paper would like to evaluate the possible causes that have facilitated or inhibited the spread of the pandemic. The morphology of urban settle-ments, theoretically, could have favoured diffused and scattered con-urbations and disadvantaged compact and dense cities. The article, therefore, proposes some basic data on the COVID-19 pan-demic in Italy at the provincial level and, based on a brief presentation on the various possibilities of
measuring the form and density of anthropized areas, presents some indicators that support the thesis.
2. The COVID-19 pandemic
The COVID-19 pandemic is a global health crisis and it is the biggest challenge humanity has faced since World War II. Since its appearance in Asia in late 2019, the virus has spread to all continents except Antarctica. Countries have fought to slow down the spread of the virus in the most diverse ways.
COVID-19 is much more than a health crisis: it has Figure 1: Living Environment Satisfaction, by degree of urbanisation, 2013 (rating, 0-10) Source: EU,
the potential to create devastating social, econom-ic and politeconom-ical crises that will leave deep scars. Every day, people lose jobs and income, with no way of knowing when normalcy will return. Al-ready in Spring 2020, the International Labor Or-ganization estimates that 195 million jobs could be lost (UNDP, 2020).
Over 37,109,000 cases and 1,070,000 deaths have been recorded so far (WHO, 2020a), 11 October 2020), but the pandemic is not over yet and many countries are still facing growing challenges. The variation by age group is quite clear (or at least it used to be in the first wave, last Spring; at that time, in Italy the cases were mainly concen-trated on over 70-years old people), while the ev-idence on the geographical spread of the virus is still very scarce and therefore the (possible) cor-relation with urban environments.
In 2005 the WHO created the International Health Regulations (IHR). IHR is an agreement between 196 countries and territories to work together for global health security with a commitment to de-velop and improve public health capacities that make the world ready to respond to emerging pub-lic health emergencies. This agreement provided a scoring system to measure a country’s ability to prepare for and respond to these health emergen-cies. The IHR scoring system is based on 13 core capacities which include, for example, measures taken at ports, airports and ground crossings to limit the spread of health risks. In 2019 Europe has a score of over than 70% for 10 of 13 core ca-pacities. The three more critical aspects are: risk communication, points of entry, chemical events (WHO, 2020b). This high score, however, did not have a particular impact in dealing with the virus: Europe recorded over 6,945,000 cases of COV-ID-19 with over 246,900 deaths (WHO, 2020a). In Italy, after the bad period of March-April 2020, the daily cases have decreased and at the moment their complessive number is over 280,000 (35,500 deaths) (WHO, 2020a). The data are continuously updated and can be observed at different scales of detail (national, regional, provincial, municipal, etc.).
The provincial scale is the disaggregation level for the case study. Table 1 shows the number of Pos-itive cases for COVID-19 in the Italian provinces and the percentage over 1,000 inhabitants. The data source is the official database of the Civil Pro-tection Service (updated at 24th August 2020).
3. Urban density and morphology
The density and the form of a settlement can be evaluated in many different ways. Sometimes the density refers to population density (number of people per unit area), in other cases to the build-able or built volume per unit area, while in other cases the Floor Space Index (FSI) is still used - that is the number of housing units per unit area. The urban parameters used for city development are also strongly linked to the ways of living, to cultur-al factors and the environmentcultur-al contest; these are not only represented by the height of the buildings but also by how the buildings are articulated into the lot (e.g. F. L. Wright one mile-high skyscraper). For example, Berghauser Pont and Haupt (2009) use a multi-parameter to summarize this com-plexity in a single indicator (“density”), divided into: population density, residential density, build-ing intensity, covered area, the average height of buildings and the extent of the unbuilt urban environment(Berghauser Pont & Haupt, 2009) (Berghauser Pont & Haupt, 2009)(Berghauser Pont & Haupt, 2009)(Berghauser Pont & Haupt, 2009). These parameters make it possible to de-scribe the characteristics of urban space through simplified indexes, regardless of the regulatory approach already present in a city. The scale of use is local (for municipalities, neighbourhoods or groups of buildings).
In contrast, on the overall-national scale, the de-gree of urbanisation is a classification of local ad-ministrative units (LAUs) that indicates the charac-teristics of a particular area, based on a population grid composed of 1 km² cell, identifying (EU, 2016, pp. 24-25):
•
“urban areas, defined here as the sum or aver-age of cities and towns and suburbs;•
cities (densely populated areas), where at least 50 % of the population lives in urban centres;•
towns and suburbs (intermediate density are-as), where at least 50 % of the population lives in urban clusters, but is not classified as a city;•
rural areas (thinly populated areas), where atleast 50 % of the population lives in rural grid cells”.
This parameter is available on a national to re-gional scale.
In Italy, ISPRA (Istituto Superiore per la Protezi-one dell’Ambiente - National Network for the Envi-romental Protection) proposes a parameter called “Total density” that weights the population on the
PROVINCE Region Cases Cases out of 1,000 inh. PROVINCE Region Cases Cases out of 1,000 inh.
Roma Lazio 7,378 1.699 Lucca Toscana 1,490 3.841
Milano Lombardia 25,558 7.863 Chieti Abruzzo 898 2.329
Napoli Campania 3,175 1.029 Novara Piemonte 2,912 7.891
Torino Piemonte 16,197 7.168 Potenza Basilicata 199 0.545
Brescia Lombardia 16,243 12.831 Cremona Lombardia 7,665 21.354
Palermo Sicilia 601 0.480 Pesaro e Urbino Marche 2,903 8.089
Bari Puglia 1,641 1.311 Catanzaro Calabria 226 0.631
Bergamo Lombardia 15,253 13.685 Sud Sardegna Sardegna 172 0.490
Catania Sicilia 1,017 0.918 Ferrara Emilia-Rom. 1,192 3.448
Salerno Campania 883 0.804 Arezzo Toscana 758 2.212
Bologna Emilia-Rom. 5,884 5.799 Rimini Emilia-Rom. 2,313 6.823
Firenze Toscana 3,460 3.421 Lecco Lombardia 3,932 11.655
Padova Veneto 4,556 4.858 Livorno Toscana 562 1.678
Verona Veneto 5,481 5.916 Ragusa Sicilia 353 1.100
Caserta Campania 798 0.865 Pescara Abruzzo 1,674 5.249
Varese Lombardia 4,110 4.614 Viterbo Lazio 491 1.549
Treviso Veneto 3,611 4.067 Macerata Marche 1,196 3.807
Monza/Brianza Lombardia 6,006 6.872 Pordenone Friuli VG 798 2.553
Vicenza Veneto 3,065 3.554 Teramo Abruzzo 701 2.276
Venezia Veneto 3,093 3.625 L'Aquila Abruzzo 341 1.140
Genova Liguria 5,884 6.995 Pistoia Toscana 794 2.715
Lecce Puglia 647 0.814 Piacenza Emilia-Rom. 4,604 16.033
Cosenza Calabria 507 0.718 Benevento Campania 227 0.819
Modena Emilia-Rom. 4,211 5.970 Savona Liguria 1,775 6.430
Perugia Umbria 1,122 1.709 Siena Toscana 471 1.763
Messina Sicilia 558 0.890 Caltanissetta Sicilia 221 0.842
Foggia Puglia 1,313 2.110 Prato Toscana 597 2.317
Como Lombardia 4,260 7.109 Rovigo Veneto 516 2.196
Cuneo Piemonte 3,054 5.202 Trieste Friuli VG 1,455 6.205
Taranto Puglia 293 0.508 Lodi Lombardia 3,677 15.973
Latina Lazio 762 1.325 Terni Umbria 435 1.928
Reggio C. Calabria 353 0.644 Grosseto Toscana 441 1.990
Pavia Lombardia 5,707 10.455 Campobasso Molise 420 1.898
Trento Trentino-AA 5,028 9.292 La Spezia Liguria 936 4.263
Reggio E. Emilia-Rom. 5,237 9.846 Asti Piemonte 1,908 8.889
Bolzano Trentino-AA 2,869 5.401 Imperia Liguria 1,563 7.309
Udine Friuli VG 1,138 2.152 Nuoro Sardegna 108 0.518
Sassari Sardegna 1,067 2.171 Ascoli Piceno Marche 346 1.670
Frosinone Lazio 721 1.474 Belluno Veneto 1,244 6.130
Ancona Marche 1,924 4.083 Matera Basilicata 222 1.122
Parma Emilia-Rom. 3,863 8.553 Massa Carrara Toscana 1,124 5.768
Agrigento Sicilia 202 0.465 Sondrio Lombardia 1,628 8.990
Cagliari Sardegna 326 0.756 Biella Piemonte 1,062 6.048
Trapani Sicilia 152 0.353 Crotone Calabria 128 0.732
Alessandria Piemonte 4,147 9.844 Fermo Marche 485 2.791
Pisa Toscana 1,007 2.403 Vercelli Piemonte 1,462 8.554
Avellino Campania 593 1.418 Enna Sicilia 459 2.785
Mantova Lombardia 3,932 9.537 Vibo Valentia Calabria 92 0.575
Siracusa Sicilia 405 1.014 Verbano-Cusio-Ossola Piemonte 1,164 7.351
Forlì-Cesena Emilia-Rom. 1,870 4.739 Oristano Sardegna 61 0.387
Brindisi Puglia 690 1.756 Rieti Lazio 447 2.875
Barletta-Andria-Trani Puglia 405 1.038 Gorizia Friuli VG 242 1.736
Ravenna Emilia-Rom. 1,257 3.228 Aosta Valle d'Aosta 1,217 9.684
Isernia Molise 71 0.841
Table 1: Cases of COVID-19 in the Italian provinces (numbers and percentage of cases for 1,000 inhabitants). The name of the Region to which the province belongs is also indicated.
administrative area. This parameter is collected at the national level, but available at the regional and local scale (provinces and municipalities).
Another parameter could be used to evaluate den-sity: “urban density” This parameter is more effec-tive than classic density (population on the admin-istrative surface) because it relates the population with the areas effectively built. Probably the densi-ty measurement would be even more effective if it compared the population to residential areas only, but this data is not available in a homogeneous way at the national level (at least in Italy).
Not only the density is important to analyse the urban form. Also, the compactness or the fragmen-tation of urban settlements is significant. ISPRA proposes 4 different indicators (at the national, re-gional, provincial and municipal level) to evaluate the morphology of urban areas:
•
Edge density - Fragmentation of the edges of the built area through the ratio between the total sum of the polygon perimeter of the built areas and the extension of their surface. High values indicate more fragmented areas;•
Largest Class Patch Index (LCPI) - Percentage width of the largest constructed area polygon. It is an indicator of compactness;•
Remaining Mean Patch Size (RMPS) - Average width of residual polygons, excluding the larg-est one. Provides the size of the spread of cities around the core;•
Dispersion Index (DI) - Ratio between the extension of medium/low-density areas on the total of areas (medium/low-density and high-density areas).The indicators are built through an analysis of pol-ygons corresponding to the different types of land cover, with the application of metrics dedicated to the study of the landscape structure at the munic-ipal level (Botequilha Leitao & Ahern, 2002; EEA-FOEN, 2011; ISPRA, 2016; Schwarz, 2010).
4. The effect of population
den-sity and city fragmentation
on the spread of the virus
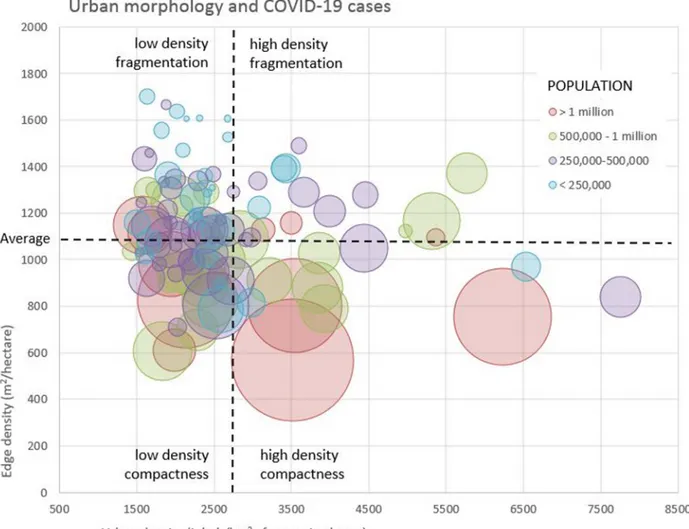
Starting from the possible indicator of urban form and urban density just exposed, in figure 2 a demonstration of the theoretical link between the form of urban settlement and the spread of the virus COVID-19 at the provincial scale in Italy is shown.
The selected indicators of urban morphology are Edge density (proposed by ISPRA) and urban den-sity on antropised areas. The data for Italian prov-inces came from the ISPRA database of soil con-sumption (2020 edition, referred to 2019 data). The Edge density is provided directly by ISPRA. The urban density is calculated using the data of soil consumption and the populations collected by ISPRA.
According to the classification of urban areas pro-posal by Marinosci et al. (Marinosci et al., 2015), the graph in Figure 2 is developed. Edge density and urban density are represented on the graph axes. The averages of the two groups of data iden-tify 4 dials that distinguished 4 urban settlement features:
•
fragmented with low density;•
fragmented with high density;•
compacted with low density;•
compacted with high density.In figure 2 the colours identify le population class-es of the provincclass-es:
•
over one million of inhabitants;•
from 500,000 to 1 million of inhabitants;•
from 250,000 to 500, 000 inhabitants;•
under 250,000 inhabitants.The radius of the circle is proportional to the pos-itive cases of COVID-19 (at 24 August 2020) pre-sented in the previous paragraph.
Figure 2 shows, in the first dial, the provinces with fragmented and low-density settlements: the cir-cles'size in this deal is little then in the other deals, so the positive cases of COVID-19 are few. In the second dial, that identify the provinces with frag-mented and high-density settlements, fewer val-ues fall and the positive cases continue to be few (little size of the circles). In the third dial, the prov-inces have compact and low-density settlements and the size of the circles grows indicating a great-er numbgreat-er of COVID-19 positive cases. The last diel, that identify the provinces with compact and high-density settlements, has the larger rims or the greater incidence of positive COVID-19 cases. According to Figure 2, the fragmentation/com-pactness of the urban settlement is more im-portant than the density: the more compact set-tlements present more cases of COVID-19 than the fragmented ones. The difference between high-density settlements and low-density ones is not so sensitive.
As regards the size of the settlements in terms of inhabitants (identifiable by colour in Figure 2), the settlements over 500,000 inhabitants are
predom-Figure 2: Urban morphology and positive cases of COVID-19 in the Italian provinces. The radius of the circle is proportional to the positive cases of COVID-19. Source: authors' elaboration from the database of ISPRA, 2020 and official database Civil Protection Service, 2020.
inantly compacted. Conversely, the settlements under 250,000 inhabitants have predominantly low urban densities.
5. Discussion and conclusion
Starting from the first results of the relationship between urban density and COVID-19 pandemic proposed in Italy at the regional scale (Tira, 2020), the paper proposes to apply the same considera-tions at the provincial scale.
The indicators of urban form and density are quite similar, but only a combination of them showed appreciable results at the local scale. In particular,
only two indicators of fragmentation and urban density showed a link with the number of posi-tive cases of COVID-19. They need to be evaluat-ed contemporary to understand the phenomenon, so a graph that shows 4 dimensions was realised to demonstrate the thesis of the paper: using the Edge density, the urban density on atropised are-as, the population and positive cases of COVID-19 it is possible to understand that compact settle-ments suffer over-spread of the virus.
The debate around the pros and cons of a compact city, even concerning sustainability is long-lasting and the results controversial.
From one side, there is a remarkable consensus among international institutions as well as local and national governments to implement large
and compact cities as a way of reducing the eco-logical impact of urban settlements, and hence of contributing to the achievement of sustainable development (Gaigné et al., 2012). On the other side, density has always been and continues to be a tricky matter (see among others (Burton et al., 1996). During the first industrial revolution, it was a dramatic negative feature of cities and towns. “Pandemic dramatically brings us back in time: even the most efficient urban settlements can suffer from the spread of the unknown virus, quickly transmitted by an increasingly complex and inter-related urban environment”(Tira, 2020, p. 365).
One Century ago, the Garden city movement and also rational urban planning with the definition of urban standards aimed at reducing overcrowding, the cause of countless negative impacts. This could have been a smart way to deal with the problem and it is still considered as a possible solution (Hardy, 2006).
“The compact city shows its ecological impact, due to the growing energy demand especially for buildings and the great dependence on a large (and so often distant) rural area. It can maximise the scale economies for many public facilities, like transport systems, but we observed a high vulner-ability to pandemic.
The low-density scheme pays the cost of extending lifelines and road network to an unwise dimension and paves the way to the irrational use of motor-ised private cars. At the same time, it is the most
suitable scheme to energy self-sufficiency and easier for arranging social distances, for example, during the pandemic” (Tira, 2020, p. 365).
The Comprehension of the main trends in urban-isation likely to unfold over the coming years is crucial to the implementation of the 2030 Agenda for Sustainable Development, namely by defining sustainable urbanisation approaches. Unexpect-edly, that analysis is now crucial to prepare health care systems and public services to face a future challenging crisis like the one the world is still suf-fering.
What about the direct impact of environmental pollution on virus transmission? Viruses need a "carrier" to transmit. COVID19 is a "flyer" and environmental air pollution generally and par-ticularly PM10 and PM 2,5 provide the "perfect" transporter. In the winter, particularly with cold weather and denser air, these values are very high in densely packed cities (with about 60-70% of PM coming from household heating). So another issue that could be studied is the possible link between the presence of air pollutions and the spread of the virus in cities.
As with environmental problems such as hydroge-ological risk, it is also a question of being aware of and evaluating the consequences that life in the city entails. A new type of health risk depend-ent on the urban form of the cities we live in has emerged and deserves attention.
A new challenge arises for urban density and new requirements for public spaces and services.
References
AA.VV. (2004). Urban sprawl in Western Europe and t he United States. Population, Space and Place (A. H. W. Rich-ardson and Chang-Hee Christine Bae. Ashgate, Ed.). Ashgate publishing. doi: 10.1002/psp.375
Barton, H., & Grant, M. (2013). Urban planning for healthy cities. Journal of Urban Health, 90(1), 129-141. Berghauser Pont, M., & Haupt, P. (2009). Space density and urban form Technische Universiteit Delft]. Delft Botequilha Leitao, A., & Ahern, J. (2002). Applying landscape ecological concepts and metrics in sustainable land-scape planning. Landland-scape and Urban Planning, 59, 28. doi: 10.1016/S0169-2046(02)00005-1
Brueckner, J. K. (2000). Urban Sprawl: Diagnosis and Remedies. International Regional Science Review, 23(2), 160-171. doi: 10.1177/016001700761012710
Burton, E., Jenks, M., & Williams, K. (1996). The Compact City. A Sustainable Urban Form? Routledge.
Christiansen, P., & Loftsgarden, T. (2011). Drivers behind urban sprawl in Europe (Vol. 1136/2011). Institute of Transport Economics (TØI).
D'Onofrio, R., & Trusiani, E. (2017). Città, salute e benessere. Nuovi percorsi per l’urbanistica. Franco Angeli. Davies, J. K., & Kelly, M. P. (1993). Healty cities. Research and practice. Routledge.
Duhl, L. J., Sanchez, A. K., & Organization, W. H. (1999). Healthy cities and the city planning process: a background document on links between health and urban planning.
EEA. (2006). Urban sprawl in Europe - The ignored challenge [Publication]. EEA. EEA-FOEN. (2011). Landscape fragmentation in Europe. EEA. doi: 10.2800/78322
EU. (2016). Urban Europe. Statistics on cities, towns and suburbs. European Union. doi: 10.2785/91120
Gaigné, C., Riou, S., & Thisse, J.-F. (2012). Are compact cities environmentally friendly? Journal of Urban Econom-ics, 72(2), 123-136. doi: 10.1016/j.jue.2012.04.001
Hamidi, S., & Ewing, R. (2014). A longitudinal study of changes in urban sprawl between 2000 and 2010 in the United States [Article]. Landscape and Urban Planning, 128, 72-82. doi: 10.1016/j.landurbplan.2014.04.021 Hardy, D. (2006). Cities that don’t cost the earth. TCPA.
ISPRA. (2016). Consumo di suolo, dinamiche territoriali e servizi ecosistemici - Edizione 2016 (ISPRA, Ed. Vol. 248/2016) [Pubblicazione].
Lerch, M. (2017). International migration and city growth., Population Division Technical Paper 2017/10. Marinosci, I., Assennato, F., Luti, T., & Munafò, M. (2015). Forme di urbanizzazione e tipologie insediativa. In ISPRA (Ed.), Qualità dell’ambiente urbano – XI Rapporto (Vol. 63).
Ramaswami, A., Russell, A. G., Culligan, P. J., Sharma, K. R., & Kumar, E. (2016). Meta-principles for developing smart, sustainable, and healthy cities. Science, 352(6288), 940-943. doi: 10.1126/science.aaf7160
Schwarz, N. (2010). Urban form revisited—Selecting indicators for characterising European cities. Landscape and Urban Planning, 96(1), 29-47. doi: 10.1016/j.landurbplan.2010.01.007
Tira, M. (2020). About the Sustainability of Urban Settlements. TeMA - Journal of Land Use, Mobility and Environ-ment, 10. doi: 10.6092/1970-9870/6984
UN. (2018). The World’s Cities in 2018 - Data Booklet. United Nations - Department of Economic and Social Af-fairs, Population Division.
UN. (2019). World Urbanization Prospects: The 2018 Revision (United Nations, Department of Economic and So-cial Affairs, Population Division ed., Vol. ST/ESA/SER.A/420). United Nations.
UNDP. (2020). COVID-19 pandemic. Humanity needs leadership and solidarity to defeat the coronavirus. https:// www.undp.org/content/undp/en/home/coronavirus.html
WHO. (2020a). WHO Coronavirus Disease (COVID-19) Dashboard. https://covid19.who.int/
WHO. (2020b). World Health Statistics 2020. A visual summery. https://www.who.int/data/gho/whs-2020-visual-summary