The 55% tax reductions for building retrofitting in Italy: the results of the
ENEA’s five-years activities
Giampaolo Valentini, Patrizia Pistochini
ENEA, Italian National Agency for New technology, Energy and the Sustainable Economic Development
Abstract
The tax deductions of 55%, in force since January 2007, represents the most generous system of incentives ever established by the Government to promote energy efficiency and sustainable economic development in the Italian real estate system. By the Finance Act 2007 and the subsequent implementation, all efforts were addressed to limit the energy consumption during winter heating period.
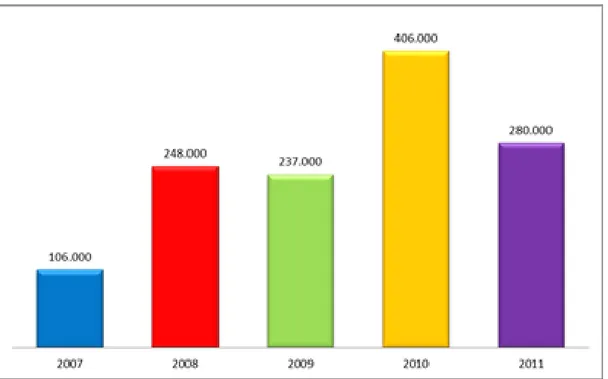
The results have been successful. In 2007, the first year, 106,000 requests for deduction were submitted at once. In the following years the public acceptance for this type of incentives has been further confirmed and strengthened. In late 2008, about 248,000 people had taken advantage of deductions. The following year the situation stabilized with 238,000 interventions, confirming the validity of the measure and the users’ satisfaction. In 2010 all records were broken with 406,000 works performed. A year later, finally, the first results confirmed the same levels of the previous years with about 280,000 interventions.
During the last five years about 15 billion € were spent by taxpayers, over 7,600 GWh of energy per year saved, roughly 1.6 million tons of CO2 emissions avoided. The validity of the incentives has been extended until the
end of December 2012. The ENEA working group, appointed to manage the incentives, supports the renewal as it represents benefits for the citizens and for the government in terms of tax return, energy saved and increase of employment.
The results
The tax deductions of 55%1, in force since January 2007 represents the most generous system of incentives2 ever established by an European Government to promote energy efficiency and sustainable economic development in the Italian real estate system. By the Finance Act 2007 and the subsequent implementation specific works were carried out: the global energy upgrading of buildings and installation of new biomass boilers, the insulation of horizontal and vertical walls, ceilings and floors, replacement of windows and entrance doors, installation of thermal solar panels, replacement of heating systems with condensing boilers or high efficiency heat pumps. All these measures have been established to limit the energy consumption during the winter heating period.
The results have been successful. After a period of some months during which users facing with such a generosity felt incredulous, since autumn 2007 the requests for deductions – referred to implemented efficiency measures – are literally taken off, reaching 106,000 units only in the last quarter of the year. In 2008 the public acceptance for this type of incentive was further confirmed and strengthened. At the end of the year, about 248,000 people took advantage of deductions. The relevant number of requests surprised even the Ministry of Economy and Finance who, getting worried about the lost revenue that was taking shape, was considering stopping the incentives. That initiative was rejected immediately after loud protests by all stakeholders and mainly by people who had already taken action.
The situation was stabilized - still at high levels - in 2009: 237,000 interventions, confirming the validity of the measure and the satisfaction of citizens. The year 2010 was a boom: about 406,000 performed works,
1
The system allows tax cuts on personal income tax (IRPEF) and corporate income tax (IRES) for end-users carrying out energy saving measures for winter heating in existing buildings
2
probably considering the uncertainty of the extension of the deductions beyond December 2010. That fear forced many users to anticipate the renovations planned for the following years, in order not to miss the given opportunity. And finally, in 2011 we still have 280,000 users who performed energy saving works in their own buildings. The future is still uncertain; the bonus of 55%, due at December 31, 2012 could be extended to June 30, 2013, but with a reduced rate of deduction to 50%.3
The flattering results go probably well beyond the expectations of the Italian Ministery: about 1,277,000 people have taken advantage of them, proving an unforeseen success. In this regard, it also acknowledges the results achieved by the ENEA Working Group "Energy Efficiency" has proved its competence and engagement to spread information and technical advices to the public and professionals4.
Also the other numbers referring to the first five years are relevant. Over 15 billion € spent by taxpayers, over 7,600 GWh of energy saved per year, roughly 1.6 million tons of CO2 emissions avoided. The incentives were
planned to stay in force until the end of December 2010 but, because their validity, they have been extended until the end of December 2012. The ENEA working group, appointed to manage the incentives, has strongly supported the renewal as it represents benefits for the citizens and for the government in terms of tax return, energy saved, increase of employment and fight lump. A special ENEA web site has been dedicated for the management of the 55% tax deduction. [1]
A closer look at Figure 1 shows in detail the results of the number of interventions realized in 2007-2010. After a slight growth in 2008, when they doubled compared to 2007, in 2009 the number of interventions has remained nearly unchanged. In 2010 we found an increase by 71% due to the previously explained reasons and finally in 2011 we came back to a stable (but anyway high) level. The total of the realized works amounts to near 1.3 million.
Figure 1 – Number of realized interventions per year (2007 – 2011)
3
Updated at June 8, 2012
4
This team’s work is still ongoing by the link "Contact Us" in the mentioned site, by e-mail consulting and participation in courses, seminars, conferences and trade fairs.
Likewise, Figure 2 shows the total cost incurred during the five years of operations. The trend is obviously similar to the previous one. 2008 was characterized by an increase in work still more than double compared to 2007. The costs referred to 2009 show a slight decrease compared to 2008 but in 2010 they literally took off, as said above.
Figure 2 – Investments supported per year (M€)
Figure 3 describes the results of operations made in terms of energy savings achieved: cost savings have increased from 788 GWh in 2007, to nearly 2000 GWh in 2008 and about 1500 GWh in 2009, till over 2000 in 2010 and 1400 in 2011. According to AEEG (Italian Authority foe Electric Power and Gas), 1 toe saved can be valorized in about 350 € and, consequently, 1 GWht =>30,100 €. So energy saving can be valorized in about 24 M€ for 2007, 59 M€ for 2008, 45 M€ for 2009, 61 M€ for 2010 and 41 M€ for 2011.
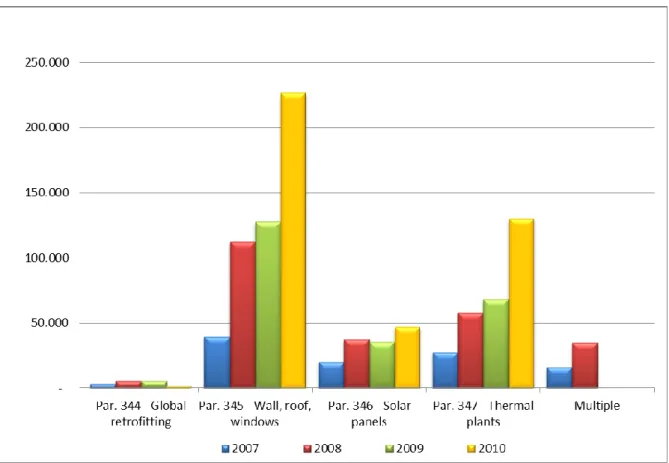
Figure 4 shows the total number of interventions by type (2011 data not available yet) A clear dominance of the replacement of windows and insulation in walls and roofs (about 55% of all jobs) is noticeable. The overwhelming majority is represented by the replacement of windows (the easiest and less invasive tool) with over 91% of these measures (which is approximately half of all). Isolation of vertical and horizontal opaque structures reaches only 8% of the total. Here is the ranking in replacement of heating systems with 27% of the total, the installation of solar panels (over 14%) and the overall redevelopment of the building with just over 2%. And it's understandable that a comprehensive redevelopment of the building work is expensive and complicated even if gives excellent results in terms of energy savings and reduction of CO2 emissions.
Figure 4 – Number of interventions per type
To complete the picture, it’s important to take a look at the performances obtained. Figure 5 shows the average cost of a saved kWh depending on the budget law paragraph (in Italian, comma) referred to and considering the estimated lifetime of the intervention. The installation of Solar panels (comma 346) and the overall retrofitting of the building (comma 344) are far more convenient and the payback time is faster. Please be aware that comma 347 and comma 345 includes respectively replacing of thermal installations and replacement of fixtures and the insulation of walls and roofs.
Figure 5 – Average cost for a saved kWh in 2007-2010 (considering the useful lifetime of installations)
Figure 6 considers the total savings reached by each type of intervention, showing the average annual savings in GWh. Among the five types of works boosted, the best results were obtained by replacing thermal plants (c. 347), followed by the replacement of thermal insulation of walls and new performing windows (c. 345). The above remarks highlight a ratio of 1 to 20 between the most and the less used incentive. It's clear, however, that the costs for achieving each of these works are very different and are usually directly proportional to the energy savings achieved by each one.
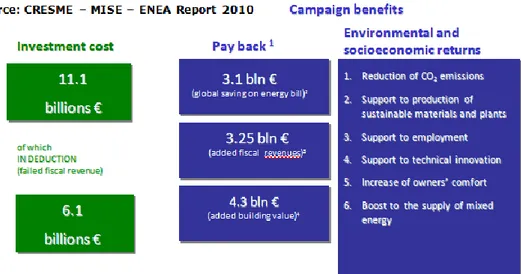
Finally, we propose some considerations for the estimation of the effects of incentives. Referring to Figure 7 we can come-up with some results arising from a recent report prepared by the ENEA Task Force in collaboration with Cresme [2] covering the period 2007-2010. Granted that the 2010 investment costs are under-estimated (at the time of drafting, the final data weren’t known yet) so that real results are still more flattering, it can be seen that the total cost of the investment by users in four years would be 11.1 billion €5. Out of these the 55%, amounting to 6.1 billion, is paid by the State. Given this expenditure, however, we have the following monetary returns: 3.1 billion of savings on energy bills of consumers due to lower consumption of energy during the lifetime of the installation; 3.25 billion € in additional tax revenues on VAT, IRES, income tax paid by companies and professionals engaged in the rehabilitation projects, drawing their incomes; 4.3 billion for the increase in real estate income for the revaluation of reclassified buildings.
Figure 7 – Costs and benefits to 2015 of interventions performed from 2007 to 2010
These data amount to a total of 10.7 billion € exceeding just by themselves the tax burden charged to the State. In addition there are other benefits, not quantified in detail, such as environmental and socio-economic returns, as of the reduction of CO2 emissions resulting from reduced health and social costs, the support to
industrial production of sustainable installations and technologies, increasing the employment, mostly young people, the drive for technological innovation and, last but not least, the increased comfort of the users of buildings and the improvement of the national energy supply mix.
Conclusions
After the presentation of the results of five years of tax deductions, we can point out that, compared to a certain remarkable loss of State revenues, benefits are certainly not less significant. In general, since 2007 a real boom in Italy in the energy efficiency market occurred, both in terms of industrial production, and in terms of employment for the workers involved, not only employees but also professionals.
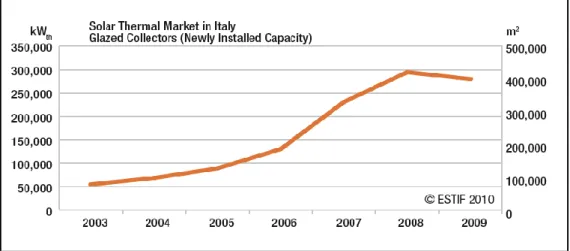
As an example the trend of the solar thermal market from 2003 to 2009 is shown (Fig. 8).
5
At present we can estimate 12,1 Billion Euros, not 11,1; all other data could be considered as underestimated, confirming the success of the 55% tax deduction.
Figure 8 – Solar Thermal Market in Italy (2003 – 2009)
During 2003-2009 the Italian market [3] was growing continuously and had consolidated its second position in Europe, after Germany, with 280 MWt installed during the year 2008. The curve of the increase installed power had soared just from 2007 as showed in Figure 8 [4], when the deductions started. From 2006 to 2008 the turnover of solar thermal quintupled, creating the opportunity for new jobs, estimated as one job every 80 kWt of new installed power. Considering that Italy is only at the 14th place among European countries in terms of installed capacity per capita, we realize the enormous exploitable capacity still available.
But beyond the solar thermal energy success, what could be the strategy to be pursued in the future to achieve maximum results and minimum charges from the system of incentives? Probably the best solution could be found in a mix of measures, by modulating different rates of deduction and identifying products/installations to be boosted in accordance with their expected results. An important role will be played by the Government in accordance with the international agreements and treaties. Some distortions arising in some cases of improper use of incentives could be easily corrected with more information to users and targeted controls by using the database held by ENEA, or imposing more limits of expenditure, targeted for each job, rather than the present ones that sometimes may seem abundant.
This system would be maintained and eventually stabilized and implemented, for example with an appropriate service of information and assistance to users. The contribution given by the ENEA Task Force has been deeply appreciated by the press, the operators and policy-makers as it has helped in targeting energy efficiency and reduction of greenhouse gases. The Italian Government is hoped to be more and more present both to provide assurance in the medium-long term to end-users and to the Italian business system, in order to contribute to achieve the energy-environment targets signed by Italy at European level.
Controls are requested to both professional technicians who have to confirm declared savings in a
preventive way and to the Agenzia delle Entrate (National Revenue Agency) in a final way by asking proof of performed works to applicants. Popularity of the system is due to extreme generosity of the incentive, its simplicity (no authorizations or licenses required) and universality towards all social subjects, so that Government actually is thinking to stabilize these measures till 2020.
References
[1] http://efficienzaenergetica.acs.enea.it
[2] Enea-MSE-Cresme: “Analisi sull’impatto socio-economico delle detrazioni fiscali del 55% per la riqualificazione energetica del patrimonio edilizio esistente”. Roma, July 2010
[3] ESTIF (European Solar Thermal Industry Federation) 2010 [4] European Solar Thermal Industry Federation