ISSN Online: 2152-7393 ISSN Print: 2152-7385
DOI: 10.4236/am.2020.118051 Aug. 24, 2020 771 Applied Mathematics
Mean Difference and Mean Deviation of Tukey
Lambda Distribution
Giovanni Girone1, Antonella Massari2 , Fabio Manca3 , Angela Maria D’Uggento4* 1Faculty of Economics, University of Bari, Largo Abbazia S. Scolastica, Bari, Italy
2Department of Economics, Management and Business Law, University of Bari, Largo Abbazia S. Scolastica, Bari, Italy 3Department of Education, Psychology, Communication, University of Bari, Bari, Italy
4Department of Economics and Finance, University of Bari, Largo Abbazia S. Scolastica, Bari, Italy
Abstract
The purpose of this paper is to broaden the knowledge of mean difference and, in particular, of an important distribution model known as Tukey lambda, which is generally used to choose a model to fit data. We have ob-tained compact formulas, which are not yet reported in literature, of mean deviation and mean difference related to the said distribution model. These results made it possible to analyze the relationships among variability index-es, namely standard deviation, mean deviation and mean difference, regard-ing Tukey lambda model.
Keywords
Mean Difference, Mean Deviation, Tukey Lambda Distribution, Variability Indexes’ Relationships
1. Introduction
The purpose of this work is to increase the methodological contributions on the mean difference and on the relationships of the mean difference with other va-riability indexes [1] [2]. The studies on the mean difference, introduced by Cor-rado Gini in 1912 as a measure of the variability of the characters according to the aspect of inequality, have aroused the interest of many scholars over years and also recently [3] [4]. The importance of mean difference is also due to the fact that the sample mean difference is a correct estimate of that of the popula-tion distribupopula-tion model and, therefore, funcpopula-tional for inferential purposes [5]. The theoretical contributions on the mean difference concern the main continuous distribution models (normal, rectangular, exponential, ...) [6], however, for other
How to cite this paper: Girone, G., Mas-sari, A., Manca, F. and D’Uggento, A.M. (2020) Mean Difference and Mean Devia-tion of Tukey Lambda DistribuDevia-tion. Ap-plied Mathematics, 11, 771-778.
https://doi.org/10.4236/am.2020.118051
Received: July 1, 2020 Accepted: August 21, 2020 Published: August 24, 2020 Copyright © 2020 by author(s) and Scientific Research Publishing Inc. This work is licensed under the Creative Commons Attribution International License (CC BY 4.0).
http://creativecommons.org/licenses/by/4.0/ Open Access
DOI: 10.4236/am.2020.118051 772 Applied Mathematics
distribution models, such as Tukey’s, no contributions are known in literature.
2. Tukey Lambda Distribution
Tukey lambda distribution is usually used to choose a distribution model to fit data and its direct use is less usual. In general, its characteristic is that neither its density function f x
( )
nor its cumulative function F x( )
is known, but onlythe inverse of this latter 1
( )
F− x , that is the quantile function Q(p) [7] [8].
A complete Tukey distribution shape includes three parameters: one of posi-tion, one of scale and one of shape [9] [10].
In order to calculate the mean difference and the mean deviation, it is better to refer to a reduced distribution in which the position parameter is set to zero and the scale to one. Formulas of mean difference and mean deviation of com-plete distribution are equal to the ones of reduced distribution multiplied by the scale parameter value. Tukey lambda distribution is defined by the quantile function
( )
p(
1 p)
, 0 1. x Q p p λ λ λ − − = = < < (1)Said function is not always analytically invertible and, therefore, allows to ob-tain cumulative function and density function only for some values of λ [11]
which are λ = −1, 0,1 4 ,1 3,1 2 ,1, 3 2 , 2, 3, 4. Cumulative functions of Tukey lambda distribution for such values are listed below:
( )
2 4 2 1, , 2 x x F x x x λ= − =− + + + − ∞ < < ∞ (2)( )
1 0, , 1 e x F x x λ= = − − ∞ < < ∞ + (3)( )
2 6(
4)
4 1 1 , 3584 17 1024 12 512 2 , 4 4 4 2 512 x F x x x x x λ= = + − − + + + − < <λ (4)( )
(
)
(
)
3 5 1 3 6 6 1 3 6 6 1 1 5 , 3 2 216 72 5832 108 2916 5832 108 2916 , 3 3 72 x x F x x x x x x x λ = = − + + + + + + + + − < < (5)( )
(
2)
1 1 , 4 8 , 2 2 2 F x 8 x x x λ= = − − − < < (6)( )
1 1, , 1 1 2 x F x x λ= = + − < < (7)( )
(
)
(
)
1 3 2 4 3 2 2 1 3 4 3 2 2 3 , 2 1 1 18 81 3 2 2 1 2 1 45 4 9 , 2 81 3 2 2 3 3 1 45 4 9 2 2 x x F x x x x x x x x x λ= + = − − + + − − + − + − < < − − + − + (8)DOI: 10.4236/am.2020.118051 773 Applied Mathematics
( )
1 2 1 1 2, , 2 2 2 x F x x λ= = + − < < (9)( )
(
)
(
)
1 3 2 1 3 2 1 1 1 1 3, 1 6 1 36 , 2 3 3 6 1 36 F x x x x x x λ = = − + + + − < < + + (10)( )
(
)
(
)
1 3 2 1 3 2 3 1 3 2 36 3 1 432 1 1 1 1 4, 1 , 2 3 36 3 1 432 3 4 4 x x F x x x x λ + + = = − + − < < + + (11)It is necessary to use numerical inversion of Q p
( )
to get a cumulativefunc-tion for other λ values.
Regarding Tukey distribution, some characteristic values as function of λ are known: average, mode, median, standard deviation, asymmetry index, disnor-mality excess index, entropy, characteristic function. Expressions of mean dif-ference and mean deviation are unknown.
3. Variability Indexes of Tukey Lambda Distribution
The variance of Tukey lambda distribution as a function of λ parameter [12] is
(
)
(
)
2 2 2 1 2 1 1 , . 1 2 2 2 2 λ σ λ λ λ λ Γ + = − > − + Γ + (12) By using the cumulative functions derived by the inversion of quantile func-tions of Tukey lambda distribution, mean difference and mean deviation values are obtained and shown in Table 1.Mean difference values for integers from 1 to 10 are arranged exactly on a pa-rabolic hyperbola
( )
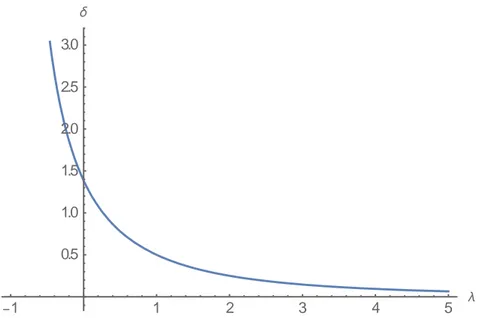
2 4 , 1. 2 3 λ λ λ λ ∆ = > + + (13)Some values of Δ calculated numerically for other values of λ parameter are also all arranged over the said function, which can be then considered a general expression of the mean difference of Tukey lambda distribution. Said function takes not-negative finite values for λ > − , as it can be shown in1 Figure 1.
Therefore, the mean difference in Tukey lambda distribution has a domain 1
λ > − which is wider than the one of standard deviation λ > −1 2.
Let us now consider the mean deviation. First of all, we can see that the aver-age of our distribution exists only for λ > − and, therefore, said domain also 1 applies to mean deviation. Mean deviation values for integers from 1 to 10 are arranged exactly over the function
( )
21(
(
2)
1)
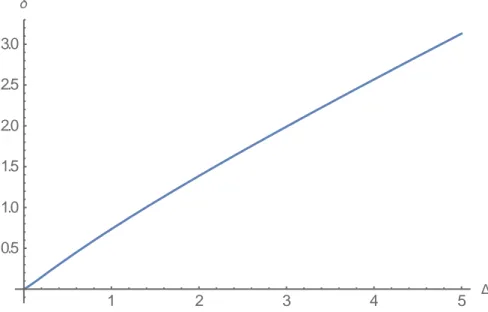
, 1. 1 λ λ δ λ λ λ λ − − = > − + (14)Values of δ calculated numerically for other values of λ parameter are also all ar-ranged exactly over the said function, which can be then considered the expression
DOI: 10.4236/am.2020.118051 774 Applied Mathematics Figure 1. Mean difference of Tukey lambda distribution as a function of λ parameter.
Figure 2. Mean deviation of Tukey lambda distribution as a function of λ parameter.
Table 1. Values of mean difference and mean deviation for some values of λ parameter in Tukey lambda distribution.
λ Δ Δ −1 ∞ ∞ −4/5 50/3 9.263764082403105 −3/4 64/5 7.27245685874591 −2/3 9 5.240144005205601 −3/5 50/7 4.297623404313451 −1/2 16/3 3.3137084989847696 −1/3 18/5 2.339289449053423 1 1 2 3 4 5 1 2 3 4 1 1 2 3 4 5 0.5 1.0 1.5 2.0 2.5 3.0
DOI: 10.4236/am.2020.118051 775 Applied Mathematics Continued −1/4 64/21 2.0182092266958453 0 2 2log2 1/4 64/65 1.018262942376231 1/3 9/7 0.9283476330715509 1/2 16/15 4
(
2 2)
3 − 3/5 25/26 0.7088459262782351 2/3 9/10 0.6660710550945809 3/4 64/77 0.6177469599979266 1 2/3 1/2 3/2 16/35 0.34477152501692165 2 1/3 1/4 5/2 16/63 0.1881653270194103 3 1/5 7/48 4 2/15 3/32 5 2/21 31/480 6 1/14 3/64 7 1/18 127/3584 8 2/45 85/3072 9 2/55 511/23040 10 1/33 93/5120of mean deviation of the Tukey lambda distribution. Said function takes not-negative finite values for λ > − as it can be shown in1 Figure 2.
The mean deviation of Tukey lambda distribution has, therefore, a domain wider than the one of standard deviation.
4. Relations between Variability Indexes of Tukey Lambda
Distribution
By inverting the expression of mean difference in Tukey lambda distribution as a function of λ parameter (13), the following two roots come out
1 3 16 2 λ =− ∆ + ∆ + ∆ ∆ (15) and 2 3 16 . 2 λ =− ∆ − ∆ + ∆ ∆ (16) The second solution, which is always negative, is not usable to obtain the rela-tionship between ∆ and σ [13].
By substituting the first solution λ (15) in the standard deviation expression, 1
it comes out an analytical relationship of the same one related to the mean dif-ference of Tukey lambda distribution:
DOI: 10.4236/am.2020.118051 776 Applied Mathematics
(
)
2 1 2Γ 16 1 1 2 2 2 16 1 2 Γ 16 1 1 , 0. 16 1 3 σ ∆ + − − ∆ + − ∆ + − = ∆ > ∆ + − (17) Said relationship is represented in Figure 3.As it can be seen, standard deviation increases quickly when mean difference increases.
Let us, now, consider the relationship between mean difference and mean deviation.
By substituting root λ in the formula of mean deviation (14), it comes out 1
the following analytical relationship
( )
16 1 3 2 2 2 2 1 , 0. 16 4 1 1 δ + ∆ − − ∆ = ∆ > + − − ∆ ∆ (18)As shown in Figure 4, it is evident that the relationship between the two in-dexes is almost linear.
Finally, let us consider the relationship between mean deviation and standard deviation of Tukey lambda distribution.
Since it is not possible to obtain λ parameter as a function of mean devia-tion, it is necessary to use a numerical procedure to calculate the two variability indexes values for a consistent set of λ parameter values and to represent pairs of values on a Cartesian axis.
By choosing values of λ: −0.49, −0.48, ..., 5.00, it comes out a numerical rela-tionship as shown in Figure 5.
Figure 3. Analytical relationship between mean difference and standard deviation of Tu-key lambda distribution.
1 2 3 4 5 2 4 6 8 10 12
DOI: 10.4236/am.2020.118051 777 Applied Mathematics Figure 4. Analytical relationship between mean difference and mean deviation of Tukey lambda distribution.
Figure 5. Numerical relationship between mean deviation and standard deviation of Tu-key lambda distribution.
As it can be seen, the relationship between mean deviation and standard devi-ation of Tukey Lambda distribution increases with slow accelerdevi-ation.
5. Conclusive Remarks
In this work, the formulas of mean difference and mean deviation of Tukey Lambda distribution have been obtained. It is an original contribution aimed at increasing the knowledge about this distribution model. These results allowed us to investigate the relationships among the three main variability indexes, standard deviation, mean deviation and mean difference, regarding Tukey lambda model.
1 2 3 4 5 0.5 1.0 1.5 2.0 2.5 3.0 0.5 1.0 1.5 2.0 2.5 3.0 3.5 1 2 3 4
DOI: 10.4236/am.2020.118051 778 Applied Mathematics
Conflicts of Interest
The authors declare no conflicts of interest regarding the publication of this paper.
References
[1] Girone, G., Massari, A. and Manca, F. (2016) The Relation between the Mean Dif-ference and the Standard Deviation in Continuous Distribution Models. Quality and Quantity, 51, 481-507. https://doi.org/10.1007/s11135-016-0398-y
[2] D’Uggento, A.M., Girone, G. and Marin, C. (2016) The Relation between the Mean Difference and the Mean Deviation in 11 Continuous Distribution Models. Quality and Quantity, 51, 595-615. https://doi.org/10.1007/s11135-016-0427-x
[3] Davydov, Y. and Greselin, F. (2019) Inferential Results for a New Measure of In-equality. The Econometrics Journal, 22, 153-172.
https://doi.org/10.1093/ectj/utz004
[4] Greselin, F. and Zitikis, R. (2018) From the Classical Gini Index of Income Inequa-lity to a New Zenga-Type Relative Measure of Risk: A Modeller’s Perspective. Eco-nometrics, 6, 1-20. https://doi.org/10.3390/econometrics6010004
[5] Girone, G. and Mazzitelli, D. (2007) La differenza media nei principali modelli distributivi continui. Annali del Dipartimento di Scienze Statistiche “Carlo Cecchi”, VI, 43-62.
[6] Girone, G., Massari, A., Campobasso, F., Manca, F., D’Uggento, A.M., Marin, C. and Nannavecchia, A. (2017) Rassegna sulla differenza media di distribuzioni teoriche continue. Rivista di Economia e Commercio, V, 13-28.
[7] Ramberg, J. and Schmeiser, B. (1972) An Approximate Method for Generating Symmetric Random Variables. Communications of the ACM, 15, 987-990. https://doi.org/10.1145/355606.361888
[8] Ramberg, J., et al. (1979) A Probability Distribution and Its Uses in Fitting Data.
Technometrics, 21, 201-214. https://doi.org/10.1080/00401706.1979.10489750 [9] Tukey, J. (1960) The Practical Relationship between the Common Transformations
of Percentages of Counts and Amounts. Technical Report 36, Statistical Techniques Research Group, Princeton University.
[10] Johnson, N.L. and Kotz, S. (1973) Extended and Multivariate Tukey Lambda Dis-tributions. Biometrika, 60, 655-661. https://doi.org/10.1093/biomet/60.3.655 [11] Sarabia, J.M. (1997) A Hierarchy of Lorenz Curves Based on the Generalized
Tu-key’s Lambda Distribution. Econometric Reviews, 16, 305-320. https://doi.org/10.1080/07474939708800389
[12] Johnson, N., Kotz, S. and Balakrishnan, N. (1994) Continuous Univariate Distribu-tions. Vol. 1, Wiley, New York, 1994.
[13] Hastings, C., Mosteller, F., Tukey, J.W. and Winsor, C.P. (1947) Low Moments for Small Samples: A Comparative Study of Order Statistics. Annals of Mathematical Statistics, 18, 413-426. https://doi.org/10.1214/aoms/1177730388
Attributions
Girone Section 1; Massari Section 3; Manca Section 4; D’Uggento Sections 2 and 5.