Titolo
Experimental
investigation
of thermal hydraulic
instabilities
in Steam Generator helical coil
tubes
Ente emittente CIRTEN
PAGINA DI GUARDIA
Descrittori
Tipologia del documento:
Collocazione contrattuale:
Rapporto Tecnico
Accordo di programma ENEA-MSE: tema di ricerca "Nuovo nucleare da fissione"
Reattori nucleari evolutivi Reattori nucleari ad acqua
Argomenti trattati:
Sommario
Il documento descrive gli studi effettuati dal CIRTEN (POLIMI) sulle instabilità del flusso utilizzando il mock-up del generatore di vapore a doppio tubo prototipico esistente nell'area sperimentale SIET e già modificato a questo scopo nel PAR2007. Le nuove prove sono state indirizzate allo studio in dettaglio delle instabilità termoidrauliche di tipo DWOs (Density Wave Oscillations) ed hanno portato alla caratterizzazione della potenza di soglia per l' innescarsi di fenomeni di instabilità a differenti valori di portata, pressione e temperatura in ingresso. La disponibilità di dati sperimentali ha inoltre permesso di proseguire l'attività di sviluppo di un modello analitico che permette di individuare i parametri più importanti al fine della corretta predizione della soglia di instabilità.
Note
REPORT PAR 2008-09 LP2.B2 CERSE-POLIMI RL 1355/2011
Autori: M. Colombo, D. Papini, A. Cammi, M.E. Ricotti
Politecnico di Milano, Dipartimento di Energia, Sezione Energia Nucleare-CeSNEF
Copia n. In carico a: NOME FIRMA NOME FIRMA
jL
t
~
r
(UJ
o.
/
NOMENA
FIRMA DATA CONVALIDA 21
P. MeloniNA
o
EMISSIONE VISTO APPROVAZIONE REV. DESCRIZIONEPOLITECNICODIMILANO
DIPARTIMENTO DI ENERGIA, Sezione INGEGNERIA NUCLEARE-CeSNEF
Experimental investigation of thermal hydraulic
instabilities in Steam Generator helical coil tubes
M. Colombo, D. Papini, A. Cammi, M.E. Ricotti
CERSE POLIMI RL 1355/2011
Milano, Settembre 2011
Lavoro svolto in esecuzione della linea progettuale LP2– punto B2b AdP MSE
‐
ENEA “Ricerca di Sistema Elettrico” - PAR2008-09LP2.B2b - 2 - CERSE-POLIMI RL-1355/2011 INDEX
EXECUTIVE SUMMARY... ‐ 4 ‐
1
Density Wave Oscillations ... ‐ 7 ‐
1.1
Introductory background on density wave instability ... - 7 -
1.2
Review of density wave instability studies ... - 9 -
1.2.1
Experimental investigations on density wave oscillations... - 9 -
1.2.2
Theoretical researches on density wave oscillations ... - 10 -
1.2.3
Numerical code simulations on density wave oscillations ... - 10 -
2
Experimental Campaign ... ‐ 11 ‐
2.1
The experimental facility ... - 11 -
2.2
Experimental procedure ... - 14 -
2.3
Ranges of explored variables ... - 14 -
2.4
DWO characterization... - 15 -
2.5
Experimental results... - 16 -
2.5.1
Effect of system pressure... - 19 -
2.5.2
Period of oscillations and transit time ... - 20 -
2.6
Effect of inlet throttling... - 21 -
2.7
Ledinegg type instabilities ... - 22 -
3
Analytical Modelling ... ‐ 23 ‐
3.1
Analytical lumped parameter model: fundamentals and development... - 23 -
3.1.1
Mathematical modelling... - 24 -
3.1.2
Model development ... - 25 -
3.1.3
Linear stability analysis... - 26 -
3.2
Analytical lumped parameter model: results and discussion... - 27 -
3.2.1
System transient response... - 27 -
3.2.2
Description of a self-sustained DWO... - 29 -
3.2.3
Sensitivity analyses and stability maps... - 30 -
4
Numerical Modelling by means of RELAP5 Code... ‐ 32 ‐
4.1
Model and numerical settings ... - 32 -
4.2
Results and discussion... - 34 -
4.2.1
BWR subchannel geometry ... - 34 -
4.2.2
Parametric study ... - 36 -
5
Numerical Modelling by means of COMSOL Code... ‐ 37 ‐
5.1
Mathematical formulation and model development... - 37 -
5.2
Results and discussion... - 40 -
6
Validation Benchmark of Analytical and Numerical Studies on DWOs... ‐ 42 ‐
6.1
Main achievements... - 43 -
7
Comparison between Models and Experimental Results... ‐ 45 ‐
LP2.B2b - 3 - CERSE-POLIMI RL-1355/2011
7.2
RELAP5 modelling of the experimental facility... - 46 -
ACRONYMS... ‐ 49 ‐
NOMENCLATURE ... ‐ 49 ‐
Subscripts... - 50 -
Superscripts... - 51 -
REFERENCES... ‐ 52 ‐
LP2.B2b - 4 - CERSE-POLIMI RL-1355/2011
EXECUTIVE SUMMARY
This document presents the research activities carried out by Politecnico di Milano on the subject of Density Wave Oscillations (DWOs), probably the most representative instabilities encountered in boiling systems. DWOs may constitute an issue of special interest for all the industrial systems and equipments operating with water-steam mixture. Concerning the nuclear field, instability phenomena can be triggered both in Boiling Water Reactor (BWR) fuel channels (where they are moreover coupled through neutronic feedbacks with the neutron field) and in once-through steam generators (SGs), which experience boiling phenomena inside parallel tubes. The latter, in particular, are considered in this document with respect to integral Small-medium Modular Reactor (SMR) applications.
In steam power systems extensive attention is required to avoid thermal induced oscillations of the flow rate and system pressure, as they can cause mechanical vibrations, problem of system control and heat transfer surface burn-out issues. In addition, instability becomes very difficult to be detected in presence of parallel channels, since the total mass flow rate in the system remains constant while the instability is locally triggered among some of the channels. In this conditions, continual cycling of the wall temperature can lead to thermal fatigue problems which may result in tube failure. As a consequence the importance of determining the safe operating regions of a steam generator through definition of the threshold values of system parameters such as flow rate, pressure, inlet temperature and exit quality. To the aim, both basic experiments and numerical analyses are necessary.
The Nuclear Engineering Division of the Department of Energy carried out an extensive research program, both experimental and theoretical, focused on DWOs in parallel channels, in particular dealing with two helically coiled tubes of the IRIS (International Reactor Innovative and Secure) steam generator [1]. The experimental activity presented the unique feature to investigate the influence of the helical shape (through the centrifugal field induced by tube bending) on instability occurrence, as well as to provide a useful database for models validation and numerical codes assessment. Together with experiments, the development of dedicated analytical models and the adoption of proper numerical simulation tools was of utmost importance to prepare the campaign (pre-test analysis) and interpret the data collected (post-test analysis), gaining an insight into the physical mechanism at the source of DWOs. Main achievements of the research activity are collected in this report.
The experimental program was realized in a full-scale open loop test facility installed and operated at SIET labs in Piacenza, simulating the thermal hydraulic behaviour of a helically coiled SG [2]. The facility includes two helical tubes representing the SG of an integral Pressurized Water Reactor (PWR) of Generation III+, connected via lower and upper headers. Experiments were conducted at 3 different levels of pressure (80 bar, 40 bar and 20 bar) and 3 values of mass flux (600 kg/m2s,400 kg/m2s and 200 kg/m2s), exploring a large range of inlet subcoolings between -30% and the saturation value. The test matrix was executed maintaining fixed the configuration of inlet valves (corresponding valve loss coefficient kin = 45). The effect of inlet throttling was at last studied at 40 bar and 400 kg/m2s.
Data collected permitted to underline many distinctive features of DWOs and to characterize the stable and unstable operating regions of the system, so the effects of system pressure, flow rate and inlet subcooling on the power at the onset of instability. While the effects of thermal power and mass flow rate in determining the channel exit quality triggering the instability was found consistent with classical DWO theory in straight channels, experimental data highlighted a peculiar effect of inlet subcooling. In particular, an increase in inlet subcooling is known from literature to have a stabilizing effect at high subcoolings and a destabilizing effect at low subcoolings. Conversely, in accordance
LP2.B2b - 5 - CERSE-POLIMI RL-1355/2011
with experimental data, at low subcoolings the subcooling maintains its stabilizing effect, which increases indeed as the inlet temperature approaches the saturation value. Discrepancies were found also in the values of the period to transit time ratio. In particular the period of oscillations appears rather independent on inlet subcooling and causes the period to transit time ratio to increase with the inlet temperature. Mentioned deviations from literature results have been ascribed to the helical geometry and the peculiar geometrical characteristics of the test section.
Finally, some Ledinegg-type instabilities have been recorded in particular operating conditions, that is at the lowest system pressure (p = 20 bar), the highest mass flux (G = 600 kg/m2s) and higher inlet subcooling values (x
in < -15%). Therefore they are briefly discussed and analysed in this report.
The modelling effort was mainly focused on the development of an analytical lumped parameter model, moving boundary type, based on the integration of mass, energy and momentum 1D equations. Homogeneous two-phase flow model has been assumed in the boiling region. Non-linear features of the modelling equations permitted to investigate the complex phenomena and interactions being at the source of the instability mechanism. Moreover several sensitivity studies were made to identify in the proper simulation of two-phase frictional pressure drop the most critical issue for a correct prediction of the instability threshold.
The analytical model was applied at first to the simple and acknowledged case of vertical tube geometry and the theoretical predictions have been validated with qualified numerical simulation tools. Both the thermal hydraulic code RELAP5 and the multi-physics code COMSOL have been successfully applied to predict instability thresholds obtaining a useful validation benchmark for the developed models [3].
As concerns the COMSOL multi-physics code, a thermal hydraulic 1D simulator for water-steam mixture has been developed, including both single-phase and two-phase regions. Initially the simple homogeneous flow model (HEM) was assumed, as for the analytical model, but afterwards also the more accurate Drift-Flux Model (DFM) was implemented. The latter permits to account for slip effects due to the relative velocity between the two-phases.
In addition to the comparison of stability maps obtained with time domain simulations, also a linear stability analysis leading to the definition of system eigenvalues was successfully completed, both with the analytical model and the COMSOL code. Linear analysis showed to be a quick and powerful tool generally for instability studies and in particular when addressing the influence of the two-phase friction model. In this respect, thanks to the possibility of implementing most various kinds of two-phase flow models, the COMSOL code demonstrated the capability to be easily adaptable to many different heated channel systems.
As concerns the RELAP5 code, a preliminary code assessment procedure has been addressed, aiming at highlighting its strengths and weaknesses with respect to DWO predictions. As stated before, instability thresholds were correctly reproduced by the code dealing with simple vertical tube geometry, both in single and in parallel channel configurations [4][5]. To reproduce the experimental facility installed at SIET labs, 32 m long and 8 m high, inclined tubes have been modelled with the RELAP5 code. A parametric study has been made changing step by step geometric parameters, considering separately channel length and channel inclination. The influence of the inclination was correctly reproduced, resulting in a more stable system when approaching vertical orientation at fixed tube length, due to the increase in gravitational pressure drops. Larger stability region was recorded increasing channel length at fixed inclination in case of two parallel channels, the same effect vanishing instead in single heated channels. The latter result seems to suggest some difficulties of the RELAP5 code in addressing more complex geometry with respect to a simple vertical channel.
LP2.B2b - 6 - CERSE-POLIMI RL-1355/2011
Finally the results provided by the analytical model and the RELAP5 code have been compared to the experimental data for validation purposes. The analytical model has been satisfactorily applied to the simulation of the experimental results. Correct representation of the stationary pressure drop distribution (partially accomplished thanks to the experimental tuning of a sound friction correlation) has been identified as fundamental before providing any accurate instability calculations. In this respect, the RELAP5 code cannot be regarded for the time being as a proven tool to study DWO phenomena in helically coiled tubes.
The activity characterized itself has the prosecution of the project line LP2.G1 of PAR 2007, reported in [6] and focused essentially on pre-test analyses. For the sake of clarity some subjects of [6] are recovered in this report, in particular a general presentation on the subject of Density Wave Oscillations in Section 1, the description of the experimental facility, the experimental procedure and the explored variables in Section 2 and a brief presentation of the analytical model development in Section 3. Preliminary limited experimental and analytical model results already included in [6] are also repeated.
LP2.B2b - 7 - CERSE-POLIMI RL-1355/2011
1 D
ENSITYW
AVEO
SCILLATIONS1.1 Introductory background on density wave instability
Density Wave Oscillations (DWOs) and more generally two-phase flow instabilities have been studied since the ’60, being of interest to the design and operation of many different industrial systems. As a matter of fact, thermally induced oscillations of the flow rate and system pressure are undesirable, as they can cause mechanical vibrations, thermal fatigue, problems of system control, and in extreme circumstances disturb the heat transfer and promote thermal crisis occurrence. Thus, it is of great importance to study the effect on the onset of instability of system parameters such as thermal power, flow rate, pressure, inlet temperature and exit quality. The evaluation of the instability threshold values permits to determine the safe operating regions of a two-phase heat exchanger.
The various types of self-sustained oscillations which could arise in a boiling channel have been reviewed and classified in different literature works [6][8][9]. Density Wave Oscillations (DWOs) are classified among “dynamic type” instabilities, as they are triggered by transient inertia, lags and feedbacks between the flow rate, the vapor generation rate and the pressure drops in the boiling channel. A description of the physical mechanism leading to the appearance of DWOs is provided by Yadigaroglu and Bergles [10], with respect to a single heated channel with an imposed total pressure drop across. DWOs are induced by delays in the transient distribution of pressure drops along the tube, which originate from the difference in density between the subcooled liquid entering the channel and the water-steam mixture exiting. If the pressure drop along the channel is imposed, a sudden pressure drop perturbation necessarily leads to a flow rate perturbation. An instantaneous perturbation of the flow rate causes an enthalpy perturbation propagating throughout the channel, which affects both the boiling boundary position and the length of the single-phase and two-phase regions. The result is a perturbation in the single-two-phase pressure drop - say δ∆p1 - and a delayed two-phase
pressure drop perturbation of the opposite sign - say δ∆p2 -. The latter creates a feedback pressure perturbation of the
opposite sign in the single-phase region, which can either attenuate or reinforce δ∆p1. With correct timing, single-phase
region and two-phase region pressure terms oscillate in counter-phase, flow oscillation becomes self-sustained and waves of “heavier” (higher density) and “lighter” (lower density) fluid propagate through the channel (Figure 1). According to this description, as an oscillating cycle is completed by the passage of two perturbations, the period of oscillations should be of the order of twice the mixture transit time.
Figure 1 - Density wave instability mechanism in a single boiling channel, and respective feedbacks between main physical quantities. (Reproduced from [7]).
LP2.B2b - 8 - CERSE-POLIMI RL-1355/2011 In recent years, Podowski [11] and Rizwan-uddin [12] proposed different descriptions based on more complex relations between the system parameters. Their explanation is based on the different speeds of propagation of velocity perturbations between the single-phase region (speed of sound) and the two-phase region (so named kinematic velocity). The oscillations seem to be more likely related to mixture velocity variations rather than to mixture density variations, in particular at high inlet subcoolings. The result is a period of oscillations equal to even three or four times the mixture transit time.
The operating point of a boiling channel is therefore determined by many different parameters, which also influence its stability. Once fluid properties, channel geometry and system operating pressure have been defined, major role is played by the three quantities flow rate Γ, inlet subcooling ∆hin (in enthalpy units) and total thermal power q supplied to the
channel. Therefore stable and unstable system operating regions could be represented in a three-dimensional space (Γ, ∆hin, q), whereas a mapping of these regions in two dimensions is referred to as the stability map of the system. No
universal stability map exists, and different ones have been proposed over the years. The most successful is due to Ishii and Zuber [13], who introduced phase change number Npch and subcooling number Nsub. The phase change number
scales the characteristic frequency of phase change Ω to the inverse of a single-phase transit time in the system, instead the subcooling number measures the inlet subcooling:
l lv lv in lv lv in pch ν ν h q L w h q ν L w N ⋅ ⋅ = ⋅ = = Γ / / Ω '' ' ; (1) l lv lv in sub
ν
ν
h
h
N
=
∆
⋅
. (2)The advantage of Ishii’s dimensionless parameters is that they include the effect of pressure variations through the ratio between specific volumes (νlv/νl). A typical stability map in the Npch-Nsub plane is depicted in Figure 2. The usual
stability boundary shows the classical “L shape” inclination and follows a line of nearly constant equilibrium quality at high inlet subcooling. The stability boundary divides the Npch-Nsub space in two regions: the stable region on the
left-hand side (lower Npch, lower power supplied) and the unstable region on the right-hand side (higher Npch, higher power
supplied).
Figure 2 – Example of stability map in the dimensionless plane Npch - Nsub.
LP2.B2b - 9 - CERSE-POLIMI RL-1355/2011
Effect of thermal power, flow rate and exit quality. An increase in thermal power supplied to the channel is
destabilizing. In the same way, a stable system can be made unstable reducing the flow rate. Both effects increase the exit quality, which turns out to be a key parameter for system stability. The destabilizing effect of increasing the ratio
q/Γ is universally accepted.
Effect of inlet subcooling. The effect of inlet subcooling increase is stabilizing at high subcoolings and destabilizing at
low subcoolings. Instability threshold assumes therefore the classical “L shape”. This behavior is explainable by the fact that an increase or a decrease of inlet subcooling shifts the channel toward single-phase liquid and vapor operation respectively, hence out of the unstable two-phase operating mode.
Effect of pressure level. An increase in operating pressure is found to be stabilizing, although one must be careful in
stating which system parameters were kept constant while the pressure level was increased. Ishii [14] showed that stability boundaries calculated at three different pressure levels were almost overlapped in the Npch-Nsub plane,
demonstrating the usefulness of νlv/νl ratio adopted in the dimensionless numbers to account for pressure effect.
Effect of inlet and exit throttling. The effect of inlet throttling is always strongly stabilizing, leading to an increase of
single-phase pressure drop term, which promotes system stability. A flow resistance is frequently placed at channel inlet to assure stability of otherwise unstable channel. On the contrary, exit throttling is found to be destabilizing, by increasing two-phase region pressure drops, which act against system stability.
1.2 Review of density wave instability studies
1.2.1 Experimental investigations on density wave oscillations
The majority of the experimental works on the subject, collected in several literature reviews [6][9], deals with straight tubes and few meters long test sections. Moreover, all the aspects associated with DWO instability have been systematically analysed in a limited number of works. Systematic study of density wave instability means to produce well controlled experimental data on the onset and the frequency of this type of oscillation, at various system conditions (and with various operating fluids).
Amongst them, are worthy of mention the pioneering experimental works of Saha et al. [15], using a uniformly heated single boiling channel with bypass, and of Masini et al. [16], working with two vertical parallel tubes. To the best of our knowledge, scarce number of experiments was conducted studying full-scale long test sections (with steam generator tubes application), and no data are available on the helically coiled tube geometry (final objective of the present work). Indeed, numerous experimental campaigns were conducted in the past using refrigerant fluids (such as R-11, R-113 ...), due to the low critical pressure, low boiling point, and low latent heat of vaporization. That is, for instance, the case of the utmost work of Saha et al. [15], where R-113 was used as operating fluid.
In the recent years, some Chinese researches [17] experimentally studied the flow instability behaviour of a twin-channel system, using water as working fluid. Indeed, a small test section with limited pressure level (maximum pressure investigated is 3 MPa) was considered; systematic execution of a precise test matrix, as well as discussions about the oscillation period, are lacking.
LP2.B2b - 10 - CERSE-POLIMI RL-1355/2011
1.2.2 Theoretical researches on density wave oscillations
Two general approaches are possible for theoretical stability analyses on a boiling channel: - frequency domain, linearized models;
- time domain, non-linear models.
In frequency domain [18], governing equations and necessary constitutive laws are linearized about an operating point and then Laplace-transformed. The transfer functions obtained in this manner are used to evaluate the system stability by means of classic control-theory techniques. This method is inexpensive with respect to computer time, relatively straightforward to implement, and is free of the numerical stability problems of finite difference methods.
The models built in time domain permit either 0D analyses [19][20], based on the analytical integration of conservation equations in the competing regions, or more complex but accurate 1D analyses [21][22][23], by applying numerical solution techniques (finite differences, finite volumes or finite elements). In these models the steady-state is perturbed with small stepwise changes of some operating parameter simulating an actual transient, such as power increase in a real system. The stability threshold is reached when undamped or diverging oscillations are induced. Non-linear features of the governing equations permit to grasp the feedbacks and the mutual interactions between variables triggering a self-sustained density wave oscillation. Time domain techniques are indeed rather time consuming when used for stability analyses, since a large number of cases must be run to produce a stability map, and each run is itself time consuming because of the limits on the allowable time step.
Numerous lumped parameter and distributed parameter stability models, both linear and non-linear, have been published since the ’60-’70s. Most important literature reviews on the subject [6][8][9] collect the large amount of theoretical researches. It is just noticed that the study on density wave instabilities in parallel twin or multi-channel systems represents still nowadays a topical research area. For instance, Muñoz-Cobo et al. [19] applied a non-linear 0D model to the study of out-of-phase oscillations between parallel subchannels of BWR cores. In the framework of the future development of nuclear power plants in China, Guo Yun et al. [22] and Zhang et al. [23] investigated DWO instability in parallel multi-channel systems by using control volume integrating method. Schlichting et al. [20] analysed the interaction of PDOs (Pressure Drop Oscillations) and DWOs for a typical NASA type phase change system for space exploration applications.
1.2.3 Numerical code simulations on density wave oscillations
On the other hands, qualified numerical simulation tools can be successfully applied to the study of boiling channel instabilities, as accurate quantitative predictions can be provided by using simple and straightforward nodalizations. In this frame, the best-estimate system code RELAP5, based on a six equations non-homogeneous non-equilibrium model for the two-phase systems, was designed for the analysis of all transients and postulated accidents in LWR nuclear reactors, including Loss Of Coolant Accidents (LOCAs) as well as all different types of operational transients [24]. In the recent years, several numerical studies published on DWOs featured the RELAP5 code as the main analysis tool. Amongst them, Ambrosini & Ferreri [25] performed a detailed analysis about thermal hydraulic instabilities in a boiling channel using the RELAP5/MOD3.2 code. In order to respect the imposed constant pressure drop boundary condition, which is the proper boundary condition to excite the dynamic feedbacks that are at the source of the instability mechanism, a single channel layout with impressed pressures, kept constant by two inlet and outlet plena,
LP2.B2b - 11 - CERSE-POLIMI RL-1355/2011 was investigated. The Authors demonstrated the capability of the RELAP5 system code to detect the onset of DWO instability.
The multi-purpose COMSOL Multiphysics® numerical code [26] can be applied to study the stability characteristics of
boiling systems too. Widespread utilization of COMSOL code relies on the possibility to solve different numerical problems by implementing directly the systems of equations in PDE (Partial Differential Equation) form. Respective PDEs are then solved numerically by means of finite element techniques. It is just mentioned that this approach is globally different from previous one discussed (i.e., the RELAP5 code), which indeed considers finite volume discretizations of the governing equations, and of course from the simple analytical treatments described in Section 3.1. In this respect, linear and non-linear stability analyses by means of the COMSOL code have been provided by Schlichting et al. [27], who developed a 1D drift-flux model applied to instability studies on a boiling loop for space applications.
2 E
XPERIMENTALC
AMPAIGN2.1 The experimental facility
The experimental facility, built and operated at SIET labs, is an extension of an electrically heated test section used for the study of the thermal hydraulics of a helically coiled SG tube (two-phase pressure drops under diabatic and adiabatic conditions and dryout thermal crisis occurrence) [28]. In the framework of the IRIS (International Reactor Innovative and Secure) project [29], the same test section was also included in a closed loop circuit, to study a passive heat removal system with natural circulation [30]. The facility, provided with SG full elevation and suited for prototypical thermal hydraulic conditions reproduction, implements the common simplification given by a constant heat flux boundary (via electrical power) instead of real controlled temperature boundary. When dealing with experiments on instability phenomena, despite different dynamic responses, such different boundary is expected to secondarily affect the instability threshold (as the instability inception is induced by the specific thermal power supplied, owing to the reached thermodynamic quality).
Coil diameter (1 m) has been chosen as representative of a mean value of IRIS steam generator tube, while tube inner diameter (12.53 mm) is the commercially scheduled value nearer to IRIS real value (13.24 mm). The heated tube is thermally insulated by means of rock wool. Thermal losses were measured via runs with single-phase hot pressurized water flowing inside the steam generator, and estimated as a function of the temperature difference between external tube wall and the environment.
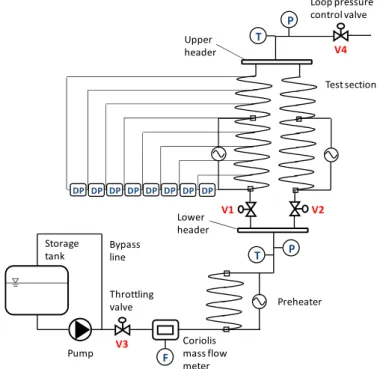
The facility was renewed to test DWOs in parallel channels, by adding a second helical tube identical to the first one (same coil diameter, pitch and length). The two helices have been connected with common lower and upper headers to provide the constant pressure drop boundary condition required for the instability inception. The conceptual sketch of the new facility is depicted in Figure 3, whereas a global and a detailed views are provided in Figure 4. Geometrical data of the two helical tubes are listed in Table 1.
The whole facility is made by a supply section and a test section. The supply section feeds demineralized water from a tank to the test section, by means of a centrifugal booster pump and a feed water pump, i.e. a volumetric three cylindrical pump with a maximum head of about 200 bar.
LP2.B2b - 12 - CERSE-POLIMI RL-1355/2011
Storage tank V1 V2 V3 V4 Pump Throttling valve Coriolis mass flow meter Loop pressure control valve Preheater Test section Lower header Upper header Bypass line DP DP DP DP DP DP DP DP F T T P P
Figure 3 – Sketch of the experimental facility installed at SIET labs.
Figure 4 – Global view (a) and detailed picture (b) of the helical coil test facility (SIET labs).
The flow rate is controlled by a throttling valve (V3) positioned downwards the feed water pump and after a bypass line. System pressure control is accomplished by acting on a throttling valve (V4) placed at the end of the steam generator. An electrically heated preheater is located before the test section, and allows creating the desired temperature at the inlet of the test section. The test section is electrically heated via Joule effect by DC current. Two distinct, independently controllable and contiguous sections are provided. For instability experiments, power was supplied only to the first section (24 m), instead the second section (8 m) worked as a riser unheated section.
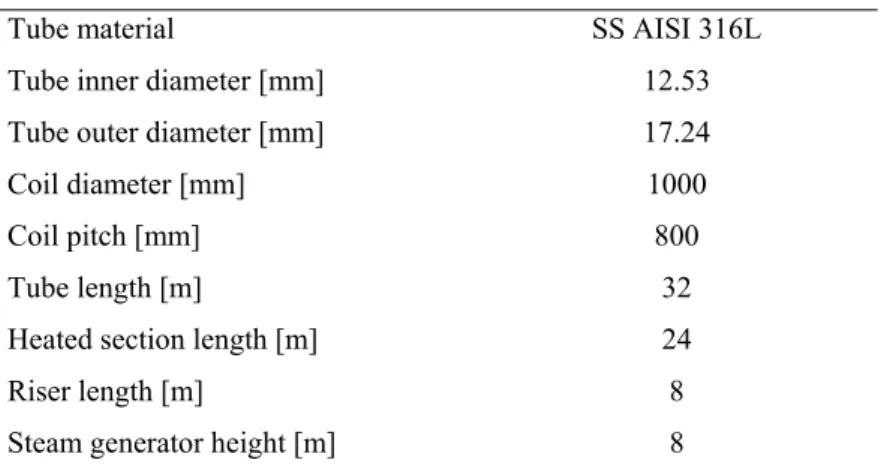
LP2.B2b - 13 - CERSE-POLIMI RL-1355/2011 Table 1 – Test section main data.
Tube material SS AISI 316L
Tube inner diameter [mm] 12.53 Tube outer diameter [mm] 17.24
Coil diameter [mm] 1000
Coil pitch [mm] 800
Tube length [m] 32
Heated section length [m] 24
Riser length [m] 8
Steam generator height [m] 8
Each tube is provided at inlet with a calibrated orifice (with a differential pressure transmitter) used to measure the flow rate in each channel and to visually detect the instability inception, and with a valve to impose a concentrated pressure drop. V1 and V2 represent the total pressure drop (instrumented orifice + valve) introduced at the inlet of the two helical tubes, respectively.
The water pressures at inlet and outlet headers are measured by absolute pressure transducers; nine pressure taps are disposed nearly every 4 m along one tube and eight differential pressure transducers connect the pressure taps. Detailed distances between the taps are reported in Table 2. An accurate measurement of the total flow rate is obtained by a Coriolis flow-meter, placed between the pump and the preheater. Bulk temperatures are measured with K-class thermocouples drowned in a small well at SG inlet and outlet headers. Wall thermocouples (K-class) are mounted throughout the two coils, with fining near the ends to identify the risk of dryout occurrence. Electrical power is obtained via separate measurement of current (by a shunt) and voltage drop along the test section by a voltmeter.
All the measurement devices have been tested and calibrated at the certified SIET labs. A summary of the uncertainties is reported in Table 3.
Table 2 – Pressure taps distribution along the test section (Channel A). Tap 1 Tap 2 Tap 3 Tap 4 Tap 5 Distance from
tube inlet [m] 0.20 5.17 9.19 13.15 17.14
Tap 6 Tap 7 Tap 8 Tap 9 Distance from
tube inlet [m] 21.64 25.59 29.09 32.06 Table 3 – List of the uncertainties of physical quantities (referred to measurement values).
Water flow rate ± 1%
Fluid bulk and wall temperature ± 0.7 °C
Absolute pressure ± 0.1%
Differential pressure ± 0.4% Supplied electrical power ± 2.5% Evaluated thermal losses ± 15%
LP2.B2b - 14 - CERSE-POLIMI RL-1355/2011 2.2 Experimental procedure
It was decided to act on the electrical power supplied to the test section in order to reach flow unstable conditions starting from a stable operating system. In every test run, the heating power was gradually increased from nominal values up to the appearance of flow instability.
The adopted test procedure can be summarized in the following steps: (1) Registration of the gravitational head of the different instruments.
(2) Characterization of the normal behaviour of the system (for instance, check that, at open V1 and V2 valves, the flow rate is reasonably balanced between the two coils).
(3) Impose the defined position of V1 and V2 valves. (4) Define pressure level.
(5) Impose a value of flow rate.
(6) Impose a value of inlet subcooling by means of the preheater.
(7) Reach the desired pressure level by generating vapour with power increase. When the desired pressure is obtained, keep the system in a steady-state condition (measurements of temperature, pressure, flow rate and heat input).
(8) The electrical power is progressively increased by small amounts (small steps of 2-5 kW per tube), until sustained oscillations are observed (check that the system pressure remains more or less constant).
(9) Once the instability is recorded, take the system back to step 6, and change the subcooling. Repeat steps 7 and 8 up to the instability (same operating pressure).
(10) Once all the subcooling values are tested for a flow rate level, change the flow rate and repeat steps 6-9. (11) Once all the flow rate values defined in step 5 are completely explored (every subcooling value), change
the desired pressure level and repeat steps 5-10.
2.3 Ranges of explored variables
DWOs result from multiple feedback effects between the flow rate, the vapour generation rate and the pressure drops in the boiling channel. To fully describe the stable region of the system and collect information on instability phenomena, it is necessary to determine instability thresholds in a wide range of system operating parameters.
A thorough test matrix was prepared to study the effects of system pressure, mass flow rate and inlet subcooling on system stability, by investigating:
- 3 levels of pressure: 80 bar, 40 bar and 20 bar;
- 3 levels of mass flux: 600 kg/m2s, 400 kg/m2s and 200 kg/m2s;
- several values of inlet subcooling between xin = -30% and xin = 0%.
The entire test matrix was executed with reference to a “basically open” configuration of the inlet valves V1 and V2 (corresponding valve loss coefficient kin = 45). The effect of inlet throttling was at last studied by progressively closing
the valves and repeating the stability map at p = 40 bar and G = 400 kg/m2s.
LP2.B2b - 15 - CERSE-POLIMI RL-1355/2011 2.4 DWO characterization
DWO appearance in a boiling channel can be detected by monitoring the flow rate, which starts to oscillate when power threshold is reached. The calibrated orifices installed at the inlet of both tubes permit to measure the flow rate through the recording of the pressure drops established across them. Thus, flow instability power threshold was experimentally defined as the power corresponding to permanent and regular flow oscillations, detected by visual observation of the pressure drop recording of the calibrated orifices (within V1 and V2 of Figure 3). The system was considered completely unstable when flow rate oscillation amplitude reached the 100% of its steady-state value. Obviously, flow rate in the two channels oscillates in counter-phase, being the total system mass flow rate imposed, as it is shown in Figure 5, where fully developed DWOs are depicted. The “square wave” shape of the curves is due to the reaching of instruments full scale.
-0.06 -0.04 -0.02 0 0.02 0.04 0.06 0.08 0.1 0.12 0.14 0.16 0 10 20 30 40 50 60 Γ [k g /s] t [s] Γ at Orifices [kg/s] Channel A Channel B
Figure 5 - Flow rate oscillations during fully developed instability. Data collected with: p = 83 bar; Tin = 199 °C; G = 597 kg/m2s; q = 99.3 kW.
Data collected during instability inception and fully developed instability allowed understanding the distinctive features of DWOs. System pressure oscillates with a frequency that is double if compared with the frequency of flow rate oscillations (Figure 6). Similar behaviour is exhibited by the total pressure drop, common to both the channels (i.e., the pressure difference between lower header and upper header of the facility). When the system is unstable, it is evident that there are two oscillations of total ∆p(t) per single oscillation of channel flow rate (“first” oscillation is due to Channel A, and “second” oscillation is due to Channel B, Figure 7).
Counter-phase oscillation of single-phase and two-phase pressure drops within each channel is known to be one of the triggering events leading to the appearance of DWOs. Figure 8 compares the pressure drops between pressure taps placed on different regions of Channel A (according to the distribution depicted in Table 2), in case of self-sustained instability. Pressure drops in the single-phase region (DP 2-3) oscillate in counter-phase with respect to two-phase pressure drops (DP 6-7 and DP 8-9). The phase shift is not abrupt, but it appears gradually along the channel. As a matter of fact, the pressure term DP 4-5 (low-quality two-phase region) shows only a limited phase shift with respect to single-phase zone (DP 2-3). Besides, as indicated by theory [6], single-phase pressure drop is oscillating in phase with the inlet velocity (compareFigure 8, DP 2-3, with Figure 5, blue curve). Progressive phase shift of two-phase pressure drop oscillation is the unleashing cause of DWO occurrence.
LP2.B2b - 16 - CERSE-POLIMI RL-1355/2011 Moreover, large amplitude fluctuations in channel wall temperatures, so named “thermal oscillations” [9], always occur (Figure 9), associated with fully developed density wave oscillations that trigger intermittent film boiling conditions.
8.26 8.28 8.3 8.32 8.34 8.36 8.38 0 10 20 30 40 50 60 p [ M P a] t [s]
Inlet Pressure [MPa]
Figure 6 - System pressure oscillations in the inlet header. Data collected with: p = 83 bar; Tin = 199 °C;
G = 597 kg/m2s; q = 99.3 kW. 100 110 120 130 140 150 160 170 180 190 200 0 10 20 30 40 50 60 ∆ p [ kP a] t [s] Total Channel ∆p [KPa]
Channel A Channel B
Figure 7 - Counter-phase pressure drop oscillations in the two parallel tubes. Data collected with: p = 83 bar; Tin =
199 °C; G = 597 kg/m2s; q = 99.3 kW. 0 5 10 15 20 25 30 35 40 45 0 10 20 30 40 50 60 ∆ p [ kP a] t [s] Channel A ∆p [KPa] DP 2-3 DP 4-5 DP 6-7 DP 8-9
Figure 8 - Pressure drop oscillations in different regions of channel A: single phase (DP 2-3), low quality two-phase (DP 4-5), two-two-phase (DP 6-7 and DP 8-9). Data collected with: p = 83 bar; Tin = 199 °C; G = 597 kg/m2s;
q = 99.3 kW. 298 300 302 304 306 308 310 312 314 316 0 10 20 30 40 50 60 T [° C] t [s] Wall Temperatures [°C] T in T out T up T down
Figure 9 - Fluctuations of tube wall temperatures during DWOs. Data collected with: p = 83 bar; Tin = 199 °C;
G = 597 kg/m2s; q = 99.3 kW.
2.5 Experimental results
Collected threshold data have been organized on the stability plane Npch-Nsub, introduced by Ishii and Zuber [13]. Figure
10, Figure 12 and Figure 14 show the stability maps obtained with the experimental data collected at the three pressure levels investigated in the present helical tubes facility. Error bars have been introduced following uncertainty analysis based on error linear propagation techniques [31]. The uncertainties of final dimensionless numbers within the maps have been computed combining the effects of the various measured quantities.
LP2.B2b - 17 - CERSE-POLIMI RL-1355/2011 Main effect is due to threshold power, following the uncertainties of measured electrical power, estimated thermal losses, as well as a term due to the discrete experimental procedure. Effect of pressure is also accounted for, by evaluating the maximum variation between the pressure recorded at instability inception with respect to the nominal pressure level. Pressure term is made apparent by the sensitivity of Eqs. (1), (2) on small pressure variations, which is considerably large at low pressure (such to overcome threshold power uncertainty) [1].
The whole concern was introduced to properly consider different threshold points, collected at slightly different pressures, on a Npch–Nsub stability map. In other words, it affects remarkably the results presented at low pressure (20
bar,Figure 12), where the dimensionless numbers are very sensitive to even small variations of the pressure.
The three different curves depicted in each graph represent the instability thresholds for the three values of mass flux (G = 600 kg/m2s, 400 kg/m2s and 200 kg/m2s), testing different inlet subcooling values. At 80 bar only two mass fluxes
have been considered, because plant operations resulted difficult at low flow rates. As expected, the stability boundaries according to the various mass flows are almost overlapped. Thus, it is the ratio q/Γ that determines the onset of instability once the characteristics of the channel and the inlet conditions are set. Figure 11, Figure 13 and Figure 15 confirm, for the three pressure levels respectively, that a mass flow rate variation induces a proportional variation of the thermal power needed to trigger the instability. An increase in thermal power or a decrease in channel mass flow rate can cause the onset of DWOs; both effects increase the exit quality, which turns out to be a key parameter for boiling channel instability. In brief, the effects on instability of thermal power and mass flow rate do not show differences in the helical geometry when compared to the straight tube case.
Instead, it is interesting to focus the attention on inlet subcooling. It is well known from literature that an increase in inlet subcooling is stabilizing at high subcoolings and destabilizing at low subcoolings [6]. This behaviour results in the classical “L shape” of the stability boundary, exhibited by all the dimensionless maps available in literature and referred to straight geometry(Figure 2) [13][16][21]. The present datasets with helical geometry confirm the stabilizing effect at high subcoolings. The experimental stability maps show indeed two different behaviours:
- “conventional” at medium-high subcoolings, with iso-quality stability boundary and slight stabilization in the range Nsub = 3 ÷ 6 (close to “L shape”);
- “non-conventional” at low subcoolings, with marked destabilizing effects as inlet temperature increases and approaches the saturation value.
Such different behaviour exhibited by the stability boundary at low subcoolings can be ascribed to the helical shape of the parallel channels and related centrifugal field effects on the thermal hydraulics of two-phase flow. Also the full-scale length of the test section and the small inclination angle of the helix, affecting two-phase flow pattern, may explain the provided experimental results.
It is just noticed that at the lowest system pressure and lowest mass flux (p = 20 bar and G = 200 kg/m2s, see Figure 12)
the stability boundary shape is different from previous discussion and agrees more with classical behaviour given by straight vertical tubes. As a matter of fact, the effect of inlet subcooling increase is stabilizing at high subcoolings, and destabilizing at low subcoolings. The centrifugal field, reasonably weak under these conditions, is such to make the peculiar effect of the helical geometry negligible.
LP2.B2b - 18 - CERSE-POLIMI RL-1355/2011 0 2 4 6 8 10 12 0 10 20 30 40 Nsu b Npch
Stability Map P = 40 bar
G = 600 G = 400 G = 200
x = 0.5
x = 0.6
Figure 10 - Stability map obtained at system pressure p = 40 bar and different mass fluxes (G = 600 kg/m2s, 400
kg/m2s, 200 kg/m2s). 0 20 40 60 80 100 120 -30% -25% -20% -15% -10% -5% 0% Q [ kW ] xin[%]
Limit Power P = 40 bar
G = 600 G = 400 G = 200
Figure 11 - Limit power for instability inception at p = 40 bar as function of inlet subcooling and for different
values of mass flux. 0 2 4 6 8 10 12 14 16 10 20 30 40 50 60 70 Nsu b Npch
Stability Map P = 20 bar
G = 600 G = 400 G = 200
x = 0.4 x = 0.5
Figure 12 - Stability map obtained at system pressure p = 20 bar and different mass fluxes (G = 600 kg/m2s, 400
kg/m2s, 200 kg/m2s). 0 10 20 30 40 50 60 70 80 90 100 -25% -20% -15% -10% -5% 0% Q [ kW ] xin[%]
Limit Power P = 20 bar
G = 600 G = 400 G = 200
Figure 13 - Limit power for instability inception at p = 20 bar as function of inlet subcooling and for different
values of mass flux. 0 1 2 3 4 5 6 7 8 9 0 5 10 15 20 25 30 Nsu b Npch
Stability Map P = 80 bar
G = 400
G = 600 x = 0.6 x = 0.7
Figure 14 - Stability map obtained at system pressure p = 80 bar and different mass fluxes (G = 600 kg/m2s, 400
kg/m2s). 40 50 60 70 80 90 100 110 -50% -40% -30% -20% -10% 0% Q [ kW ] xin[%]
Limit Power P = 80 bar
G = 600 G = 400
Figure 15 - Limit power for instability inception at p = 80 bar as function of inlet subcooling and for different
LP2.B2b - 19 - CERSE-POLIMI RL-1355/2011
2.5.1 Effect of system pressure
System pressure was always found to be stabilizing, although pressure effect is less effective if compared with other system parameters [6]. Figure 16, Figure 17 and Figure 18 show the limit power corresponding to the various pressure levels, fixed the mass flow rate in the system (G = 200, 400 and 600 kg/m2s respectively). The higher is the pressure,
the higher is the exit quality required for the onset of instability, hence the system is more stable. This concern is evident by considering the iso-quality lines reported in the stability maps (Figure 10, Figure 12 and Figure 14). Thermal power behaviour in the figures also confirms the subcooling destabilizing effect for small values of Nsub.
0 5 10 15 20 25 30 35 40 0 2 4 6 8 10 12 14 16 Q [ kW ] Nsub Limit Power G 200 kg/m2s p = 40 bar p = 20 bar
Figure 16 - Limit power for instability inception at
G = 200 kg/m2s as function of the subcooling number
and at different pressures.
20 30 40 50 60 70 80 90 0 2 4 6 8 10 12 14 16 Q [ kW ] Nsub Limit Power G 400 kg/m2s p = 80 bar p = 40 bar p = 20 bar
Figure 17 - Limit power for instability inception at
G = 400 kg/m2s as function of the subcooling number
and at different pressures.
40 50 60 70 80 90 100 110 0 2 4 6 8 10 12 14 16 18 Q [ kW ] Nsub Limit Power G 600 kg/m2s p = 80 bar p = 40 bar p = 20 bar
Figure 18 - Limit power for instability inception at
LP2.B2b - 20 - CERSE-POLIMI RL-1355/2011
2.5.2 Period of oscillations and transit time
DWOs are characterized by waves of heavier and lighter fluid which travel alternatively along the boiling channel3.
Two perturbations are required for each cycle. Accordingly, the period of oscillations should be of the order of twice the mixture transit time. As a matter of fact, literature results report a period of oscillation T almost equal to twice the mixture transit time τ at high inlet subcoolings, and a reduction of T/τ ratio by reducing the subcooling number [6]. In this respect, mixture transit time is considered calculated with classical homogeneous flow theory, by adding single-phase region transit time τ1φ and two-phase region transit time τ2φ, as in [6] and [16]:
⎟⎟ ⎠ ⎞ ⎜⎜ ⎝ ⎛ + + = + = ex l lv lv lv in in φ φ x v v q'''v h q''' ∆h ρ τ τ τ 1 2 ln 1 . (3)
With some algebra, Eq. (3) can be rearranged as:
⎥ ⎦ ⎤ ⎢ ⎣ ⎡ ⎟⎟ ⎠ ⎞ ⎜⎜ ⎝ ⎛ + + − = ex l lv lv in in lv x v v v x ρ q ALh τ 1 ln 1 . (4)
The experimental results collected at SIET labs show a completely different trend. The period of oscillations to transit time ratio is found to be very low at high inlet subcoolings, moreover it grows by reducing the subcooling number Nsub.
The period of oscillations (Figure 19, Figure 21 and Figure 23) is rather independent on inlet subcooling, whereas it increases as the mass flow is lower. Accordingly, T/τ ratio (Figure 20, Figure 22 and Figure 24), pretty constant following mass flux variations, results considerably lower than one (~0.5) at high inlet subcoolings (when the fluid transit time in the heated channel is higher due to the long single-phase region), whereas it increases up to a value of nearly two as the inlet temperature approaches the saturation.
0 5 10 15 20 25 -50% -40% -30% -20% -10% 0% T [ s] xin[%]
Period of Oscillations P = 80 bar G = 600
G = 400
Figure 19 - Period of oscillations at p = 80 bar as function of inlet subcooling and for different values of mass flux.
0 0.2 0.4 0.6 0.8 1 1.2 1.4 1.6 1.8 2 -50% -40% -30% -20% -10% 0% T/ τ xin[%]
Period/transit time ratio P = 80 bar G = 600
G = 400
Figure 20 - Period of oscillations to transit time ratio at
p = 80 bar as function of inlet subcooling and for
LP2.B2b - 21 - CERSE-POLIMI RL-1355/2011 0 5 10 15 20 25 -30% -25% -20% -15% -10% -5% 0% T [ s] xin[%]
Period of Oscillations P = 40 bar
G = 600 G = 400 G = 200
Figure 21 - Period of oscillations at p = 40 bar as function of inlet subcooling and for different values of mass flux.
0 0.5 1 1.5 2 2.5 -30% -25% -20% -15% -10% -5% 0% T/ τ xin[%]
Period/transit time ratio P = 40 bar G = 600
G = 400 G = 200
Figure 22 - Period of oscillations to transit time ratio at
p = 40 bar as function of inlet subcooling and for different
values of mass flux.
0 5 10 15 20 25 30 -25% -20% -15% -10% -5% 0% T [ s] xin[%]
Period of Oscillations P = 20 bar G = 600
G = 400 G = 200
Figure 23 - Period of oscillations at p = 20 bar as function of inlet subcooling and for different values of mass flux.
0 0.5 1 1.5 2 2.5 3 -25% -20% -15% -10% -5% 0% T/ τ xin[%]
Period/transit time ratio P = 20 bar G = 600
G = 400 G = 200
Figure 24 - Period of oscillations to transit time ratio at
p = 20 bar as function of inlet subcooling and for different
values of mass flux.
Up to the Authors knowledge, as well as from the helical geometry, the discussed behaviour seems to be induced also by the peculiar length of the test section and by the presence of an unheated riser above.
2.6 Effect of inlet throttling
It is well known that a concentrated pressure drop located at channel inlet is stabilizing, as a larger fraction of the system pressure drop behaves in-phase with inlet velocity variations [15]. In this work, the effect of inlet valve closure was investigated by repeating the stability map at p = 40 bar and G = 400 kg/m2s, following progressive closures of V1
and V2 valves. All the results presented in the previous Sections have referred to “basically open” valve configuration (1 turn to valve closure, kin = 45). In this paragraph, instead, the instability thresholds have been defined with respect to
2/6 turn to closure (kin ≈ 100) and 1/6 turn to closure (kin ≈ 270), respectively. Finally, a last position (roughly ascribable
as 1/12 turn to valve closure) was tested, standing for the inlet throttling required to stabilize the parallel channel system under study. As a matter of fact, dryout thermal crisis occurrence was recorded before the onset of flow unstable
LP2.B2b - 22 - CERSE-POLIMI RL-1355/2011 conditions, following the provided steps of thermal power. Hence, dryout occurrence, identified by a sharp rise of tube wall temperature, was considered as the evidence of system stabilization.
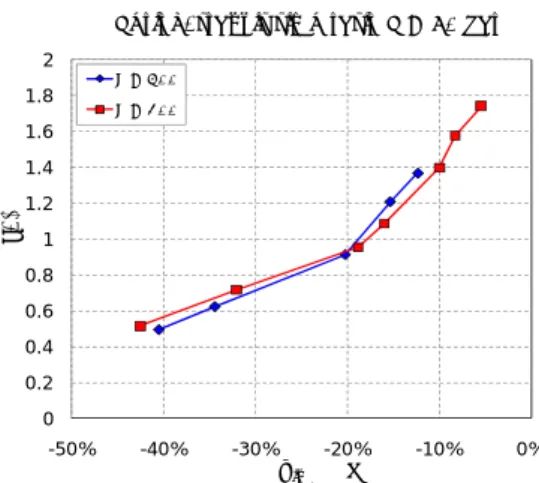
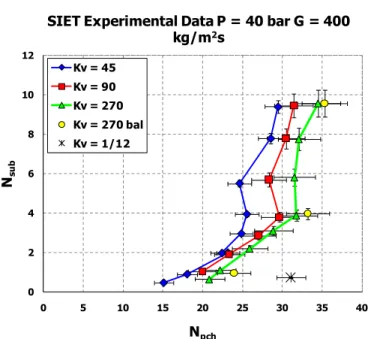
The obtained results are shown in Figure 25. The stabilizing effect of a concentrated pressure drop at the inlet of the channel is confirmed. Some explanations can be useful. When finding out the stability map at 1/6 turn to valve closure, asymmetric entrance resistance conditions were erroneously imposed by a not equal closure of the two valves (with Channel B less throttled than Channel A). It is shown that the stability characteristics of the less throttled (i.e., less stable) channel dominates the whole system. The instability occurs in the less throttled one, and then induces the other to oscillate. This reasoning is confirmed in literature by the experimental work of Guo Yun et al. [17]. To clarify this effect, some instability points were repeated with proper (i.e., balanced) closure between the two channel valves. A slight stabilization appears, as the system behaviour is effectively governed by the more throttled inlet valve configuration.
Nevertheless, the investigated effect of the inlet throttling on instability threshold turns out to be rather weak. By closing even remarkably the inlet valves, the system remained indeed prone to instability occurrence (with a global increase of the limit thermodynamic quality from ~0.5 to ~0.7, on the whole). Only a strong increase of the inlet throttling (with a concentrated pressure drop term that is such to equalize the distributed pressure drop term along the channel) permits to avoid the inception of the instability. Parallel channels stabilization given by the last position investigated (1/12 turn to valve closure) was not valid, indeed, at low subcooling; the respective threshold point is indicated on the stability map (Figure 25), with a limit quality equal to 0.8.
0 2 4 6 8 10 12 0 5 10 15 20 25 30 35 40 Nsu b Npch
SIET Experimental Data P = 40 bar G = 400
kg/m2s Kv = 45 Kv = 90 Kv = 270 Kv = 270 bal Kv = 1/12
Figure 25 - Effect of inlet throttling on instability threshold at system pressure p = 40 bar and mass flux G = 400 kg/m2s.
2.7 Ledinegg type instabilities
The final Section of the paper is dedicated to Ledinegg type instability. Ledinegg flow excursions were observed during test runs at the lowest pressure level (p = 20 bar), the highest mass flux (G = 600 kg/m2s), and higher inlet subcooling
values (xin < -15%). Ledinegg type instabilities occur when a heated channel operates in the negative slope region of the
LP2.B2b - 23 - CERSE-POLIMI RL-1355/2011 pressure drop given by parallel channels act as a flat pump external characteristics, forcing each channel into a wide flow excursion up to the reaching of new operating points on the internal characteristics.
Figure 26 shows the flow rate evolution in each channel in presence of a Ledinegg type instability. Flow excursion is evident, as Channel A flow rate increases. On the contrary, flow rate in Channel B reduces proportionally to preserve the imposed total mass flow rate. Constant total pressure drop condition is respected across the two tubes. Ledinegg instability occurrence showed to be critical since an anticipated DWO onset was recorded in the channel with lower flow rate (Channel B in this case), following small increases of supplied thermal power. Indeed, increase of thermal power permitted to leave the Ledinegg instability region, damping out the flow excursion.
0 0.02 0.04 0.06 0.08 0.1 0.12 0.14 0.16 0 50 100 150 200 250 300 Γ [k g /s ] t [s] Γ at Orifices [kg/s] Channel A Channel B
Figure 26 - Flow rate recorded in the two channels during a Ledinegg transient. Data collected with: p = 24 bar;
Tin = 134 °C; G = 601 kg/m2s. Transient to q = 50 kW (electrical power supplied per tube).
3 A
NALYTICALM
ODELLING3.1 Analytical lumped parameter model: fundamentals and development
The analytical model provided to theoretically study DWO instabilities is based on the work of Muñoz-Cobo et al. [19]. Proper modifications have been considered to fit the modelling approach with steam generator tubes with imposed thermal power (representative of typical experimental facility conditions).
The developed model is based on a lumped parameter approach (0D) for the two zones characterizing a single boiling channel, which are single-phase region and two-phase region, divided by the boiling boundary. Modelling approach is schematically illustrated in Figure 27.
Differential conservation equations of mass and energy are considered for each region, whereas momentum equation is integrated along the whole channel. Wall dynamics is accounted for in the two distinct regions, following lumped wall temperature dynamics by means of the respective heat transfer balances. The model can apply to single boiling channel and two parallel channels configuration, suited both for instability investigation according to the specification of the respective boundary conditions:
LP2.B2b - 24 - CERSE-POLIMI RL-1355/2011 - same ∆p(t) across the two channels (with constant total mass flow) for parallel channels [19].
Figure 27 - Schematic diagram of a heated channel with single-phase (0 < z < zBB) and two-phase (zBB < z < H) regions.
Externally impressed pressure drop is ∆ptot. (Adapted from [12]).
The main assumptions considered in the provided modelling are: (a) one-dimensional flow (straight tube geometry); (b) homogeneous two-phase flow model; (c) thermodynamic equilibrium between the two phases; (d) uniform heating along the channel (linear increase of quality with tube abscissa z); (e) system of constant pressure (pressure term is neglected within the energy equation); (f) constant fluid properties at given system inlet pressure; (g) subcooled boiling is neglected.
3.1.1 Mathematical modelling
Modelling equations are derived by the continuity of mass and energy for a single-phase fluid and a two-phase fluid, respectively.
Single-phase flow equations read:
0 = ∂ ∂ + ∂ ∂ z G t ρ , (5)
( )
( )
q''' z Gh t ρh = ∂ ∂ + ∂ ∂ . (6)Two-phase mixture is dealt with according to homogeneous flow model. By defining the homogeneous density ρH and
the reaction frequency Ω as follows [18]:
( )
lv l v l H v x v α ρ α ρ ρ + = + − = 1 1 , (7)LP2.B2b - 25 - CERSE-POLIMI RL-1355/2011 lv lv
AHh
q(t)v
(t)
=
Ω
, (8) one gets: 0 = ∂ ∂ + ∂ ∂ z G t H ρ , (9) ) (t z j = Ω ∂ ∂ . (10)Momentum equation is accounted for by integrating the pressure balance along the channel:
frict H grav acc p p p t p dz t t z G ∆ ∆ ∆ ) ( ∆ ) , ( 0 − − − = ∂ ∂
∫
. (11)As concerns the wall dynamics modelling, a lumped two-region approach is adopted. Heated wall dynamics is evaluated separately for single-phase and two-phase regions, following the dynamics of the respective wall temperatures according to a heat transfer balance:
( )
1φ(
1φ 1φ)
φ 1 φ 1 φ 1 φ 1 fl h h h h q hS T T dt dT c M dt dq = = − − , (12)( )
2φ(
2φ 2φ)
φ 2 φ 2 φ 2 φ 2 fl h h h h dt q hS T T dT c M dt dq = = − − . (13) 3.1.2 Model developmentModelling equations are dealt with according to the usual principles of lumped parameter models [1], i.e. via integration of the governing PDEs (Partial Differential Equations) into ODEs (Ordinary Differential Equations) by applying the Leibniz rule. The hydraulic and thermal behaviour of a single heated channel is fully described by a set of 5 non-linear differential equations, in the form of:
) (y f dt dy i i = , i = 1, 2, ..., 5, (14)
where the state variables are:
φ φ 2 5 1 4 3 2 1 h h in ex BB T y T y G y x y z y = = = = = . (15)
LP2.B2b - 26 - CERSE-POLIMI RL-1355/2011 In case of single boiling channel modelling, boundary condition of constant pressure drop between channel inlet and outlet must be simply introduced by specifying the imposed ∆p of interest within the momentum balance equation (derived following Eq. (12), see [1]).
In case of two parallel channels modelling, mass and energy conservation equations are solved for each of the two channels, while parallel channel boundary condition is dealt imposing within the momentum conservation equation: (a) the same pressure drop dependence with time (∆p(t)) across the two channels; (b) a constant total flow rate.
First, steady-state conditions of the analysed system are calculated by solving the whole set of equations with time derivative terms set to zero. Steady-state solutions are then used as initial conditions for the integrations of the equations, obtaining the time evolution of each computed state variable. Input variable perturbations (considered thermal power and channel inlet and exit loss coefficients according to the model purposes) can be introduced both in terms of step variations and ramp variations.
The described dynamic model has been solved through the use of the MATLAB software SIMULINK® [32].
3.1.3 Linear stability analysis
Modelling equations can be linearized to investigate the neutral stability boundary of the nodal model. The linearization about an unperturbed steady-state initial condition is carried out by assuming for each state variable:
t e y y t y()= 0+δ ⋅ λ . (16)
To simplify the calculations, modelling equations are linearized with respect to the three state variables representing the hydraulic behaviour of a boiling channel, i.e. the boiling boundary zBB(t), the exit quality xex(t), and the inlet mass flux Gin(t). That is, linear stability analysis is presented by neglecting the dynamics of the heated wall (q(t) = const).
The initial ODEs, obtained after integration of the original governing PDEs, are [1]:
1 b dt dzBB = , (17) dt dz b b b dt dxex BB 3 2 4= + = , (18) 5 b dt dGin = . (19)
By applying Eq. (16) to the selected three state variables, as:
t BB BB BB t z z e z ()= 0 +δ ⋅ λ , (20) t ex ex ex t x x e x ()= 0 +δ ⋅ λ , (21) t in in int G G e G ()= 0 +δ ⋅ λ , (22)
LP2.B2b - 27 - CERSE-POLIMI RL-1355/2011 0 13 12 11+ x E + G E = E zBB δ ex δ in δ , (23) 0 23 22 21+ x E + G E = E zBB δ ex δ in δ , (24) 0 33 32 31+ x E + G E = E zBB δ ex δ in δ . (25)
The calculation of the system eigenvalues is based on solving:
0 33 32 31 23 22 21 13 12 11 = E E E E E E E E E , (26)
which yields a cubic characteristic equation, where λ are the eigenvalues of the system:
0 2
3+aλ +bλ+c=
λ . (27)
3.2 Analytical lumped parameter model: results and discussion
Single boiling channel configuration is referenced for the discussion of the results obtained by the developed model on DWOs. For the sake of simplicity, and availability of similar works in the open literature for validation purposes [19][21][25], typical dimensions and operating conditions of classical BWR core subchannels are considered.
Table 4 lists the geometrical and operational values taken into account in the following analyses. Table 4 - Dimensions and operating conditions selected for the analyses.
Heated Channel Diameter [m] 0.0124 Length [m] 3.658 Operating Parameters Pressure [bar] 70 Inlet temperature [°C] 151.3 – 282.3 kin 23 kout 5
3.2.1 System transient response
To excite the unstable modes of density wave oscillations, input thermal power is increased starting from stable stationary conditions, step-by-step, up to the instability occurrence. Instability threshold crossing is characterized by passing through damping out oscillations (Figure 28), limit cycle oscillations (Figure 29), and divergent oscillations (Figure 30). This process is rather universal across the boundary. From stable state to divergent oscillation state, a narrow transition zone of some kW has been found in this study.


![Figure 32 - Mass flux delayed variations along the channel. N sub = 8, q = 133 kW. 247 248 249 250 251 252 253 2541234567x 104 Time [s]Pressure drops [Pa]Single-phaseTwo-phaseTotal](https://thumb-eu.123doks.com/thumbv2/123dokorg/5623292.68636/30.892.458.783.523.773/figure-delayed-variations-channel-pressure-single-phasetwo-phasetotal.webp)
