GBS-derived SNP catalogue
unveiled wide genetic variability
and geographical relationships of
Italian olive cultivars
Nunzio D’Agostino
1, Francesca Taranto
2, Salvatore Camposeo
3, Giacomo Mangini
4,
Valentina Fanelli
2, Susanna Gadaleta
2, Monica Marilena Miazzi
4, Stefano Pavan
4,
Valentina di Rienzo
2, Wilma Sabetta
2, Luca Lombardo
5, Samanta Zelasco
6, Enzo Perri
6,
Concetta Lotti
7, Elena Ciani
8& Cinzia Montemurro
2,4Information on the distribution of genetic variation is essential to preserve olive germplasm from erosion and to recover alleles lost through selective breeding. In addition, knowledge on population structure and genotype–phenotype associations is crucial to support modern olive breeding programs that must respond to new environmental conditions imposed by climate change and novel biotic/abiotic stressors. To further our understanding of genetic variation in the olive, we performed genotype-by-sequencing on a panel of 94 Italian olive cultivars. A reference-based and a reference-independent SNP calling pipeline generated 22,088 and 8,088 high-quality SNPs, respectively. Both datasets were used to model population structure via parametric and non parametric clustering. Although the two pipelines yielded a 3-fold difference in the number of SNPs, both described wide genetic variability among our study panel and allowed individuals to be grouped based on fruit weight and the geographical area of cultivation. Multidimensional scaling analysis on identity-by-state allele-sharing values as well as inference of population mixtures from genome-wide allele frequency data corroborated the clustering pattern we observed. These findings allowed us to formulate hypotheses about geographical relationships of Italian olive cultivars and to confirm known and uncover novel cases of synonymy.
Cultivated olive tree (Olea europaea L. subsp. europaea var. europaea) is believed to originate from the wild oleaster (Olea europaea L. subsp. europaea var. sylvestris) in the north Levant, a region corresponding to the mod-ern Syrian-Turkish border1–4. It is still under debate whether independent domestication events have occurred in
the Mediterranean basin or whether it represents a secondary olive diversification centre5–7.
Olive was introduced in Southern Italy, first by Phoenicians and, later, by Greek colonization of the region8,9.
Then, it gained a considerable economic importance with Romans, who disseminated olive cultivation and oil processing facilities all around the Mediterranean basin10,11.
Olive cultivars grown today were selected and carried over major migration routes by clonal propagation and grafting. Such migration events were particularly complex and ultimately led to confusion over cultivar nomencla-ture and identity, resulting in a large number of homonymies, synonymies and errors in the naming of cultivars12.
Information on genome-wide patterns of genetic variation and knowledge on population structure of olive germplasm is essential to define priorities for management and conservation of gene pools, to develop new sus-tainable cropping systems13,14 and to study the impact of domestication on olive tree genetic variability.
1CREA Research Centre for Vegetable and Ornamental Crops, Pontecagnano Faiano, Italy. 2SINAGRI S.r.l. - Spin Off of the University of Bari “Aldo Moro”, Bari, Italy. 3Department of Agricultural and Environmental sciences, University of Bari “Aldo Moro”, Bari, Italy. 4Department of Soil, Plant and Food Sciences, University of Bari “Aldo Moro”, Bari, Italy. 5Center for Agriculture, Food ad Environment (C3A), University of Trento, San Michele all’Adige, Italy. 6CREA Research Centre for Olive, Citrus and Tree Fruit, Rende, Italy. 7Department of the Sciences of Agriculture, Food and Environment, University of Foggia, Foggia, Italy. 8Department of Biosciences, Biotechnologies and Biopharmaceutics, University of Bari “Aldo Moro”, Bari, Italy. Nunzio D’Agostino and Francesca Taranto contributed equally. Correspondence and requests for materials should be addressed to N.D. (email: nunzio.dagostino@crea. gov.it) or F.T. (email: [email protected])
Received: 25 October 2017 Accepted: 12 October 2018 Published: xx xx xxxx
Investigations into the genetic consequences of domestication and breeding have been already successfully performed on several long-lived perennials. By exploiting a few dozen microsatellite markers, different research groups have assessed the level of genetic variation as consequence of domestication and crop improvement as well as the spatio-temporal origin and the spread of almond15, apricot16, apple17 and olive18,19 trees. Using
differ-ent methods, Myles, et al.20 applied the Vitis9kSNP array to characterize a Vitis vinifera germplasm collection on
a genome-wide scale and to infer the domestication and breeding history by evaluating patterns of population structure.
In addition to knowledge on genetic diversity, which is shaped by natural and human-derived processes, genotype-phenotype association is a key prerequisite to modern breeding programs. New challenges for olive breeding are related to (i) the increasing ecological impact of climate change and associated abiotic stresses and (ii) new or resurgent pests and diseases. Among the latter, the emergence of the bacterium Xylella fastidiosa has caused severe decline of olive trees in Apulia (Southern Italy)21–23.
Morphological characterisation, traditionally used for the assessment of the genetic diversity across olive ger-mplasm collections, has been recently paralleled by the use of molecular markers24,25. Different types of DNA
markers, namely simple sequence repeats (SSRs)26–30, amplified fragment length polymorphism (AFLP)31–35 and
single nucleotide polymorphisms (SNPs)36–38, have been till now used to dissect olive genetic variability.
Compared to other types of DNA markers, SNPs have some advantageous features. They are common and found throughout the genome, stable (i.e. are less mutable), and readily assayed using high-throughput geno-typing protocols and automated data analysis. Furthermore, adjacent SNPs in haplotype blocks that tend to be inherited together can be exploited in genetic dissection of complex traits39.
Recent progress in next-generation sequencing (NGS) has made SNP discovery cost-effective. Although SNP markers can be observed through various experimental protocols, at present, genotype-by-sequencing (GBS) is the most popular approach for SNP identification in plants40–42. In the last few years, GBS has been largely used in
species with a reference genome to discover new SNP markers and to develop mapping populations43–45, to assess
genome-wide diversity and linkage disequilibrium46–48, and to perform association mapping studies49–51.
Although GBS has been mostly applied to species with complete, near-complete or partial reference genomes, different SNP calling pipelines have been developed to apply GBS to species with limited genomic informa-tion52–54. Indeed, interesting studies have been successfully carried out in species lacking a reference genome such
as switchgrass, oat, blackcurrant, hop, alfalfa and sugarcane53,55–59.
To our knowledge, two studies based on GBS and on the reference-independent SNP calling pipeline Stacks52
have been performed in olive. These studies aimed at the construction of high-density genetic linkage maps as a resource for locating QTL (Quantitative trait loci) associated with agronomically important traits and for genome scaffolding60,61.
Herein, we describe the first genome-wide diversity study on a collection of 94 cultivars representative of Italian olive germplasm. Italy has the second-highest level of olive oil production in the World10,62 and represents
a diversity centre with more than 500 different cultivars grown across its territory12,63. This richness in biodiversity
was well documented by Hatzopoulos, et al.64 and by Owen, et al.65, who described the wide genetic variability
for a large number of bio-agronomic traits in Italian olive germplasm. We adopted two different SNP calling procedures: the first one is based on the TASSEL-GBS pipeline and on the partial O. europaea genome sequence released by Cruz, et al.66; the second relies on the reference-independent TASSEL Universal Network Enabled
Analysis Kit (UNEAK) pipeline53. The extensive catalogue of SNPs we developed was used to (i) measure genetic
variation and establish the relationships among all individuals across the population as independently assessed by a parametric (STRUCTURE67) and a non-parametric (AWclust68) population structure analysis software; (ii)
resolve cases of synonymy in olive germplasm and (iii) formulate hypotheses about the geographical relationships and spread of olive cultivars on Italian territory.
Results
The GBS analysis performed by Illumina sequencing generated ~247 M reads, on average 2.6 M reads per sample. GBS sequence tags were merged into a single master tag file including 1.4 M reads. Two SNP calling pipelines were run, namely TASSEL-UNEAK and TASSEL-GBS.
Diversity analysis via the TASSEL-UNEAK SNP calling pipeline.
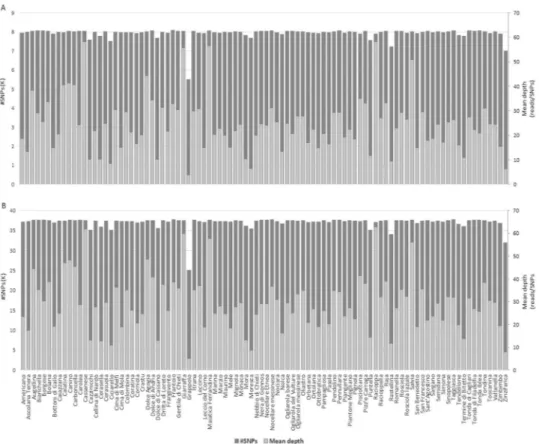
The reference-free TASSEL- UNEAK pipeline called 81,820 unfiltered SNPs. By using the filtering criteria described in Methods, the number of SNP loci was reduced to 8,088. In Fig. 1A, the mean depth of coverage and the number of SNPs per cultivar are reported. Transitions (Ti) were more abundant (63.1%) than transversions (Tv) (36.9%), with a Ti/Tv ratio of 1.7. The most and the least frequent substitutions were C→T (32.65%) and C→G (5.2%), respectively (see Supplementary Fig. S1). SNP calling revealed that the majority of SNPs were homozygous either for the reference (61%) or the alternate allele (7.5%); on average, 29.7% SNP loci were heterozygous, whereas only 1.8% of missing data were observed (see Supplementary Fig. S2A).STRUCTURE and Structure Harvester analyses indicated that the germplasm collection genotyped in this study could be divided into three clusters (K = 3; see Supplementary Fig. S3A; Fig. 2). Cluster C1u, cluster C2u and
cluster C3u include 15, 27 and 29 cultivars respectively; the remaining 23 cultivars are classified as admixed. A
clear separation between cluster C1u and cluster C3u can be made on the basis of drupe weight (see Supplementary
Table S1). Indeed, cluster C1u includes cultivars with drupe size and weight clearly smaller than those in cluster
C3u. Pair-wise fixation index (F
ST) estimate was 0.134 between cluster C1u and C3u; 0.093 between cluster C1u and
C2u and 0.104 between cluster C2u and C3u. The expected heterozygosity was 0.62, 0.84 and 0.72 within cluster
Population structure was also investigated using AWclust. Based on Gap Statistics, the most likely number of sub-populations was four (K = 4) (see Supplementary Fig. S4A). As general rule, the hierarchical clustering by AWclust reflects drupe weight variation across cultivars and it is comparable to the Bayesian clustering by STRUCTURE (Fig. 2).
Figure 1. Overlapping bar charts showing SNP count and mean depth per cultivar. (A) TASSEL-UNEAK.
(B) TASSEL-GBS.
Figure 2. Genetic diversity assessment of 94 Olea europaeae cultivars using 8,088 high-quality SNP markers
called by TASSEL-UNEAK (u). (A) Bar-plot describing population structure estimated by STRUCTURE.
Population was divided into three clusters plus a cluster of admixed cultivars (C4u). Each bar is separated into
K coloured segments each representing the ancestry qi proportion in each individual. (B) AWclust dendrogram
The dendrogram by AWclust displays two primary nodes and four clusters (Fig. 2). Cluster Iu groups 22 olive
varieties with an average drupe weight = 2.43 g ± 0.81. This cluster can be split into two sub-clusters, each includ-ing varieties from a specific geographical area of cultivation: Iua (cultivars from Central Italy) and Iub (cultivars
from Apulia).
Cluster IIu includes 28 cultivars and it is separated into two clades: IIua and IIub. Cultivars in clade IIua have
drupes of medium weight (average of 2.84 g ± 0.86) and fall into distinct branches corresponding to different Italian regions. Clade IIub groups cultivars with small drupes (=1.65 g ± 0.28) typically cultivated in Calabria and
in “Salento”, an area located in the South of Apulia region.
Cluster IIIu comprises 20 cultivars with the highest drupe weight (average = 5.28 g ± 1.62), mainly cultivated
in the two insular Italian regions. Finally, cluster IVu includes two clades for a total of 24 cultivars with drupes of
medium weight (average of 3.44 g ± 0.99): IVua groups four varieties cultivated in Apulia (Mora, Cerasella, Mele,
Nolca), while IVub includes cultivars mainly cultivated in Sicily and Calabria.
The one-way analysis of variance (ANOVA), that was used to determine whether there are any statistically significant differences between the means of drupe weight of cultivars in AWclust and STRUCTURE groups, confirms significant differences among the means (see Supplementary Table S2).
Diversity analysis via the TASSEL-GBS SNP calling pipeline.
The master tags were aligned to the olive reference genome66. Approximately 54% of the reads mapped uniquely to the reference, while 15.9% alignedto multiple positions and 30.6% of GBS sequence tags failed to align. In total, the reference-based TASSEL-GBS pipeline yielded 225,919 unfiltered SNPs. Of these, 37,792 were retained for downstream analyses after applying the filtering criteria described in the methods section. Figure 1B reports the mean depth of coverage and the number of SNPs per cultivar. Taking advantage of the genomic coordinates of olive gene models, 10,087 (26.7%) and 27,705 (73.3%) SNPs were located in genic and intergenic regions, respectively. More precisely, 2,690 SNPs (26.75%) fell within annotated exons, affecting a total of 1,302 genes.
The majority of the identified SNPs (64.6%) were transitions (Ti), with a Ti/Tv ratio of 1.82. The most and the least frequent substitutions were C→T (32.7%) and C→G (5.2%), respectively (see Supplementary Fig. S1).
We also applied LD pruning to the 37,792 high-quality SNPs in order to resolve population genetic structure. This resulted in 22,088 SNPs, of which, the vast majority was homozygous for the reference (74.8%), whereas a few loci were scored for the alternate allele (5.9%); ~16.8% of SNPs were heterozygous and only 2.2% were the missing data (see Supplementary Fig.S2B).
Ten SNP loci were randomly selected in three different cultivars and were validated by PCR amplifications and Sanger sequencing. All the polymorphisms identified in silico were confirmed (see Supplementary Table S3).
The dataset of 22,088 SNPs, called by using cv. Farga as reference genome66, was used to categorize cultivars
into clusters based on their genetic structure.
Structure Harvester indicated K = 6 as the optimal number of sub-populations for the germplasm collection, immediately followed by K = 4 (see Supplementary Fig. S3B Fig. 3). Considering that, at both K = 6 and K = 4, most of the cultivars fell in the admixed group at qi ≥ 0.60 (68 and 64 varieties, respectively), we decided to
divide the population under investigation into four sub-populations since this best fit with AWclust clustering. At qi ≥ 0.60, Giarraffa was the only accession included in the cluster C4r. Clusters C1r, C2r and C3r include 15, 12 and
2 varieties, respectively. Pair-wise fixation index (FST) estimated values were: 0.130 between cluster C2r and C1r,
0.184 between cluster C1r and C3r and 0.100 between cluster C2r and C3r.
The optimal number of sub-populations detected by AWclust was K = 5 (see Supplementary Fig. S4B). The grouping and distribution of olive cultivars into five clusters overlapped to a larger extent with those obtained by TASSEL-UNEAK, as previously described. Cultivars were clustered into two main clades including 76 and 18 varieties, respectively (Fig. 3). The clade with the largest number of individuals is split into four clusters, all including cultivars with average drupe weight ≤3.50 g. Clusters Ir and IIr collects 15 and 11 cultivars with a wide
range of drupe weight (average of 3.07 g ± 1.14 and of 2.14 ± 0.33) cultivated in Apulia and Central Italy, respec-tively. Clusters IIIr (2.19 ± 0.81) and IVr (3.27 ± 0.90), comprising 24 and 26 cultivars, correspond to clusters IIu
and IVu, respectively. Cluster Vr is clearly separated from the rest (Fig. 3). This cluster groups 18 cultivars with
the highest drupe weight (an average of 5.43 g ± 1.45) mainly cultivated in Sicily and Sardinia and corresponds to cluster IIIu previously described (Fig. 2).
The one-way ANOVA resulted in statistically significant differences between the means of drupe weight of cultivars in AWclust and STRUCTURE groups (see Supplementary Table S2).
Degree of allele sharing by identity-by-state and inference of population mixtures.
Relationships among the 94 Olea europaea cultivars were also explored by estimating identity-by-state (IBS) allele-sharing val-ues for all pair-wise comparisons using 22,088 unlinked SNPs. The frequency distribution of IBS estimates in Fig. 4 shows that most of the cultivars falls in the bin from 0.74 to 0.77 and that only 19 pairs of cultivars have allele-sharing values >0.95 (see Supplementary Table S4).A multidimensional scaling (MDS) plot of genome-wide IBS pair-wise distances (see Supplementary Fig. S5) shows a clear separation of the cultivar into 3 groups, while members of two other groups are scattered in the multidimensional space. The MDS proximity matrix confirms to some extent the clustering pattern observed with STRUCTURE and AWclust, respectively.
The tree-based approach implemented in TREEMIX69 was chosen in order to infer patterns of population
mixtures from genome-wide allele frequency data and to test the presence of gene flow (i.e. the transfer of genetic variation from one sub-population to another). TREEMIX was run on the dataset described above, with olive cultivars grouped into 4 arbitrary sub-populations (i.e. the clusters (C1u, C2u, C3u, C4u) identified following
Analysis of the TREEMIX log-likelihood values for 0 to 3 migrations revealed that the most predictive model (i.e. that had the highest log-likelihood) assumed the presence of 2 migration events (see Supplementary Table S5). A strong signal of gene flow and/or shared ancestry was inferred between C1u and C4u (0.49) and C3u
and C4u (0.28).
This indicates an exchange of genetic material between sub-populations C1u and C4u as well as C3u and C4u.
What was observed was expected since C4 includes only admixed genotypes. In contrast, we observed negligible gene-flow between C1u, C2u, C3u.
Linkage disequilibrium.
Linkage disequilibrium was calculated for all possible combination of pairs (r2) of22,088 SNPs detected by TASSEL-GBS. Taking into account that these SNPs are located on more than 5,000 scaf-folds that differ in size, LD decay was estimated considering only those SNP markers identified in the 30 longest scaffolds (see Supplementary Table S5). LD estimation suggested a very rapid decay, with average r2 dropping to
0.05 within 0.025 kb (Fig. 5).
Discussion
A key requirement for progress in any modern olive tree breeding program is to capture the widest possible genetic variability across germplasm collections as well as to investigate genotype–phenotype associations for the basic understanding of adaptive traits.
To this end, SNP markers are a valuable resource to enhance our knowledge on the genetic structure of O. europaea populations and to carefully dissect genetic variability within germplasm collections. The latter is a necessary step for the conservation and future utilization of olive gene pools and for the recovery of alleles left
Figure 3. Genetic diversity assessment of 94 Olea europaeae cultivars using 22,088 high-quality SNP
markers called by TASSEL-GBS (r). (A) Bar-plot describing population structure estimated by STRUCTURE.
Population was divided into four clusters plus a cluster of admixed cultivars (C5r). Each bar is separated into K
coloured segments each representing the ancestry qi proportion in each individual. Black arrows indicate bars
corresponding to cultivars included in clusters C2 and C3. (B) AWclust dendrogram plot showing five main sub-populations. D2 indicates allele-sharing distance.
Figure 4. Distribution of identity-by-state (IBS) allele sharing values amongst 94 olive tree cultivars determined
behind by selective breeding. Such reservoir of alleles provides a powerful tool for breeders to undertake efficient breeding programs for the development of novel varieties best suited to new cropping systems and biotic and abiotic stresses70. To the best of our knowledge, no studies have been performed yet on Italian olive germplasm
based on high-throughput SNP discovery.
Within this motivating context, we performed a genome-wide diversity study on a panel of 94 olive cultivars representative of Italian germplasm via genotype-by-sequencing. We believe that the use of different analytical approaches to detect SNP variation and estimate population structure and genetic relationships makes our work relevant and valuable from a methodological point of view.
By using a reference-based and a reference-independent SNP calling pipeline we developed an extensive cata-logue of SNPs used to model population structure via parametric and non parametric-based clustering and inves-tigate relationships among Italian olive cultivars. Furthermore, our results unveil cases of possible synonymies (see Supplementary Tables S4,S7) and support new hypotheses on the geographical relationships among olive varieties cultivated in Italy.
It is well known that the availability of a reference genome can facilitate GBS data analysis, although sev-eral reference-independent SNP calling pipelines have been successfully applied for genetic diversity studies. We used two different SNP calling pipelines, namely, TASSEL-UNEAK (reference-independent) and TASSEL-GBS (reference-based). Even if the current olive tree genome assembly is far from being chromosome-scaled (it is com-posed of more than 5,000 scaffolds covering 1.31 Gb out of an estimated genome size of 1.38 Gb)66 and despite the
lack of a “gold standard” structural and functional annotation, we still used this reference genome for the de novo discovery of SNP markers via GBS. As expected, TASSEL-GBS outperformed TASSEL-UNEAK with respect to the number of high quality SNPs (22,088 vs. 8,088). The 3-fold difference in the number of SNPs could be influ-enced by the more stringent parameters used in absence of a reference genome53. Conversely, the mean depth
of coverage, and the frequency of reference and effect (or alternative) SNP alleles per cultivar were comparable between the pipelines (Figs 1 and S1). This result further endorses that GBS is a valid and robust tool for SNP discovery even when a reference genome is lacking and that reference-independent SNP calling pipelines can be definitely valuable in underutilized, neglected, or orphan crops.
As mentioned before, a high number of master tags were generated, however only 53.6% of them aligned to the reference genome following the GBS tag-to-reference genome alignment step in TASSEL-GBS. This is not surprising. Indeed, missed alignments (false negative) can be ascribed to (i) distance between DNA sequences that might have prevented read-to-genome-alignments especially when very stringent alignment parameters were used to minimize the number of multiple alignments; (ii) the incomplete nature of the reference genome; (iii) regions with lower quality sequences; (iv) presence of reads from organelle genomes.
In this study we applied two complementary clustering methods (a parametric Bayesian clustering, that assume Hardy-Weinberg equilibrium and linkage equilibrium among loci in individuals of the sample population,
Figure 5. Scatter plot showing linkage disequilibrium decay (r2) calculated using a subset of the 22,088 SNPs
and a non-parametric distance-based hierarchical clustering, that it is based on a matrix of pair-wise allele shar-ing distances between all of the individuals in the dataset) to assess genetic diversity and establish relationships among individuals in the population under investigation. As previously discussed elsewhere, the two methods were found to corroborate each other remarkably well48.
The comparison between the two AWclust-derived dendrograms (Figs 2B,3B) shows that SNPs called both by TASSEL-GBS and TASSEL-UNEAK usually assign cultivars to similar clusters with three minor differences.
The first one affects olive cultivars with the highest drupe weight. They were assigned to distinct clusters with low overlap among their elements. However, when we examine the dendrogram developed on the basis of the SNPs identified by TASSEL-GBS, a significant clustering adjustment is observed. All olive cultivars with the highest drupe weight (cluster Vr) originate from a single ancestor node, which clearly separate them from the
remaining cultivars with medium and low drupe weight. This finding suggests that the most important parame-ters which influenced clustering analysis are size and weight of the drupe. This assertion is consistent with results from previous studies, which indicates those as high heritability traits8,71,72.
This hypothesis is also supported by the second difference we observed in the clustering. This concerns the clusters to which Cerasuola and Grappolo, characterised by having a medium drupe weight, belong. Based on SNPs called by TASSEL-UNEAK, they unexpectedly grouped in cluster IIIua with most cultivars characterised by
highest drupe weight. Contrariwise, the clustering that relies on SNPs called by TASSEL-GBS assigns these two cultivars in a cluster (IVrb) including twenty-two varieties with comparable drupe weight (4–6 g.).
Finally, the third difference we found affects the sub-set of natural sweet Apulian cultivars (Mora, Cerasella, Mele and Nolca), whose fruits are natural debittering on the tree during ripening73,74. In the dendrogram in
Fig. 2, this sub-set is part of the cluster (IVu) that includes cultivars with medium drupe weight. Interestingly,
the same sub-set is located into the cluster Ir (Fig. 3), where all Apulian “sweet” olive cultivars are placed. This
example clearly shows that the AWclust-derived dendrogram generated by TASSEL-GBS SNPs does not only group cultivars based on drupe morphological features, but also defines clusters based on the geographical area of cultivation. Indeed, the hierarchical clustering based on SNPs called by TASSEL-GBS resulted more robust and informative compared to the one based on TASSEL-UNEAK.
At first glance, STRUCTURE clustering may look less self-explaining than that made by AWclust. Going further in detail, population structure inferred by TASSEL-UNEAK SNP markers seems to be more profitable compared to that assessed by TASSEL-GBS, which includes a larger number of cultivars with a mosaic of allele frequencies (i.e. admixed ancestry).
The fact that SNPs called by TASSEL-GBS and by TASSEL-UNEAK return several admixed genotypes reveals that Italian olive germplasm has accumulated high level of variability over the centuries. This is supported by the fact that Italy is located in the middle of the Mediterranean basin that is considered a hybrid area between the Eastern and Western zones3,75,76 where diversification of cultivated olive tree mainly took place. Furthermore,
we cannot ignore that the very high genetic variability in olive tree is especially due to its mating system. Olive tree is an allogamous wind-pollinated species to which self-incompatible cultivars belong77. This results in an
increase of spontaneous crosses that give rise to olive genotypes with a spectrum of allele frequencies derived from ancestors78. Several studies have documented genetic admixture on a local or large scale in olive tree given
the out-crossing nature of O. europaea18. Indeed, gene flow between wild and domesticate forms has been
hypoth-esized to have shaped olive genetic diversity across the Mediterranean basin9,18,28.
Many studies based on a small number of SSR and AFLP markers have been carried out to identify synonyms and/or homonyms among Italian olive cultivars, although they do not unequivocally clarify the existing genetic relationships9,12,79.
Pair-wise clustering based on IBS as well as allele frequency estimates suggests the occurrence of several cases of synonymy. Many of them have been already described in previous studies based on morphological traits and molecular markers12,32, while others were uncovered here for the first time (see Supplementary Tables S4,S7).
By fixing IBS values ≥0.95, we found 19 pairs of cultivars that look similar to each other (see Supplementary Table S4). Based on coefficient membership (qi; i.e. probability of an individual belonging fully to one ancestral
population) it is possible to distinguish several cases of synonymy among the individuals that draws most of their genetic ancestry from different populations. For all these cases, varieties are cultivated in confined geographical areas and it is possible that original names were altered in accordance with local dialects. Interestingly, by fixing qi ≥ 0.97 we observed the following two cases of synonymies: (i) Cima di Mola, Bottoni di Gallo and Mignola
(qi = 0.98); (ii) Ogliarola barese, Taggiasca and Frantoio (qi = 1). In both cases, synonymies are certainly not
attributable to varieties cultivated in narrow geographical areas. It is well known that genetic improvement of olive is also characterised by vegetative propagation of the most valuable individuals80.
With this in mind, we can speculate that some individuals were vegetative propagated by cuttings or clonal propagation and were disseminated by human migrations across the Italian peninsula disregarding the cultivar name. It must however be stressed that cultivars genetically indistinguishable from others could be phenotypically different. This is not surprising since variations in light, altitude, soil composition and water availability could completely change the physiological and morphological aspect of the olive plant81–83.
The results we obtained by using SNPs called by TASSEL-GBS and TASSEL-UNEAK and applying two com-plementary methods for the estimation of genetic diversity indicated a clear and consistent subdivision of the cultivars under investigation into three main groups.
This finding, together with data on patterns of population splits and mixtures, allowed us to formulate hypoth-eses about the geographical relationships, dissemination and diversification of olive cultivars in Italy. Given the above, we distinguished a sub-population that includes cultivars from Apulia (Ir or Iua) and Central Italy (IIr or
Iub) that may have evolved from a common ancestor population.
FST values revealed moderate isolation between cultivars in C1u cluster and all the others. In addition, a strong
genome-wide IBS pair-wise distances shows that members of the cluster Ir and IVr (i.e admixed genotypes) are scat-tered in the multidimensional space. On the basis of these further evidences we can state that C1u represents a
rela-tively closed gene pool that exchanged genetic material through inter-breeding with other varieties cultivated in Italy. Most likely, the C1u population originated from local oleasters intermixed with feral forms and has spread to
different Italian regions over time.This hypothesis is supported by Baldoni, et al.9, who investigated the genetic
relationships among wild types and cultivars collected from three Italian regions: Umbria, Sicily and Sardinia. The authors concluded that Umbrian cultivars have mainly originated by selection from local oleasters. Interestingly, these cultivars are widely disseminated in the regions of north, central and southern Italy and this suggest their ancient origin. Albertini, et al.84 reported that the modern Italian olive cultivars, localized in Central
Italy, could derive from the hybridization between cv. Leccino and Dritta di Loreto with ancestral genotypes. Finally, Muzzalupo, et al.12 pointed out a high level of gene flow from the varieties cultivated in Central Italy and
the others spread throughout the Italian territory.
The second sub-population (Cluster Vr or IIIu) includes cultivars mainly from Sicily and Sardinia. We proved
that these cultivars never exchanged genetic material with the remaining varieties under investigation. The close relationship between the pools of the two islands suggests that they did not originated from local oleasters but most likely have been introduced into these regions from the outside9. This hypothesis is supported by Las Casas,
et al.79, who assessed the genetic diversity of olive cultivars from Sicily (several of which were also analyzed in
this study) and other countries of Mediterranean basin. The authors highlighted that Sicilian cultivars clearly separate from other Italian varieties but were grouped with cultivars from Spain and Marocco. Indeed, historical and cultural relationships between Catalan and Sardinian and Sicilian cultures are well known85 as well as trading
contacts between Italian insular regions and Phoenicians.
The third sub-population (cluster IIIr or IIu) could derive from a common ancestor from Magno-Greek origin,
since all the cultivars in this sub-population are cultivated in Southern Italy, that was colonized by the Greeks in the eighth century BC86. In particular, two sub-clusters can be identified: cluster IIIra or IIua and IIIrb or IIub refer
to the area of Ionic and Doric influence, respectively. Within the Doric group are cultivars from Salento (Cellina di Nardò) and Calabria (Sinopolese e Ottobratica). All are characterised by small drupes and monumental trees and are subjected to the same cropping system87.
The Ionic group includes cultivars originating from the Magno-Greek Ionian cities such as Ferrandina and Metaponto88, and, indeed, the most representative cultivar within this group is “Maiatica di Ferrandina”.
It is noteworthy that varieties cultivated in geographically distant but culturally close areas are part of this group. This is probably due to close trading ties between the Etruscans/Italiote populations (Campania: Rosciola, Puntella, Caiazzana; Umbria/Lazio: Dolce Agogia) and the Magno-Greek colonies89.
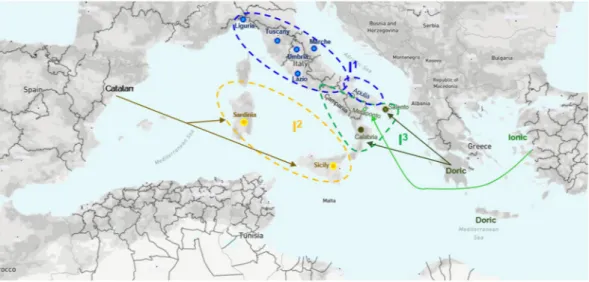
To sum up, we identified three main gene pools, which we named I1, I2, I3. I1 represents most of the Italiote
cultivars with admixed ancestry; I2 consists of cultivars of Catalan origin and I3 includes most of the cultivars of
Magno-Greek origin (Fig. 6).
Such a grouping reflects to some extent what already observed by Diez, et al.18 and by Besnard, et al.3.
According to Besnard et al.3, the centre of olive origin would be in the North Levant, from which two parallel
diversification processes took place, one in the Western and the other in the Eastern part of the Mediterranean basin. In order to verify this hypothesis, Besnard et al.3 used chloroplast DNA markers to genotype a large
col-lection of cultivars from all over the Mediterranean basin. The authors identified three lines of ancestry tagged as E1, E2 and E3. Line E1 included cultivars from the Eastern Mediterranean (North Levant and Greece), while lines
Figure 6. Geographical distribution on Italian territory of three main gene pools we identified via GBS-derived
SNP markers in the olive germplasm collection under study. The blue circles (I1) encloses all the Italiote cultivars
with admixed ancestry. Inside the yellow circle (I2) all the cultivars with Catalan origin are placed. Finally, inside
the green circle (I3) are most of the cultivars of Magno-Greek origin split into varieties from Ionic (dark green
E2/E3 consist of varieties from the Western and Central Mediterranean. A further study based on SSR markers highlighted the existence of three genetic groups of olive cultivars in the Mediterranean basin (tagged as Q1, Q2 and Q3)18. Q3 includes cultivars subjected to the first event of domestication occurred in North Levant (which
corresponds to line E1), followed by a secondary independent event of domestication in central Mediterranean basin (Q2). Notably, Q2 (which corresponds to lines E2/E3) is a product of admixture between the set of Eastern domesticates (Q3) and Western oleasters. A close genetic relationship between cultivars in Southern Spain (Q1) and the feral forms from the Eastern was observed.
The scenario just outlined for the population under investigation, although supported by different methods of analysis and by literature on the subject, may serve as working hypothesis for subsequent studies.
Herein, we evaluated the extent of LD decay and found that the rapid LD decay inferred by this study is con-sistent with previous estimates in olive38 as well as in other fruit crops90. The low extension of LD may be probably
due to the self-incompatibility of several olive cultivars: the higher the level of heterozygosity is, then the lower the LD that is counterbalanced by the increasing number of recombination events.
Although our work overlaps to some extent previous studies based on a limited number of AFLP, SSR and SNP markers, we provided much more precise indications on genetic similarity among the cultivars in the germplasm collection thanks to a large genome-wide SNP panel. Indeed, we were able to capture genetic variability at an unprecedented level of detail. This, in turn, allowed pairs of cultivars that look very similar to each other (cases of synonymy) to be identified based on identity-by-state (IBS) computation.
In total agreement with previous studies, we corroborated the evidence that the geographical area of cultiva-tion is a driving force for genetic clustering. The novelty that emerges when allele-frequency distribucultiva-tion histo-grams by STRUCTURE and dendrohisto-grams by AWclust are taken into account is that olive drupe weight plays a major role in structuring genetic diversity in olive.
Finally, we believe that the genome-wide SNP panel we generated and released to the public will be valuable for future genome-wide association studies.
Methods
Plant material and DNA extraction.
A panel of 94 Olea europaea L. var. sativa olive cultivars (see Supplementary Table S1) was selected from a large collection of ~500 cultivars corresponding to 85% of the total Italian olive germplasm12 grown at the experimental field of CREA Research Centre for Olive, Citrus and TreeFruit on the Ionian Sea cost of Northern Calabria, Italy (39°37′00′′ North latitude, 16°45′53′′ East longitude, 6 m a.s.l.). Olive trees were spaced with a regular planting pattern of 4 × 6 m. Drupe weight (g) in Supplementary Table S1 was measured considering the average weight of 100 drupes per cultivar.
Such germplasm is considered diverse on a regional scale since each region has gradually selected varieties adapted to environmental, agronomic, cultural and traditional features of the site. With this in mind, the 94 cultivars were selected so that they could represent the whole genetic diversity and phenotypic variability of the original collection. Genomic DNA was extracted from young leaves using the protocol described by Doyle91 with
minor modifications as follow: after re-suspension in TE 0.1X, 2 volumes of CIA 24:1 were added to the mixture, then 2.5 volumes of 100% ethanol and 1/10 volume of sodium acetate 3 M pH 5.2 were added to force DNA precipitation. DNA quality and concentration were checked by agarose gel 0.8% and Qubit 3.0 fluorometer (Life Technologies, USA).
Genotyping-by-sequencing and SNP calling.
Genotyping-by-sequencing was performed as described by Taranto, et al.48 using the EcoT22I restriction enzyme. Two different pipelines were run for SNP calling: thereference-independent TASSEL-UNEAK pipeline53 and the reference-based TASSEL-GBS pipeline92. In the
TASSEL-GBS pipeline, master tags (i.e. collapsed sequence tags from each sequence file) were aligned along the olive tree reference genome available at http://denovo.cnag.cat/genomes/olive/download/Oe6/Oe6.scaffolds. fa.gz66 using the Burrows-Wheeler Aligner tool (version 0.7.8-r455) with default settings.
Both pipelines produced a VCF file that was subjected to a filtering procedure using VCFtools [ver-sion 0.1.1393;] with the following parameters: minimum allele frequency (MAF) ≥0.05, max-missing = 0.90,
Hardy-Weinberg Equilibrium (hwe) = p ≤ 0.001 and min-mean depth = 5. Single nucleotide InDels were removed. VCFtools were also used to generate various statistics on the dataset under investigation and to add gene annotations to VCF files.
Ten SNP loci were selected in three cultivars (i.e. Ascolana tenera, Tendellone and Leccino that exhibit nucle-otide differences at the same position) for validation by PCR amplifications and Sanger sequencing (ABI PRISM 3130, Genetic Analyzer, Applied Biosystems
™
, USA) (see Supplementary Table S3). With a custom Perl script, a genomic region of 150 nucleotides surrounding each SNP locus was extracted and Oligo Explorer 1.2 (http:// www.genelink.com/tools/gl-oe.asp) was employed to guide primer design (see Supplementary Table S3).Linkage disequilibrium (LD) was calculated on the SNP dataset derived from the TASSEL-GBS pipeline using the SNP & Variation Suite software (SVS; v8.4.0; Golden Helix Inc. Bozeman, MT, USA, www.goldenhelix.com). LD decay across the genome was evaluated considering the SNPs of the 30 longest scaffolds (see Supplementary Table S6). The point where the loess curve reaches the plateau was considered the background level of LD.
Genetic diversity analysis.
High quality SNPs from TASSEL-UNEAK and TASSEL-GBS were used as input for a parametric [STRUCTURE v.2.3.467;] and a non-parametric population structure analysis software[AWclust68].
As the STRUCTURE algorithm assumes independent loci, a SNP dataset pruned from loci in strong LD was generated using the SVS software v8.4.0, setting the r2 threshold equal to 0.5. For each K (from 1 to 10) ten
phases followed by 100,000 iterations. The optimal K value was estimated using Structure Harvester94. Cultivars
having a membership coefficient (qi) ≥0.60 were clustered, while varieties with qi < 0.60 at each assigned K were
considered as admixed. To determine the level of differentiation among sub-populations, we calculated the fixa-tion index (FST) among all possible pair-wise combinations using SVS.
AWclust was also used to generate a matrix of pair-wise allele sharing distances (ADS) between all individuals in the dataset and to infer population structure. Gap statistic was employed to calculate the optimal number of groups (K) based on sample genetic relatedness95. Pair-wise IBS allele-sharing estimates among olive tree
sam-ples were calculated using PLINK96 v1.90b5.2 and graphically represented by MDS plot. TREEMIX69 was used
to infer patterns of population mixtures and to test the presence of gene flow among olive sub-populations. A variable number of migration events (M) ranging from 0 to 10 was tested and the value of M that had the highest log-likelihood was selected as the most predictive model.
Statistical analysis.
The MSTAT-C package (1983) was used to perform a one-way analysis of variance (ANOVA) in order to determine whether there are any statistically significant differences between the means of drupe weight of cultivars in AWclust and STRUCTURE groups.Data Access
Raw sequences were submitted to the European Nucleotide Archive (ENA; http://www.ebi.ac.uk/ena) under the study accession number PRJEB21079. Unfiltered VCF files are downloadable as compressed Supplementary Files S1 and S2.
References
1. Kaniewski, D. et al. Primary domestication and early uses of the emblematic olive tree: palaeobotanical, historical and molecular evidence from the Middle East. Biological Reviews 87, 885–899, https://doi.org/10.1111/j.1469-185X.2012.00229.x (2012). 2. Zohary, D., Hopf, M. & Weiss, E. Domestication of Plants in the Old World: The Origin and Spread of Domesticated Plants in
Southwest Asia, Europe, and the Mediterranean Basin. Oxford University Press on Demand (2012).
3. Besnard, G. et al. The complex history of the olive tree: from Late Quaternary diversification of Mediterranean lineages to primary domestication in the northern Levant. Proceedings of the Royal Society B: Biological Sciences 280, https://doi.org/10.1098/ rspb.2012.2833 (2013).
4. Barazani, O. et al. Genetic variation of naturally growing olive trees in Israel: from abandoned groves to feral and wild? BMC Plant
Biology 16, 261, https://doi.org/10.1186/s12870-016-0947-5 (2016).
5. Galili, E., Stanley, D. J., Sharvit, J. & Weinstein-Evron, M. Evidence for Earliest Olive-Oil Production in Submerged Settlements off the Carmel Coast, Israel. Journal of Archaeological Science 24, 1141–1150, https://doi.org/10.1006/jasc.1997.0193 (1997). 6. Besnard, G., Baradat, P., Breton, C., Khadari, B. & Berville, A. Olive domestication from structure of oleasters and cultivars using
nuclear RAPDs and mitochondrial RFLPs. Genetics Selection Evolution 33, S251–S268 (2001).
7. Besnard, G. Origin and Domestication. In: Rugini E., Baldoni L., Muleo R., Sebastiani L. (eds) The Olive Tree Genome. Compendium
of Plant Genomes. Springer, Cham. 1–12, https://doi.org/10.1007/978-3-319-48887-5_1 (2016).
8. Terral, J. F. et al. Historical biogeography of olive domestication (Olea europaea L.) as revealed by geometrical morphometry applied to biological and archaeological material. Journal of Biogeography 31, 63–77, https://doi.org/10.1046/j.0305-0270.2003.01019.x (2004). 9. Baldoni, L. et al. Genetic Structure of Wild and Cultivated Olives in the Central Mediterranean Basin. Annals of Botany 98, 935–942,
https://doi.org/10.1093/aob/mcl178 (2006).
10. Vossen, P. Olive oil: History, production, and characteristics of the world’s classic oils. HortScience 42, 1093–1100 (2007). 11. Hitchner, R. B. Olive production and the Roman economy: the case for intensive growth in the Roman Empire. The ancient economy
71–83 (2002).
12. Muzzalupo, I., Vendramin, G. G. & Chiappetta, A. Genetic Biodiversity of Italian Olives (Olea europaea) Germplasm Analyzed by SSR Markers. The Scientific World Journal 2014, 12, https://doi.org/10.1155/2014/296590 (2014).
13. Vivaldi, G. A., Strippoli, G., Pascuzzi, S., Stellacci, A. M. & Camposeo, S. Olive genotypes cultivated in an adult high-density orchard respond differently to canopy restraining by mechanical and manual pruning. Scientia Horticulturae 192, 391–399, https://doi. org/10.1016/j.scienta.2015.06.004 (2015).
14. Pellegrini, G. et al. Application of water footprint to olive growing systems in the Apulia region: a comparative assessment. Journal
of Cleaner Production 112, 2407–2418, https://doi.org/10.1016/j.jclepro.2015.10.088 (2016).
15. Delplancke, M. et al. Evolutionary history of almond tree domestication in the Mediterranean basin. Molecular Ecology 22, 1092–1104, https://doi.org/10.1111/mec.12129 (2013).
16. Decroocq, S. et al. New insights into the history of domesticated and wild apricots and its contribution to Plum pox virus resistance.
Molecular Ecology 25, 4712–4729, https://doi.org/10.1111/mec.13772 (2016).
17. Cornille, A. et al. New Insight into the History of Domesticated Apple: Secondary Contribution of the European Wild Apple to the Genome of Cultivated Varieties. PLOS Genetics 8, e1002703, https://doi.org/10.1371/journal.pgen.1002703 (2012).
18. Diez, C. M. et al. Olive domestication and diversification in the Mediterranean Basin. New Phytologist 206, 436–447, https://doi. org/10.1111/nph.13181 (2015).
19. Mousavi, S. et al. The eastern part of the Fertile Crescent concealed an unexpected route of olive (Olea europaea L.) differentiation.
Annals of Botany 119, 1305–1318, https://doi.org/10.1093/aob/mcx027 (2017).
20. Myles, S. et al. Genetic structure and domestication history of the grape. Proceedings of the National Academy of Sciences 108, 3530–3535, https://doi.org/10.1073/pnas.1009363108 (2011).
21. Loconsole, G. et al. Intercepted isolates of Xylella fastidiosa in Europe reveal novel genetic diversity. European Journal of Plant
Pathology 146, 85–94, https://doi.org/10.1007/s10658-016-0894-x (2016).
22. Sardaro, R. et al. Agro-biodiversity of Mediterranean crops: farmers’ preferences in support of a conservation programme for olive landraces. Biological Conservation 201, 210–219, https://doi.org/10.1016/j.biocon.2016.06.033 (2016).
23. White, S. M., Bullock, J. M., Hooftman, D. A. P. & Chapman, D. S. Modelling the spread and control of Xylella fastidiosa in the early stages of invasion in Apulia, Italy. Biological Invasions 19, 1825–1837, https://doi.org/10.1007/s10530-017-1393-5 (2017). 24. Pasqualone, A. et al. Evolution and perspectives of cultivar identification and traceability from tree to oil and table olives by means
of DNA markers. Journal of the Science of Food and Agriculture 96, 3642–3657, https://doi.org/10.1002/jsfa.7711 (2016).
25. Belaj, A., Trujillo, I., De la Rosa, R., Rallo, L. & Giménez, M. J. Polymorphism and discrimination capacity of randomly amplified polymorphic markers in an olive germplasm bank. Journal of the American Society for Horticultural Science 126(1), 64–71 (2001). 26. Rallo, P., Dorado, G. & Martín, A. Development of simple sequence repeats (SSRs) in olive tree (Olea europaea L.). Theoretical and
Applied Genetics 101, 984–989, https://doi.org/10.1007/s001220051571 (2000).
27. Belaj, A. et al. Genetic Diversity and Population Structure of Wild Olives from the North-western Mediterranean Assessed by SSR Markers. Annals of Botany 100, 449–458, https://doi.org/10.1093/aob/mcm132 (2007).
28. Boucheffa, S. et al. The coexistence of oleaster and traditional varieties affects genetic diversity and population structure in Algerian olive (Olea europaea) germplasm. Genetic Resources and Crop Evolution 64, 379–390, https://doi.org/10.1007/s10722-016-0365-4 (2017). 29. Sakar, E., Unver, H. & Ercisli, S. Genetic Diversity Among Historical Olive (Olea europaea L.) Genotypes from Southern Anatolia
Based on SSR Markers. Biochemical Genetics 54, 842–853, https://doi.org/10.1007/s10528-016-9761-x (2016).
30. Alba, V., Montemurro, C., Sabetta, W., Pasqualone, A. & Blanco, A. SSR-based identification key of cultivars of Olea europaea L. diffused in Southern-Italy. Scientia Horticulturae 123, 11–16, https://doi.org/10.1016/j.scienta.2009.07.007 (2009).
31. Baldoni, L., Pellegrini, M., Mencuccini, M., Angiolillo, A. & Mulas, M. Genetic relationships among cultivated and wild olives revealed by AFLP markers. In XXV International Horticultural Congress, Part 11: Application of Biotechnology and Molecular Biology
and Breeding-Gene 521, 275-284, https://doi.org/10.17660/ActaHortic.2000.521.30 (1998).
32. Montemurro, C., Simeone, R., Pasqualone, A., Ferrara, E. & Blanco, A. Genetic relationships and cultivar identification among 112 olive accessions using AFLP and SSR markers. The Journal of Horticultural Science and Biotechnology 80, 105–110, https://doi.org/1 0.1080/14620316.2005.11511899 (2005).
33. Ipek, M., Seker, M., Ipek, A. & Gul, M. K. Identification of molecular markers associated with fruit traits in olive and assessment of olive core collection with AFLP markers and fruit traits. Genetics and Molecular Research 14, 2762–2774, https://doi. org/10.4238/2015.March.31.6 (2015).
34. Kaya, H. B. et al. SNP discovery by illumina-based transcriptome sequencing of the olive and the genetic characterization of Turkish olive genotypes revealed by AFLP, SSR and SNP markers. PLoS One 8, e73674, https://doi.org/10.1371/journal.pone.0073674 (2013). 35. Resta, P. et al. Use of AFLP to characterize Apulian olive varieties (O. europaea L.). Acta Horticolturae 586, 73–77, https://doi.
org/10.17660/ActaHortic.2002.586.6 (2002).
36. Sabetta, W. et al. Fad7 gene identification and fatty acids phenotypic variation in an olive collection by EcoTILLING and sequencing approaches. Plant Physiology and Biochemistry 69, 1–8, https://doi.org/10.1016/j.plaphy.2013.04.007 (2013).
37. Biton, I. et al. Development of a large set of SNP markers for assessing phylogenetic relationships between the olive cultivars composing the Israeli olive germplasm collection. Molecular Breeding 35, 107, https://doi.org/10.1007/s11032-015-0304-7 (2015). 38. Kaya, H. B. et al. Association Mapping in Turkish Olive Cultivars Revealed Significant Markers Related to Some Important
Agronomic Traits. Biochemical Genetics 54, 506–533, https://doi.org/10.1007/s10528-016-9738-9 (2016).
39. Mammadov, J., Aggarwal, R., Buyyarapu, R. & Kumpatla, S. SNP Markers and Their Impact on Plant Breeding. International Journal
of Plant Genomics 2012, 728398, 11, https://doi.org/10.1155/2012/728398 (2012).
40. Kim, C. et al. Application of genotyping by sequencing technology to a variety of crop breeding programs. Plant Science 242, 14–22,
https://doi.org/10.1016/j.plantsci.2015.04.016 (2016).
41. Torkamaneh, D., Laroche, J. & Belzile, F. Genome-Wide SNP Calling from Genotyping by Sequencing (GBS) Data: A Comparison of Seven Pipelines and Two Sequencing Technologies. PLoS One 11, e0161333, https://doi.org/10.1371/journal.pone.0161333 (2016). 42. Taranto, F., D’Agostino, N. & Tripodi, P. An Overview of Genotyping by Sequencing in Crop Species and Its Application in Pepper. In:
Rogato A., Zazzu V., Guarracino M. (eds) Dynamics of Mathematical Models in Biology. Springer, Cham. Springer, Cham. 101–116,
https://doi.org/10.1007/978-3-319-45723-9_9 (2016).
43. Verma, S. et al. High-density linkage map construction and mapping of seed trait QTLs in chickpea (Cicer arietinum L.) using Genotyping-by-Sequencing (GBS). Scientific Reports 5, 17512, https://doi.org/10.1038/srep17512 (2015).
44. Boutet, G. et al. SNP discovery and genetic mapping using genotyping by sequencing of whole genome genomic DNA from a pea RIL population. BMC Genomics 17, 121, https://doi.org/10.1186/s12864-016-2447-2 (2016).
45. Heim, C. B. & Gillman, J. D. Genotyping-by-Sequencing-Based Investigation of the Genetic Architecture Responsible for a ∼Sevenfold Increase in Soybean Seed Stearic Acid. G3: Genes|Genomes|Genetics 7, 299–308, https://doi.org/10.1534/g3.116.035741 (2017). 46. Kujur, A. et al. Functionally Relevant Microsatellite Markers From Chickpea Transcription Factor Genes for Efficient Genotyping
Applications and Trait Association Mapping. DNA Research 20, 355–374, https://doi.org/10.1093/dnares/dst015 (2013).
47. Pavan, S. et al. A Distinct Genetic Cluster in Cultivated Chickpea as Revealed by Genome-wide Marker Discovery and Genotyping.
The Plant Genome 10, https://doi.org/10.3835/plantgenome2016.11.0115 (2017).
48. Taranto, F., D’Agostino, N., Greco, B., Cardi, T. & Tripodi, P. Genome-wide SNP discovery and population structure analysis in pepper (Capsicum annuum) using genotyping by sequencing. BMC Genomics 17, 943, https://doi.org/10.1186/s12864-016-3297-7 (2016). 49. Arruda, M. P. et al. Genome-Wide Association Mapping of Fusarium Head Blight Resistance in Wheat using
Genotyping-by-Sequencing. The Plant Genome 9, https://doi.org/10.3835/plantgenome2015.04.0028 (2016).
50. Nimmakayala, P. et al. Single nucleotide polymorphisms generated by genotyping by sequencing to characterize genome-wide diversity, linkage disequilibrium, and selective sweeps in cultivated watermelon. BMC Genomics 15, 767, https://doi. org/10.1186/1471-2164-15-767 (2014).
51. Pavan, S. et al. Genotyping-by-sequencing of a melon (Cucumis melo L.) germplasm collection from a secondary center of diversity highlights patterns of genetic variation and genomic features of different gene pools. BMC Genomics 18, 59, https://doi.org/10.1186/ s12864-016-3429-0 (2017).
52. Catchen, J. M., Amores, A., Hohenlohe, P., Cresko, W. & Postlethwait, J. H. Stacks: Building and Genotyping Loci De Novo From Short-Read Sequences. G3: Genes|Genomes|Genetics 1, 171–182, https://doi.org/10.1534/g3.111.000240 (2011).
53. Lu, F. et al. Switchgrass genomic diversity, ploidy, and evolution: novel insights from a network-based SNP discovery protocol. PLoS
Genet 9, e1003215, https://doi.org/10.1371/journal.pgen.1003215 (2013).
54. Melo, A. T. O., Bartaula, R. & Hale, I. GBS-SNP-CROP: a reference-optional pipeline for SNP discovery and plant germplasm characterization using variable length, paired-end genotyping-by-sequencing data. BMC Bioinformatics 17, 29, https://doi. org/10.1186/s12859-016-0879-y (2016).
55. Huang, B. E., Raghavan, C., Mauleon, R., Broman, K. W. & Leung, H. Efficient Imputation of Missing Markers in Low-Coverage Genotyping-by-Sequencing Data from Multiparental Crosses. Genetics 197, 401–404, https://doi.org/10.1534/genetics.113.158014 (2014). 56. Russell, J. et al. The use of genotyping by sequencing in blackcurrant (Ribes nigrum): developing high-resolution linkage maps in species without reference genome sequences. Molecular Breeding 33, 835–849, https://doi.org/10.1007/s11032-013-9996-8 (2014). 57. Balsalobre, T. W. A. et al. GBS-based single dosage markers for linkage and QTL mapping allow gene mining for yield-related traits
in sugarcane. BMC Genomics 18, 72, https://doi.org/10.1186/s12864-016-3383-x (2017).
58. Biazzi, E. et al. Genome-Wide Association Mapping and Genomic Selection for Alfalfa (Medicago sativa) Forage Quality Traits. PLoS
One 12, e0169234, https://doi.org/10.1371/journal.pone.0169234 (2017).
59. Henning, J. A. et al. Genotyping-by-sequencing of a bi-parental mapping population segregating for downy mildew resistance in hop (Humulus lupulus L.). Euphytica 208, 545–559, https://doi.org/10.1007/s10681-015-1600-3 (2016).
60. İpek, A. et al. SNP Discovery by GBS in Olive and the Construction of a High-Density Genetic Linkage Ma. Biochemical Genetics 54, 313–325, https://doi.org/10.1007/s10528-016-9721-5 (2016).
61. Marchese, A. et al. The first high-density sequence characterized SNP-based linkage map of olive (Olea europaea L. subsp. europaea) developed using genotyping by sequencing. Australian Journal of Crop Science 10, 857–863, https://doi.org/10.21475/ajcs.2016.10.06. p7520 (2016).
62. Sarnari, T. ISMEA, www.ismea.it/flex/files/7/7/d/D.d9ca1e163f12132ec6bc/Presentazione_Olio.pptx (2012).
63. Rotondi, A., Magli, M., Ricciolini, C. & Baldoni, L. Morphological and molecular analyses for the characterization of a group of Italian olive cultivars. Euphytica 132, 129–137, https://doi.org/10.1023/a:1024670321435 (2003).
64. Hatzopoulos, P. et al. Breeding, molecular markers and molecular biology of the olive tree. European Journal of Lipid Science and
65. Owen, C. A. et al. AFLP reveals structural details of genetic diversity within cultivated olive germplasm from the Eastern Mediterranean. Theoretical and Applied Genetics 110, 1169–1176, https://doi.org/10.1007/s00122-004-1861-z (2005).
66. Cruz, F. et al. Genome sequence of the olive tree, Olea europaea. GigaScience 5, 29, https://doi.org/10.1186/s13742-016-0134-5
(2016).
67. Pritchard, J. K., Stephens, M. & Donnelly, P. Inference of population structure using multilocus genotype data. Genetics 155, 945–959 (2000).
68. Gao, X. & Starmer, J. D. AWclust: point-and-click software for non-parametric population structure analysis. BMC Bioinformatics 9, 77, https://doi.org/10.1186/1471-2105-9-77 (2008).
69. Pickrell, J. K. & Pritchard, J. K. Inference of Population Splits and Mixtures from Genome-Wide Allele Frequency Data. PLOS
Genetics 8, e1002967, https://doi.org/10.1371/journal.pgen.1002967 (2012).
70. Godini, A., Vivaldi, G. A. & Camposeo, S. Olive cultivars field-tested in super-high-density system in southern Italy. California
Agriculture 65 (2011).
71. Rosati, A., Zipanćič, M., Caporali, S. & Padula, G. Fruit weight is related to ovary weight in olive (Olea europaea L.). Scientia
Horticulturae 122, 399–403, https://doi.org/10.1016/j.scienta.2009.05.034 (2009).
72. Fendri, M., Trujillo, I., Trigui, A., Rodríguez-García, M. I. & Ramírez, J. D. A. Simple sequence repeat identification and endocarp characterization of olive tree accessions in a Tunisian germplasm collection. HortScience 45, 1429–1436 (2010).
73. Godini, A., Mariani, R., Pacifico, A. & Palasciano, M. Repeatedly reported but hitherto undescribed olive cultivars native to Southern Italy. In IV International Symposium on Olive Growing. 586, 201–204, https://doi.org/10.17660/ActaHortic.2002.586.36 (2002). 74. Boskou, D., Camposeo, S. & Clodoveo, M. L. Table olives as sources of bioactive compounds. In Olive and Olive Oil Bioactive
Constituents, 217–259, https://doi.org/10.1016/B978-1-63067-041-2.50014-8 (2015).
75. Lavee, S. Evaluation of the need and present potential of olive breeding indicating the nature of the available genetic resources involved. Scientia Horticulturae 161, 333–339, https://doi.org/10.1016/j.scienta.2013.07.002 (2013).
76. El Bakkali, A. et al. Construction of Core Collections Suitable for Association Mapping to Optimize Use of Mediterranean Olive (Olea europaea L.) Genetic Resources. PLoS ONE 8, https://doi.org/10.1371/journal.pone.0061265 (2013).
77. Guerin, J. & Sedgley, M. Cross-pollination in olive cultivars. Barton: Rural Industries Research and Development Corporation (2007). 78. Linos, A., Nikoloudakis, N., Katsiotis, A. & Hagidimitriou, M. Genetic structure of the Greek olive germplasm revealed by RAPD,
ISSR and SSR markers. Scientia Horticulturae 175, 33–43, https://doi.org/10.1016/j.scienta.2014.05.034 (2014).
79. Las Casas, G. et al. Molecular characterization of olive (Olea europaea L.) Sicilian cultivars using SSR markers. Biochemical
Systematics and Ecology 57, 15–19, https://doi.org/10.1016/j.bse.2014.07.010 (2014).
80. Terral, J.-F. & Arnold-Simard, G. Beginnings of Olive Cultivation in Eastern Spain in Relation to Holocene Bioclimatic Changes.
Quaternary Research 46, 176–185, https://doi.org/10.1006/qres.1996.0057 (1996).
81. Lauri, P. E. et al. Does knowledge on fruit tree architecture and its implications for orchard management improve horticultural sustainability? In I International Symposium on Horticulture in Europe 817, 243–250, https://doi.org/10.17660/ ActaHortic.2009.817.25 (2008).
82. Cherbiy-Hoffmann, S. U., Searles, P. S., Hall, A. J. & Rousseaux, M. C. Influence of light environment on yield determinants and components in large olive hedgerows following mechanical pruning in the subtropics of the Southern Hemisphere. Scientia
Horticulturae 137, 36–42, https://doi.org/10.1016/j.scienta.2012.01.019 (2012).
83. Gregoriou, K., Pontikis, K. & Vemmos, S. Effects of reduced irradiance on leaf morphology, photosynthetic capacity, and fruit yield in olive (Olea europaea L.). Photosynthetica 45, 172–181, https://doi.org/10.1007/s11099-007-0029-x (2007).
84. Albertini, E. et al. Structure of genetic diversity in Olea europaea L. cultivars from central Italy. Molecular Breeding 27, 533–547,
https://doi.org/10.1007/s11032-010-9452-y (2011).
85. Vona, G. The peopling of Sardinia (Italy): history and effects. International Journal of Anthropology 12, 71–87, https://doi. org/10.1007/bf02447890 (1997).
86. Malkin, I. Networks and the Emergence of Greek Identity. Mediterranean Historical Review 18, 56–74, https://doi. org/10.1080/0951896032000230480 (2003).
87. Famiani, F. et al. Evaluation of different mechanical fruit harvesting systems and oil quality in very large size olive trees. Spanish
Journal of Agricultural Research 12(4), 960–972, https://doi.org/10.5424/sjar/2014124-5794 (2014). 88. Cerchiai, L., Jannelli, L. & Longo, F. The Greek Cities of Magna Graecia and Sicily. Getty Publications (2004).
89. Dini, A., Corretti, A., Innocenti, F., Rocchi, S. & Westerman, D. S. Sooty sweat stains or tourmaline spots? The Argonauts on the Island of Elba (Tuscany) and the spread of Greek trading in the Mediterranean Sea. Geological Society, London, Special Publications
273, 227–243, https://doi.org/10.1144/gsl.sp.2007.273.01.18 (2007).
90. Khan, M. A. & Korban, S. S. Association mapping in forest trees and fruit crops. Journal of Experimental Botany 63, 4045–4060,
https://doi.org/10.1093/jxb/ers105 (2012).
91. Doyle, J. J. Isolation of plant DNA from fresh tissue. Focus 12, 13–15 (1990).
92. Glaubitz, J. C. et al. TASSEL-GBS: a high capacity genotyping by sequencing analysis pipeline. PLoS One 9, e90346, https://doi. org/10.1371/journal.pone.0090346 (2014).
93. Danecek, P. et al. The variant call format and VCFtools. Bioinformatics 27, 2156–2158, https://doi.org/10.1093/bioinformatics/btr330
(2011).
94. Earl, D. A. & vonHoldt, B. M. STRUCTURE HARVESTER: a website and program for visualizing STRUCTURE output and implementing the Evanno method. Conservation Genetics Resources 4, 359–361, https://doi.org/10.1007/s12686-011-9548-7 (2012). 95. Gao, X. & Martin, E. R. Using Allele Sharing Distance for Detecting Human Population Stratification. Human Heredity 68, 182–191,
https://doi.org/10.1159/000224638 (2009).
96. Chang, C. C. et al. Second-generation PLINK: rising to the challenge of larger and richer datasets. GigaScience 4, 7, https://doi. org/10.1186/s13742-015-0047-8 (2015).
Acknowledgements
We thank Dr. Erik Garrison for English language polishing. This research was supported by the regional government of Apulia within the: PROGRAMMA SVILUPPO RURALE FEASR 2014–2020 Asse II “Miglioramento dell’Ambiente e dello Spazio Rurale” Misura 10.2.1 “Progetti per la conservazione e valorizzazione delle risorse genetiche in agricoltura” - trascinamento della Misura 214 Az. 4 sub azione a) del PSR 2007–2013 Progetti integrati per la biodiversità - Progetto Re.Ger.O.P. “Recupero del Germoplasma Olivicolo Pugliese“ Progetto di continuità.
Author Contributions
C.M., F.T. and N.D.A. designed the experiment. C.M., F.T., V.D. and W.S. established the olive tree collection. E.P. and S.Z. and L.L. collected phenotypic data. F.T. and S.G. processed samples for the GBS assay. M.M.M. and V.F. performed SNP validation. N.D.A. carried out part of the bioinformatic analysis. F.T., G.M. and N.D.A. performed the genetic diversity analyses. E.C. performed TREEMIX analysis. F.T., G.M., N.D.A., S.C., C.L., E.C. and S.P. were involved in data interpretation. F.T. and N.D.A. wrote the manuscript. All authors critically revised the manuscript. All authors read and approved the final manuscript.
Additional Information
Supplementary information accompanies this paper at https://doi.org/10.1038/s41598-018-34207-y.
Competing Interests: The authors declare no competing interests.
Publisher’s note: Springer Nature remains neutral with regard to jurisdictional claims in published maps and
institutional affiliations.
Open Access This article is licensed under a Creative Commons Attribution 4.0 International
License, which permits use, sharing, adaptation, distribution and reproduction in any medium or format, as long as you give appropriate credit to the original author(s) and the source, provide a link to the Cre-ative Commons license, and indicate if changes were made. The images or other third party material in this article are included in the article’s Creative Commons license, unless indicated otherwise in a credit line to the material. If material is not included in the article’s Creative Commons license and your intended use is not per-mitted by statutory regulation or exceeds the perper-mitted use, you will need to obtain permission directly from the copyright holder. To view a copy of this license, visit http://creativecommons.org/licenses/by/4.0/.