Contract no. 688320
MADFORWATER
DevelopMent AnD application of integrated technological and management solutions FOR wasteWATER treatment and efficient reuse in agriculture tailored to the needs of
Mediterranean African Countries
Deliverable No. 5.2
Deliverable Full title WW management strategies and water & land management strategies in agriculture
Work Package No. and Title WP5 - Strategies and economic instruments for basin-scale water resources management Lead beneficiary (extended name
and acronym)
Universidad Politécnica de Madrid (UPM)
Authors
(Acronyms of beneficiaries contributing to the deliverable)
UPM: Consuelo Varela-Ortega, Najib Boubakri, Irene Blanco, Sebastián Sangro.
IAMB: Alessandra Scardigno, Nicola Lamaddalena FHNW: Emmanuel Oertlé, Sandra Müller, Andrin Dietziker
Planned delivery date 15/01/2020 (M44) Actual delivery date 22/1/2020 (M44) Dissemination level:
(PU = Public; PP = Restricted to other program participants; RE = Restricted to a group specified by the consortium; CO = Confidential, only for members of the
consortium)
PU
Project website www.madforwater.eu
Project start date and duration Start date of project: 01 June 2016 Duration: 48 months
The communication reflects only the author’s view and the Executive Agency for Small and Medium-sized Enterprises is not responsible for any use that may be made of the information it contains.
II
Contents
1. Introduction ... 1
2. Strategies and economic instruments for WW management (Task 5.2: FHNW) 3 2.1. Methodology: Development of a DST for the establishment of WW management strategies ... 3
2.1.1. Local adaptation of a decision support tool for water reclamation ... 3
2.1.2. Definition of representative case studies ... 7
2.1.3. Assessment of national-level conditions for water reuse ... 8
2.1.4. Resulting DST – DST for Water Reclamation beyond Technical Considerations ... 12
2.1.5. Economic instruments applied in water management in the agricultural sector ... 19
2.2. Application of the DST and assessment of national-level conditions for water reuse 22 2.2.1. Assessment of potential for municipal wastewater ... 22
2.2.2. Simulation and lifecycle costs of MADFORWATER project treatment trains ... 27
2.2.3. Assessment of national-level conditions for water reuse ... 29
2.3. Establishment of exemplary basin-scale and national WW management strategies including economic instruments ... 33
2.3.1. Egypt ... 34
2.3.1.1. Mapping of waste water reuse potential for irrigation in Egypt ... 34
2.3.1.2. Water reuse options based on the DST-Assessment ... 36
2.3.1.3. Water reuse option based on the MADFORWATER project pilot for drainage canal wastewater (DCWW) ... 39
2.3.1.4. Barriers and measures to foster implementation ... 40
2.3.2. Morocco ... 41
2.3.2.1. Mapping of Waste water reuse potential for irrigation in Morocco ... 41
2.3.2.2. Water reuse options based on the DST-Assessment ... 43
2.3.2.3. Water reuse options based on the DST-Assessment and specific data provided by local project partners ... 44
2.3.2.4. Water reuse options based on the MADFORWATER project pilots ... 46
2.3.2.5. Barriers and measures to foster implementation ... 47
2.3.3. Tunisia ... 48
2.3.3.1. Mapping of Waste water reuse potential for irrigation in Tunisia ... 49
2.3.3.2. Water reuse options based on the DST-Assessment ... 50
2.3.3.3. Water reuse option based on the MADFORWATER project pilot for Municipal Wastewater 51 2.3.3.4. Water reuse option based on the MADFORWATER project pilot for textile wastewater (TWW) ... 51
2.3.3.5. Barriers and measures to foster implementation ... 52
2.4. Intermediate conclusions ... 54
3. Strategies and economic instruments for water reuse and water & land management in agriculture (Task 5.3: UPM) ... 64
3.1. General structure of the DST ... 64
3.1.1. DST applied to Egypt ... 67
3.1.1.1. The case study of Kafr-El Sheikh ... 67
3.1.1.2. The model ... 68
3.1.1.3. Input data and Simulation Scenarios ... 68
The baseline scenario ... 71
3.1.2. DST applied to Morocco ... 72
3.1.2.1. The case study of the Citrus sector in Souss Massa basin ... 72
III
3.1.2.3. Input data and Simulation scenarios ... 73
3.1.3. DST applied to Tunisia. Knowledge base: Statistical and fieldwork analysis ... 76
3.1.3.1. The case study of Nabeul (Tunisia) ... 76
3.1.3.2. Fieldwork analysis and creation of a knowledge base ... 77
3.1.3.3. The model ... 79
3.1.3.4. Input data ... 79
3.1.3.5. Simulation scenarios ... 80
3.2. Water reuse and water & land management in agriculture under different scenarios: results and discussions ... 81
3.2.1. Egypt case study ... 81
3.2.1.1. The baseline (calibration) scenario ... 81
3.2.1.2. The Technology scenario ... 82
3.2.1.3. The Water Availability scenario ... 83
3.2.1.4. The Policy scenarios ... 84
3.2.1.5. Discussion ... 85
3.2.2. Morocco case study ... 87
3.2.2.1. The baseline (calibration) scenario ... 87
3.2.2.2. The Water Availability Scenario ... 88
3.2.2.3. The Policy scenarios ... 89
3.2.2.4. The Technology scenario ... 90
3.2.2.5. Discussion ... 90
3.2.3. Tunisia case study ... 92
3.2.3.1. The baseline (calibration) scenario ... 93
3.2.3.2. The water availability scenario (TWW use) ... 94
3.2.3.3. The technology scenarios (Irrigation management) ... 96
3.2.3.4. The policy scenario (Economic instrument for water management) ... 97
3.2.3.5. Discussion ... 101
4. Concluding remarks ... 104
5. Symbols and abbreviations ... 108
6. References ... 109
IV
Figure
Sfigure 1: The Middle East and North Africa is the most water-stressed region on earth. (World
Resources Institute 2019) ... 1
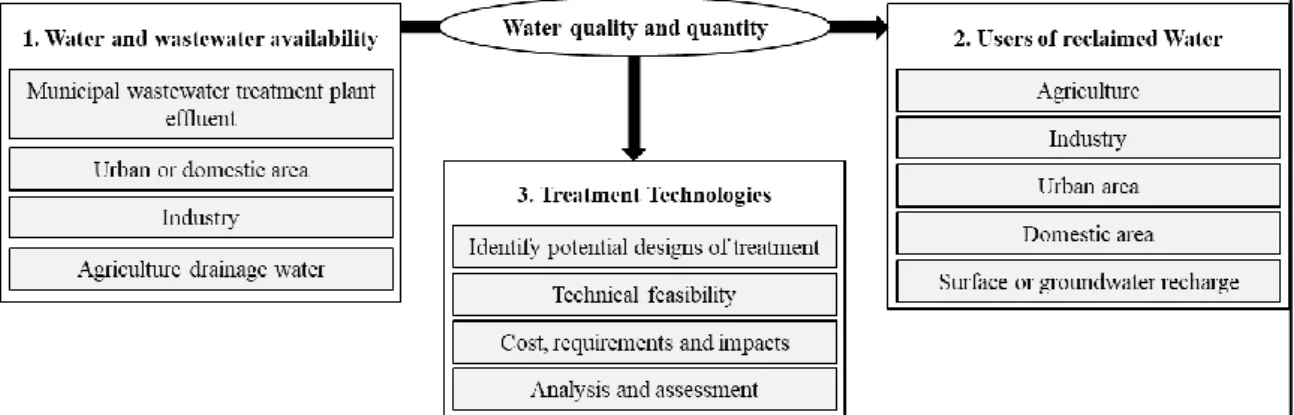
Figure 2: Water reuse for pre-feasibility in a systemic approach: (1) wastewater for reuse, (2) type of intended reuse, (3) identification and assessment of technology. ... 3
Figure 3: Application of the decision support tool (i.e. Poseidon) ... 8
Figure 4: DST Guided Steps ... 12
Figure 5: Learn - Essential information about the water reuse concept, underlying processes, definitions and terms. ... 13
Figure 6: Water quality & quantity entry ... 14
Figure 7: Water outflow quality entry ... 15
Figure 8: Distribution & storage costs ... 15
Figure 9: Weighting parameter entry ... 16
Figure 10: Technological results ... 17
Figure 11: National-level MCA results ... 18
Figure 12: Summary of resulting wastewater management strategies ... 18
Figure 13: Treatment trains lifecycle costs for different flow rates and countries. EG, MO and TU stand for Egypt, Morocco and Tunisia respectively. DCW stands for Drainage Canal Water, FVPWW stands for Fruit and Vegetable Packaging Wastewater, MWW stands for Municipal Wastewater, OMWW stands for Olive Mill Wastewater, and TWW stnads for Textile Wastewater. ... 28
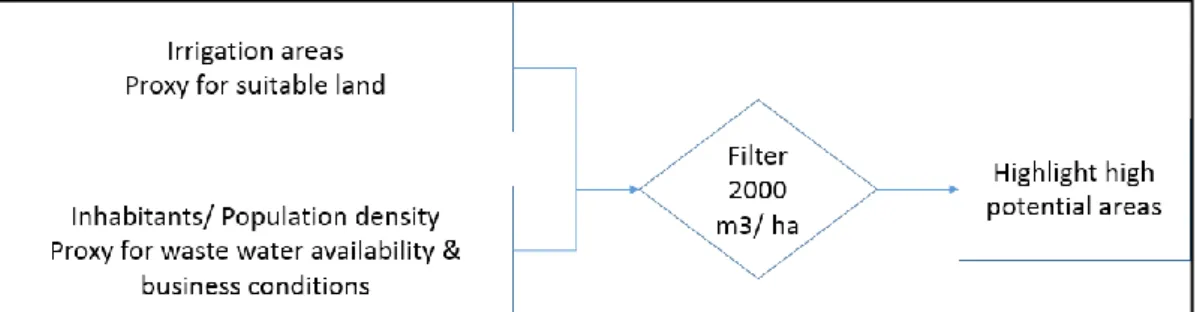
Figure 14: Simplified approach to enable wastewater reuse potential mapping in Morocco, Tunisia, and Egypt ... 34
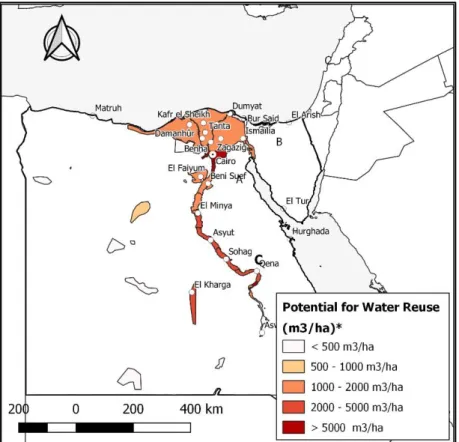
Figure 15: Egypt current wastewater production divided by irrigation area at district level. ... 35
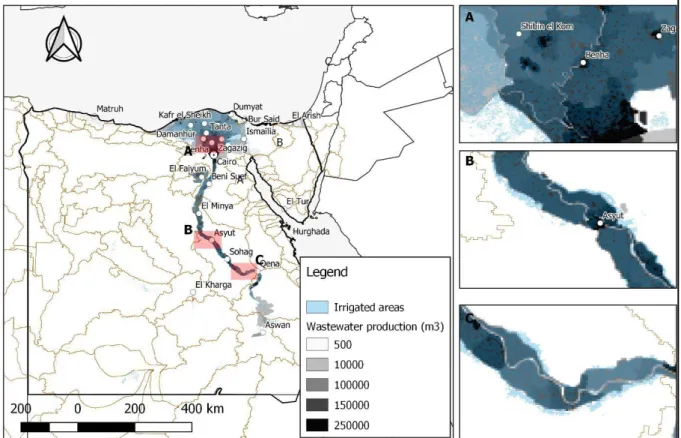
Figure 16: Egypt current location of wastewater production hotspots and location of irrigated areas ... 36
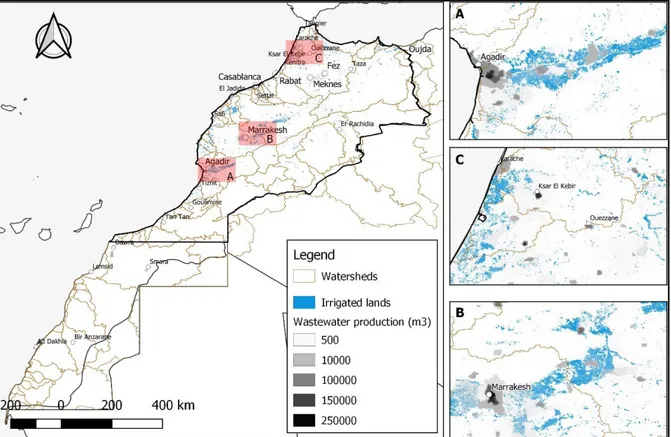
Figure 17: Morocco current Wastewater production divided by irrigated area at district level ... 42
Figure 18: Morocco current location of wastewater production hotspots and location of irrigated areas ... 43
Figure 19: Three potential reusers of the M’Zar WWTP tertiary effluent ... 45
Figure 20: Tunisia current Wastewater production divided by irrigated area at district level ... 49
Figure 21: Tunisia current location of wastewater production hotspots and location of irrigated area ... 50
Figure 22: general structure of the Agro-economic model ... 64
Figure 23: Self-compensating gated pipe system ... 72
figure 24: localization of Nabeul governorate, Tunisia case study ... 77
Figure 25: Model development steps based on the fieldworks ... 77
Figure 26: official invoice ... 80
Figure 27: Cropping pattern in the baseline scenario, Egypt ... 81
Figure 28: Difference among cost energy saving and cost of gated pipe technology, Egypt ... 86
Figure 29: Supplied and drained water in the different scenarios and in the three sections along the mesqua, Egypt ... 87
Figure 30: Land allocation for water source, Morocco ... 89
Figure 31: Water Cost and Farmers’ Income for the different scenarios, Morocco ... 91
Figure 32: Calibration results ... 93
Figure 33: Water shadow prices in different farm types for different levels of water availability .... 100
Figure 34: Water demand curves under uniform volumetric water prices ... 101
Figure 35: Aggregated results on farm income under different scenarios ... 102
Figure 36: Aggregated results on farmers' cropping strategies under different scenarios ... 103
V
Tables
Table 1: Typical wastewater qualities and guidelines for wastewater reuse (‘-‘stand for ’no data
available‘ or ’not defined’) ... 5
Table 2: Case studies considered for the assessments A and B ... 7
Table 3: Description of the thematic subjects, key questions, quantitative and semi-quantitative indicators with possible data sources. The grey highlighted cells are used in the DST in the simplified investigation. N/Av stands for ‘not available’. ... 10
Table 4: Economic instrument overview (MADFORWATER Project 2018) ... 21
Table 5: Top-ranking treatment trains based on cost (C1) and weights (W1) for treating municipal wastewater and secondary effluent to comply with ISO guidelines and lifecycle treatment costs in Egypt, Morocco and Tunisia ... 23
Table 6: Top-ranking treatment trains for treating municipal wastewater and secondary effluents to comply with Moroccan, Egyptian, and Tunisian regulations based on cost (C1) and weights (W1) ... 26
Table 7: Cost factors for selected treatment trains designed for specific types of wastewater in Egypt (EGY), Morocco (MAR), and Tunisia (TUN) ... 29
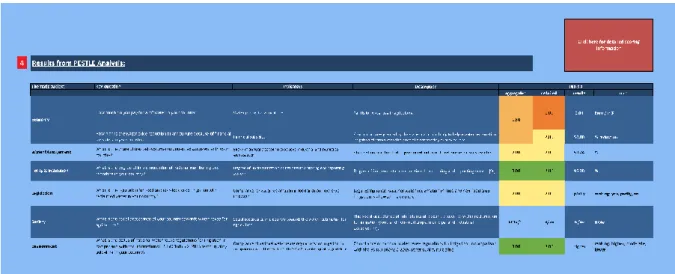
Table 8: The results of the level conditions for water reuse assessment. ‘Lower’ level conditions for water reuse is in red and equivalent to the score ‘1’, moderate national-level conditions for water reuse in yellow and equivalent to the score ‘2’, ‘higher’ national-national-level conditions for water reuse in green and equivalent to the score ‘3’. The aggregated values can in addition include ‘intermediate values between ‘1’ and ‘2’ in orange shades, and ‘2’ and ‘3’ in light green shades. Ts stands for Thematic subject. Ec stands for economy. WM stands for water management. P & I stand for policy and institution. L stands for legislation. S stands for society. En stands for environment. ‘-‘stand for ’no data available‘ or ’not defined. a: The simplified results; b: the “expert” (detailed) results ... 31
Table 9: Overview of resulting top-ranking options from the DST application and the MADFORWATER pilots in Egypt, Morocco and Tunisia ... 33
Table 10: Four top-ranked options for water reuse in Egypt based on lowest cost of treatment (treatment of 10,000 [m3/d]) ... 39
Table 11: Egypt’s result of multi criteria analysis of different key questions, strategy excerpt, identified barriers and (economic) instruments. The results of the national-level conditions for water reuse assessment. ‘Lower’ national-level conditions for water ... 40
Table 12: Selected areas of raw wastewater reuse in agriculture (from Choukr-Allah 2005 with reference to CSEC data from 1994) ... 42
Table 13: Four top-ranking scenarios for water reuse in Morocco based on lowest cost of treatment (treatment of 10,000 [m3/d]) ... 44
Table 14: Input data of the specific case study ... 45
Table 15: Inflow water quality parameter ... 45
Table 16: Agadir case study treatment option and cost results ... 46
Table 17: Morocco’s result of multi criteria analysis of different key questions, strategy excerpt, identified barriers and (economic) instruments. The results of the national-level conditions for water reuse assessment. ‘Lower’ national-level conditions for water reuse is in red and equivalent to the score ‘1’, moderate national-level conditions for water reuse in yellow and equivalent to the score ‘2’, ‘higher’ national-level conditions for water reuse in green and equivalent to the score ‘3’. Ts stands for Thematic subject. Ec stands for economy. WM stands for water management. P & I stand for policy and institution. L stands for legislation. S stands for society. En stands for environment. ‘-‘stand for ’no data available‘ or ’not defined ... 47
Table 18: Four top-ranking scenarios for water reuse in Tunisia based on lowest cost of treatment (treatment of 10,000 [m3/d]) ... 50
VI
Table 19: Tunisia’s result of multi criteria analysis of different key questions, strategy excerpt, identified barriers and (economic) instruments. The results of the national-level conditions for water reuse assessment. ‘Lower’ national-level conditions for water reuse is in red and equivalent to the score ‘1’, moderate national-level conditions for water reuse in yellow and equivalent to the score ‘2’, ‘higher’ national-level conditions for water reuse in green and equivalent to the score ‘3’. Ts stands for Thematic subject. Ec stands for economy. WM stands for water management. P & I stand for policy and institution. L stands for legislation. S stands
for society. En stands for environment. ‘-‘stand for ’no data available‘ or ’not defined ... 52
Table 20: Overview of the application of the DST and the pilot plant WW treatment type ... 56
Table 21: Cropping pattern in the selected Mesqa, Egypt ... 69
Table 22: Crop Yields, Egypt ... 69
Table 23: Cost of production, Egypt ... 69
Table 24: Prices of products, Egypt ... 69
Table 25: Available water per season and per position of the Mesqa, Egypt ... 70
Table 26: Net Irrigation requirement per crop, Egypt ... 70
Table 27: System irrigation efficiency, Egypt ... 71
Table 28: Annual water requirements (mm) for selected varieties on a fortnightly basis, Morocco .. 74
Table 29: Crop Yields, Morocco ... 75
Table 30: Variable costs, Morocco ... 75
Table 31: Fertilizers’ requirements, ... 75
Table 32: Crop prices, Morocco ... 75
Table 33: Representative farm types in the Tunisia case study ... 78
Table 34: Characteristics of the main crops ... 80
Table 35: Water demand, Baseline scenario, Egypt ... 82
Table 36: Drained water, Baseline scenario, Egypt ... 82
Table 37: System performance index, Egypt ... 82
Table 38: Water demand, Technology scenario, Egypt ... 82
Table 39: System performance index, Technology scenario, Egypt ... 83
Table 40: Drained total water, Technology scenario, Egypt ... 83
Table 41: System performance index, Water Availability scenario, Egypt ... 83
Table 42: Drained total water, Water Availability scenario, Egypt ... 84
Table 43: Water demand, Policy scenario, Egypt ... 84
Table 44: System performance index, Policy scenario, Egypt ... 85
Table 45: Fertilizers used, Morocco ... 88
Table 46: Water cost, Morocco ... 88
Table 47: Farmers’ income, Morocco ... 88
Table 48: Water used, Policy scenario, Morocco ... 89
Table 49: Indicators for the baseline results ... 94
Table 50: Results for the increase in water availability scenario considering water supply from WW reuse ... 95
Table 51: Results for the water availability scenario considering the two water types (TWW and FW) ... 96
Table 52: Results for the technology scenario ... 97
Table 53: Results for subsidizing fresh water ... 97
Table 54: Results for the scenario that TWW is not subsidized... 98
Table 55: Detailed description of the thematic subjects, key questions, quantitative and semi-quantitative indicators with possible data sources. N/Av stands for ‘not available’ ... 114
Table 56: Scoring of water reuse level: lover, moderate, and higher for each indicator. N/Av stands for not available ... 116
VII
Table 57: Investigation of the situation in Egypt, Tunisia, Morocco, and Australia related to possible wastewater reclamation. N/Av stands for ‘not available’ ... 119 Table 58: Cost factors considered for Egypt, Morocco, and Tunisia. ‘-‘stand for ’no data available‘ or
’not defined ... 123 Table 59: Weighting profile applied with assessment criteria for multi criteria analysis with
qualitative or semi-quantitative information. ‘-‘stand for ’no data available‘ or ’not defined . 124 Table 60: Top-ranking options for treating municipal wastewater to comply with ISO guidelines in
Egypt, Morocco and Tunisia based on cost (C1-C3) and weights (W1-W3 ... 125 Table 61: Top-ranking options for treating municipal wastewater secondary effluent to comply with
ISO guidelines in Egypt, Morocco and Tunisia based on cost (C1-C3) and weights (W1-W3) ... 127 Table 62: Top-ranking treatment trains for treating municipal wastewater and secondary effluents to comply with Moroccan regulations based on cost (C1-C3) and weights (W1-W3) ... 128 Table 63: Top-ranking treatment trains for treating municipal wastewater and secondary effluents to comply with Egyptian regulations based on cost (C1-C3) and weights (W1-W3) ... 128 Table 64: Top-ranking options for treating municipal wastewater and secondary effluents to comply
with Tunisian regulations based on cost (C1-C3) and weights (W1-W3) ... 129 Table 65: List of all strategies developed from section 3 ... 130
1
1. Introduction
In a period, where many areas worldwide are experiencing droughts and water stress, particularly in the Middle East and North African (MENA) region (figure 1) with continuously decreasing ground water level, water reuse has received growing attention (World Resources Institute 2019). Subsequently there is need for technologies and strategies that can foster the implementation of most adapted technologies and solutions. A main incentive for water reclamation1 is the use of treated wastewater as a water resource for beneficial purposes,
because it can partly substitute the abstraction of fresh surface or groundwater. A sub-incentive is that wastewater is not discharged to receiving environments, thus reducing pollution of water bodies.
figure 1: The Middle East and North Africa is the most water-stressed region on earth. (World Resources Institute 2019)
“Twelve out of the 17 most
water-stressed countries are in the Middle East and North Africa (MENA). The region is hot and dry, so water supply is low to begin with, but growing demands have pushed countries further into extreme stress. Climate change is set to complicate matters further: The World
Bank found that this region has the greatest expected economic losses from climate-related water scarcity, estimated at 6-14% of GDP by 2050. Yet there are untapped opportunities to boost water security in MENA. About 82% of the region’s wastewater is not reused; harnessing this resource would generate a new source of clean water.”
(World Resources Institute 2019)
The general objective of the MADFORWATER project is to develop integrated technological and management solutions to boost wastewater treatment and treated wastewater efficient reuse for irrigation in selected hydrological basins in Egypt, Morocco and Tunisia. In particular, Work Package (WP) 5 ‘’ Strategies and economic instruments for basin-scale water resources management’’ aims to develop strategies for wastewater management, water reuse and
1 Water or wastewater reclamation is the process of treating wastewater to turn it into water that can be
used for beneficial purposes. Water reuse refers to the beneficial use of reclaimed water (the ‘fit-for-purpose’ concept)(WWDAP (United Nations World Water Assessment Programme) 2017).
2 water & land management in agriculture, tailored to the three studied basins. This WP will make use of two decision support tools (DSTs) to support the development of strategies and economic instruments for wastewater management and water & land management in agriculture. In this deliverable 5.2, the wastewater management strategies and the strategies for water management in agriculture are developed separately. The proposed two types of strategies will then be combined into basin-scale integrated water & land management strategies in the upcoming deliverable 6.1.
This deliverable is organized as follows: in chapter 2, the elaboration of wastewater management strategies for the three selected basins. In this chapter, we aim to develop an assessment for water reclamation and reuse and establish exemplary basin-scale strategies that include economic instruments and other measures to foster implementation. This assessment consists of three objectives, namely A) applying a decision-support tool (DST) for water reclamation potential for municipal wastewater, B) applying a DST for simulating and estimating lifecycle costs of project-related technologies for water reclamation, and C) assessing the national-level conditions for water reuse with a multi-criteria decision analysis (MCA) to identify drivers and barriers. This MCA consists of six thematic subjects, namely policy and institution, economy, society, water management, legislation and environment. In this research, wastewater reclamation is defined as cleaning of wastewater to a purity that can be used for specific purposes. Wastewater reuse is defined as beneficial use of treated wastewater (Asano, Burton, and Leverenz 2007).
This analysis was applied to three countries in Middle East and North Africa (MENA), which are Egypt, Tunisia, and Morocco. Safeguarding water security in these countries is challenging and each country faces specific water management concerns.
Egypt has been suffering from severe water scarcity in recent years. Renewable freshwater resources include only 20 cubic meters per person per year. As a result, the country relies heavily on the Nile River for its main source of water. Egypt is already below the United Nations’ water poverty threshold, and by 2025 the UN predicts, it will be approaching a state of “absolute water crisis”. (Eco Mena 2017; The Guardian 2015).
Tunisia’s water resources are characterized by scarcity and pronounced seasonal and yearly variations. Furthermore, the country is subject to periodic droughts of various lengths. The most common drought years have rainfall deficits ranging from 30% to 50%. Over the last decade, Tunisia has achieved considerable success in expanding access to both water and sanitation services, but challenges remain (Ameur 2007; World Bank 2014a).
Morocco is among the 45 countries facing water scarcity. It is confronted with dwindling groundwater reserves and a strong dependence on rain-fed agriculture. Cultivable land is compromised, because of water shortages and soil erosion (Morocco World News 2017; USAID 2017; Espace Associatif 2012). To overcome this problem, several laws and regulations were adapted to improve the availability and quality of water resources (Choukr-allah et al. 2017).
Chapter 3 is devoted to the elaboration of sustainable water and land management strategies in agriculture for the three selected basins. The proposed strategies take into account the multifaceted perspective of the water and agricultural sectors considering technological, economic, social, environmental, institutional, and governance aspects. In addition, they take into account the increased amount of water obtained from improved water reuse and the implementation of efficient irrigation technologies. In this chapter, three scenarios characterized by different inputs are considered; the water availability scenario considering
3 an increase in water availability obtained from treated wastewater reuse as well as the decrease in fertilizer requirement (due to high levels of organic matter in treated WW), the technology scenario considering the MADFORWATER new irrigation technology and the policy scenario by applying different economic instruments for water management such as water pricing, water quotas, subsidies, taxes, etc. The results of these scenarios are compared with the baseline scenario.
Concluding remarks are finally presented in chapter 4.
2. Strategies and economic instruments for WW management (Task 5.2:
FHNW)
2.1. Methodology: Development of a DST for the establishment of WW management strategies
2.1.1. Local adaptation of a decision support tool for water reclamation The assessment presented in this deliverable is based on an open access pre-feasibility DST for water reuse (Oertlé et al. 2019). The DST’s purpose is to identify technology options that can treat wastewater to the desired quality for several representative case studies. The user has to provide information about the wastewater to be reclaimed (i.e. quality parameters and quantity), the desired reclaimed water quality (i.e. from a set of national regulations and international guidelines), and local cost information. The DST automatically proposes top ranking technology options from a database of benchmark treatment trains (series of unit processes) based on lifecycle treatment costs or based on a weighting profile defined by the user. It currently encompasses 37 units processes combined into 70 benchmark treatment trains. The detailed description of the DST is presented in a dedicated publication (Oertlé et al. 2019). The DST focuses on the pre-feasibility stage and considers potential water reuse schemes in a systemic approach schematically (Figure 2). This allows determining if an identified area with potential for water reuse could lead to a feasible reclamation scheme with current resources, technologies and available information.
Figure 2: Water reuse for pre-feasibility in a systemic approach: (1) wastewater for reuse, (2) type of intended reuse, (3) identification and assessment of technology.
It would be too extensive to describe in details the DST in this deliverable and most of it has already been published. For more information on the content of the DST, its mode of
4 calculation and data included, please refer to the following open-access publication and datasets:
Publication with detailed description of the DST (Oertlé et al. 2019).
Externally hosted supplementary file 1, Oertlé, Emmanuel. (2018, December 5). Poseidon - Decision Support Tool for Water Reuse (Microsoft Excel) and Handbook (Version 1.1.1). Zenodo. http://doi.org/10.5281/zenodo.3341573
Externally hosted supplementary file 2, Oertlé, Emmanuel. (2018). Wastewater Treatment Unit Processes Datasets: Pollutant removal efficiencies, evaluation criteria and cost estimations (Version 1.0.0) [Data set]. Zenodo.
http://doi.org/10.5281/zenodo.1247434
Externally hosted supplementary file 3, Oertlé, Emmanuel. (2018). Treatment Trains for Water Reclamation (Dataset) (Version 1.0.0) [Data set]. Zenodo.
http://doi.org/10.5281/zenodo.1972627
Externally hosted supplementary file 4, Oertlé, Emmanuel. (2018). Water Quality Classes - Recommended Water Quality Based on Guideline and Typical Wastewater Qualities (Version 1.0.2) [Data set]. Zenodo. http://doi.org/10.5281/zenodo.3341570 For this research, the DST has been adapted to the specific cases of Egypt, Morocco, and Tunisia, by including data and information in the tool. Data were collected in a literature research on typical wastewater qualities, national regulations on water quality requirements for the compliance with different types of reuse, and local cost factors (see Table 58 and Table 59). Such factors include energy cost, personal cost and discount rates (i.e., interest minus inflation rate). The whole set of collected data and the resulting DST is presented in supplementary materials of this deliverable and has been uploaded to an open access repository (Oertlé 2018a).
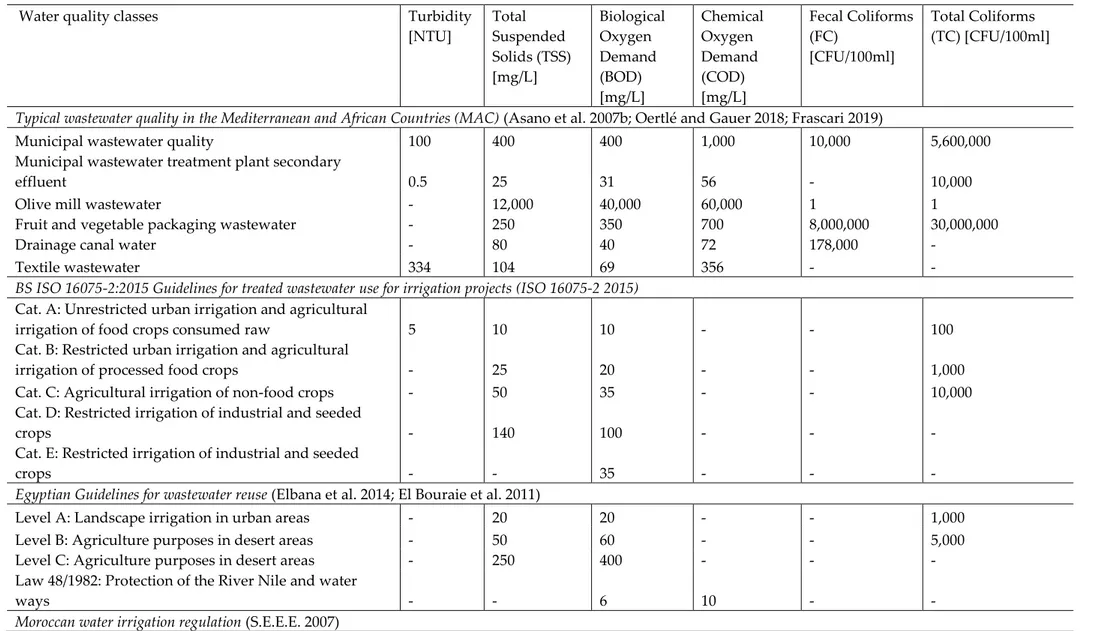
To conduct a generic assessment for the three countries, typical wastewater quality classes in the Mediterranean and African Countries (MAC) have been established based on collected local data and complemented with values from literature (Asano, Burton, and Leverenz 2007) (Table 1). Specific contaminants from industrial wastewaters are not included in Table 1 (i.e. polyphenols, fungicides, dyes) but should be considered when designing treatment trains treating industrial wastewater. Furthermore, national regulations for wastewater reuse and irrigation are considered together with ISO guidelines, as the achievable water quality targets for the reclaimed water to be compliant.
5 Table 1: Typical wastewater qualities and guidelines for wastewater reuse (‘-‘stands for ’no data available‘ or ’not defined’)
1
Water quality classes Turbidity
[NTU] Total Suspended Solids (TSS) [mg/L] Biological Oxygen Demand (BOD) [mg/L] Chemical Oxygen Demand (COD) [mg/L] Fecal Coliforms (FC) [CFU/100ml] Total Coliforms (TC) [CFU/100ml]
Typical wastewater quality in the Mediterranean and African Countries (MAC) (Asano et al. 2007b; Oertlé and Gauer 2018; Frascari 2019)
Municipal wastewater quality 100 400 400 1,000 10,000 5,600,000
Municipal wastewater treatment plant secondary
effluent 0.5 25 31 56 - 10,000
Olive mill wastewater - 12,000 40,000 60,000 1 1
Fruit and vegetable packaging wastewater - 250 350 700 8,000,000 30,000,000
Drainage canal water - 80 40 72 178,000 -
Textile wastewater 334 104 69 356 - -
BS ISO 16075-2:2015 Guidelines for treated wastewater use for irrigation projects (ISO 16075-2 2015)
Cat. A: Unrestricted urban irrigation and agricultural
irrigation of food crops consumed raw 5 10 10 - - 100
Cat. B: Restricted urban irrigation and agricultural
irrigation of processed food crops - 25 20 - - 1,000
Cat. C: Agricultural irrigation of non-food crops - 50 35 - - 10,000
Cat. D: Restricted irrigation of industrial and seeded
crops - 140 100 - - -
Cat. E: Restricted irrigation of industrial and seeded
crops - - 35 - - -
Egyptian Guidelines for wastewater reuse (Elbana et al. 2014; El Bouraie et al. 2011)
Level A: Landscape irrigation in urban areas - 20 20 - - 1,000
Level B: Agriculture purposes in desert areas - 50 60 - - 5,000
Level C: Agriculture purposes in desert areas - 250 400 - - -
Law 48/1982: Protection of the River Nile and water
ways - - 6 10 - -
6
Water quality classes Turbidity
[NTU] Total Suspended Solids (TSS) [mg/L] Biological Oxygen Demand (BOD) [mg/L] Chemical Oxygen Demand (COD) [mg/L] Fecal Coliforms (FC) [CFU/100ml] Total Coliforms (TC) [CFU/100ml]
Cat A: Irrigation of crops to be eaten raw - 100 - - 1,000 -
Cat B & C: Irrigation of other crops - 100 - - - -
Tunisian guidelines for wastewater reuse (WHO 2006; Food and Agricultural Organisation of the United Nations 2013)
NT 106.03 standard: Irrigation - 30 30 90 - -
Norm 106.03 revised, Cat I: Agriculture use - - - - - -
Norm 106.03 revised, Cat II: Golf places, urban parcs,
green zones - - - - 1,000 -
Norm 106.03 revised, Cat III: Infiltration of groundwater
for agricultural use 5 - 20 125 1,000 -
7 2.1.2. Definition of representative case studies
The application of the DST to the Egyptian, Moroccan and Tunisian contexts follows two main approaches, A and B (see Table 2). The first approach (A) consists of identifying treatment trains that could treat typical municipal wastewater and secondary effluent of municipal wastewater treatment plants to a quality level that complies with ISO guidelines and with national regulations on treated wastewater reuse. The identified treatment trains are then ranked based on cost of treatment and the defined weighting profile (see Table 60 and Table 61). The second approach (B) consists of simulating treatment trains originating from the MADFORWATER project (www.madforwater.eu) and calculating corresponding lifecycle treatment costs for different flow rates in the three target countries. The DST was applied to every defined case study (Figure 3).
Table 2: Case studies considered for the assessments A and B
A. Municipal wastewater Purpose: identify treatment trains compliant with international and national regulations
Typical municipal
wastewater quality (MWW)
10,000 [m3/d]
ISO Guidelines (16075-2:2015) Cat. A: Unrestricted urban irrigation and agricultural irrigation of food crops consumed raw, Cat. B: Restricted urban
irrigation and agricultural irrigation of processed food crops, and Cat. C: Agricultural irrigation of non-food crops.
Egyptian, Moroccan, and Tunisian regulations for wastewater reuse.
Typical municipal
wastewater treatment plant secondary effluent (MWW-Eff)
10,000 [m3/d]
B. Specific wastewater and
corresponding treatment trains (TT)
Purpose: calculate lifecycle treatment costs for a selected series of unit processes
Drainage canal water (DCW-TT)
1,000
[m3/d] Anaerobic stabilization ponds, constructed wetland
Fruit and vegetable packaging plant (FVPWW-TT)
200 [m3/d] Activated sludge, flocculation, activated carbon,
ultraviolet disinfection Municipal wastewater
(MWW-TT)
10,000 [m3/d]
Trickling filter with secondary sedimentation, sedimentation without coagulant, constructed wetland, chlorine dioxide, equalization basin Olive mill wastewater
(OMW-TT) 100 [m
3/d] Microfiltration, ion exchange
Textile wastewater
(TWW-TT) 200 [m
3/d]
Flocculation, sedimentation without coagulant, low loaded activated sludge with denitrification and secondary sedimentation
8 Figure 3: Application of the decision support tool (i.e. Poseidon)
2.1.3. Assessment of national-level conditions for water reuse
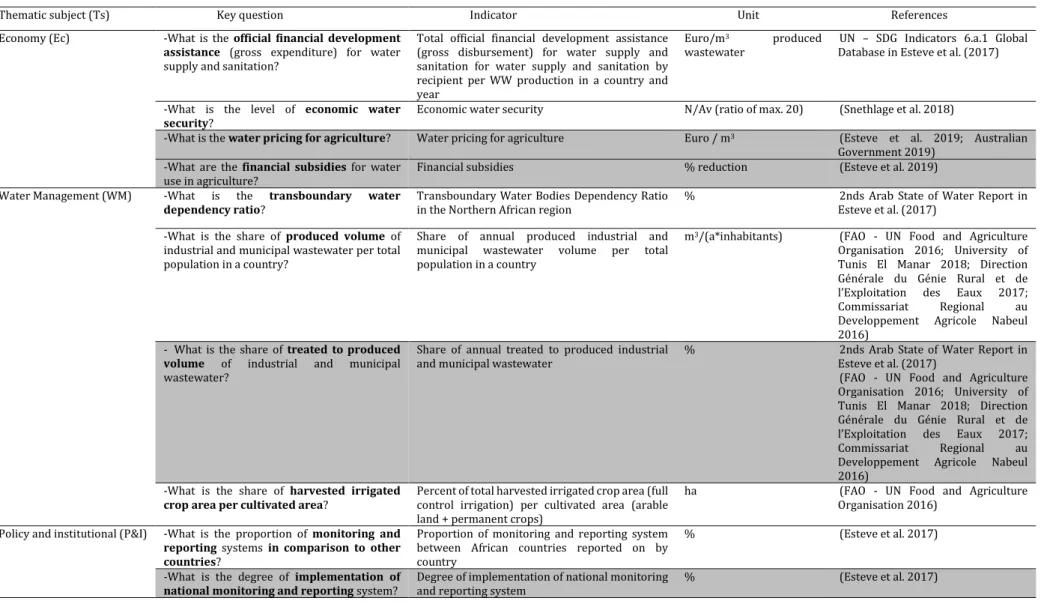
This MCA consists of six thematic subjects, namely economy, water management, policy and institution, legislation and environment. Each thematic subject is described by two to four key questions. These in turn are underpinned by one quantitative or semi-quantitative indicator (Table 3 for overview; Table 55 for details in supplementary materials). Collectively, these indicators provide an indicative general understanding of the current situation of water reuse in Egypt, Tunisia, and Morocco and are selected on the basis of existing indicators, which were scanned from major water reuse studies and recognised databases (Esteve et al. 2017; Snethlage et al. 2018; FAO - UN Food and Agriculture Organisation 2016). The analysis was also applied to Australia. The reason for integrating Australia is its function as a benchmark country with well-established water reuse practices (Asian Development Bank 2017).
To develop a hands-on DST, we developed a twofold investigation of the MCA. First a simplified statement is provided by answering 7 selected key questions that are underpinned by one quantitative or semi-quantitative indicator (highlighted in grey in Table 3). Second for an “expert” (detailed) investigation, in the DST we provide all key questions and the subsequent quantitative or semi-quantitative indicator (Table 3).
The indicator results were classified as ‘lower’ = 1, ‘moderate’ = 2, and ‘higher’ = 3 (see Table 56 in supplementary materials). For the indicator results, a linear ranking was applied if possible. This included for ‘lower’: 0 – 33.3%, ‘moderate’: >33.3 – 66.6%, and ‘higher’: 66.6 – 100% based on (BGS 2015; Oakdene Hollins 2008). The terms ‘lower’ and ‘higher’ were applied, because the connotation of these terms better describe the involved data uncertainty than the connotation of ‘low’ and ‘high’.
Four indicators were scored for the assessment of the countries Egypt, Tunisia, Morocco, and Australia in this research only. Therefore, for each of these four indicators, the maximum water reuse level was assigned as the maximal value. The minimum water reuse level was assigned to the minimal value. In between these maximum and minimum, a linear ranking of thirds was determined. This was applied to the indicators, namely: ‘Water pricing for agriculture’, ‘Financial subsidies’, ‘Percent of annual produced water volume per total
9 population in a country’, and ‘Percent of total harvested irrigated crop area (full control irrigation) per cultivated area (arable land + permanent crops)’. Due to lack of data, the indicator ‘Social acceptance in a country towards the water reclamation for agriculture’ could not be scored. We are establishing this indicator in ongoing research activities. Currently, we assumed that the indicators are equally weighted; this assumption will be tested in our future research activities.
10
Table 3: Description of the thematic subjects, key questions, quantitative and semi-quantitative indicators with possible data sources. The grey highlighted cells are used in
the DST in the simplified investigation. N/Av stands for ‘not available’.
Thematic subject (Ts) Key question Indicator Unit References
Economy (Ec) -What is the official financial development
assistance (gross expenditure) for water
supply and sanitation?
Total official financial development assistance (gross disbursement) for water supply and sanitation for water supply and sanitation by recipient per WW production in a country and year
Euro/m3 produced
wastewater Database in Esteve et al. (2017) UN – SDG Indicators 6.a.1 Global
-What is the level of economic water
security? Economic water security N/Av (ratio of max. 20) (Snethlage et al. 2018)
-What is the water pricing for agriculture? Water pricing for agriculture Euro / m3 (Esteve et al. 2019; Australian
Government 2019) -What are the financial subsidies for water
use in agriculture?
Financial subsidies % reduction (Esteve et al. 2019)
Water Management (WM) -What is the transboundary water
dependency ratio? Transboundary Water Bodies Dependency Ratio in the Northern African region % Esteve et al. (2017) 2nds Arab State of Water Report in -What is the share of produced volume of
industrial and municipal wastewater per total population in a country?
Share of annual produced industrial and municipal wastewater volume per total population in a country
m3/(a*inhabitants) (FAO - UN Food and Agriculture
Organisation 2016; University of Tunis El Manar 2018; Direction Générale du Génie Rural et de l’Exploitation des Eaux 2017; Commissariat Regional au Developpement Agricole Nabeul 2016)
- What is the share of treated to produced
volume of industrial and municipal
wastewater?
Share of annual treated to produced industrial
and municipal wastewater % Esteve et al. (2017) 2nds Arab State of Water Report in (FAO - UN Food and Agriculture Organisation 2016; University of Tunis El Manar 2018; Direction Générale du Génie Rural et de l’Exploitation des Eaux 2017; Commissariat Regional au Developpement Agricole Nabeul 2016)
-What is the share of harvested irrigated
crop area per cultivated area? Percent of total harvested irrigated crop area (full control irrigation) per cultivated area (arable land + permanent crops)
ha (FAO - UN Food and Agriculture
Organisation 2016) Policy and institutional (P&I) -What is the proportion of monitoring and
reporting systems in comparison to other countries?
Proportion of monitoring and reporting system between African countries reported on by country
% (Esteve et al. 2017)
-What is the degree of implementation of
11
Legislation (L) - What is the quality of contract
enforcement, property rights, and the courts in each country?
World governance index, rule of law % (Kaufmann, Kraay, and Mastruzzi
2010) - What is the regulation for food and non-food
crop irrigation with reclaimed water? Compliance for food and non-food crop irrigation with reclaimed water ranking: yes, partly, no 2018), and intended stakeholder Own development, and (Mueller survey by Mueller et al. (2019)
Society (S)
including public involvement in the decision making processes
-What is the degree of implementation of
equitable water and wastewater tariffs?
Degree of implementation of equitable and efficient water supply and wastewater tariffs
% 2nds Arab State of Water Report in Esteve et al. (2017)
-What share of population is using improved
sanitation services?
Share of using improved sanitation services % UN – SDG Indicator Global Database SDG 6.2.1 in Esteve et al. (2017) -What is the social acceptance of a country
towards water reuse for agriculture? Social acceptance in a country towards the water reuse for agriculture N/Av Mueller et al. (2019) Intended stakeholder survey by Environment (En) -What is the status of national water reuse
regulations for irrigation in comparison with
the international BS ISO 16075-2: 2015 water quality guideline?
Compliance of national water reuse regulations for irrigation in comparison with the BS ISO 16072-2:2015 water quality guideline
ranking: higher, moderate,
lower 2018), and intended stakeholder Own development, and (Mueller survey by Mueller et al. (2019) -What is the share of the area equipped for
12 2.1.4. Resulting DST – DST for Water Reclamation beyond Technical
Considerations
The two above mentioned assessments were combined into one standalone DST that allows potential users to establish water reclamation strategies at a pre-feasibility stage. The existing technological WW treatment DST (described under 3.1.1) was taken as a basis and extended by the national-level multi-criteria assessment (MCA). The underlying technological data (unit processes, treatment trains, etc.) therefore correspond to the descriptions under 2.1.1. Concerning the national-level MCA, an expert and simplified version of the results has been developed (3.1.3). The DST itself will be delivered as Deliverable 5.3 of the MADFORWATER project. In addition, it will be uploaded on an open-access repository. The following ‘Guided tour’ is intended to give an overview of the combined DST from a user’s perspective:
A. Guided steps:
The tool consists of 4 main steps: (1) learn, (2) input data, (3) analyse solutions, and (4) summary (Figure 4). Firstly, the user should select the country to be assessed and a corresponding currency. This information is mainly required to display the correct national-level MCA results at the end. For example, the user can select “Tunisia and Tunisian dinar” or “Tunisia and US dollar”.
B. STEP 1: Learn
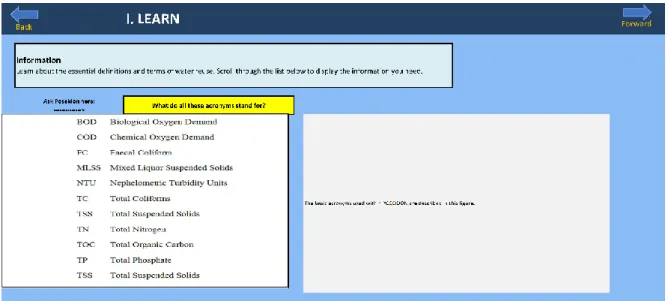
The user can, depending on his existing knowledge, inform himself about the essential underlying concept and definitions, the processes and the different water qualities by Figure 4: DST Guided Steps
13 means of a list (marked yellow). For example, the user can learn about ‘primary treatment’ and what it means in the context of WW treatment (Figure 5).
Figure 5: Learn - Essential information about the water reuse concept, underlying processes, definitions and terms. C. STEP 2: Input Data
C.1. Water inflow quality and quantity
The user can choose between two alternatives to enter his wastewater quality inflow (Figure 6).
i. Either the user chooses from predefined water quality inflow data or ii. defines his own water quality parameters.
If the user decides to use predefined water quality inflow data (defined as II.A.1), in the first step the user has to select a water quality from a given list (e.g. wastewater), and then in the second step specify the chosen water quality, also on the basis of a given list (e.g. typical untreated domestic wastewater).
However, if the user decides to enter his own water quality parameters, he can enter his own parameters accordingly in section II.A.2.
Additionally, the user must specify the inflow water quantity. The user can choose between three options (serviced population, average flow or peak flow). For example, the user selects ‘serviced population’ as the unit and enters’10,000 people’ as the amount.
14 C.2. Water outflow quality/ regulations
The user must specify the desired water outflow quality according to the national regulation standards. The water quality regulation or guideline chosen defined the required water quality to be attained after water reclamation to be compliant. Firstly, the number of end-users the user wants to supply needs to be defined in order to compare up to three different options (in case of several end-users). Secondly, the water quality and the corresponding water quality class (regulation) must be selected for each user. Additionally, a foreseen water tariff can be entered for each end-user.
At the lower end, the selected inflow water quality values are displayed under point three to provide a comparison between the required water quality values under point four. The comparison provides the user with an overview whether certain water quality parameter values already comply with the selected regulation standards or not. This is illustrated by color markings (red = treatment necessary; green = compliant) (Figure 7).
15 C.3. Distribution & storage costs
The user can enter data about distribution and storage costs (if available) or otherwise enters data about the need of storage and distribution pipelines. The distribution parameters (to the user’s plant, as well as out of the plant) can be specified under point one and three. It is required to enter the type of land use where to transport wastewater is planned, the length of the pipeline and the elevation to be overcome (Figure 8).
Figure 7: Water outflow quality entry
16 C.4. Weighting the relative importance of different parameters
This step has been added in order to include qualitative options adapted to local environmental, economic, and social conditions. The user can either choose to weight each parameter separately or select from predefined weighting profiles, for instance the ‘only power demand’-profile. This ‘Evaluation Profile’ intends to provide the user with the possibility to evaluate WW treatment strategies not only based on meeting quality requirements (for further explanation, see ANALYZE SOLUTIONS). (Figure 9)
D. STEP 3: Analyse solutions D.1. Technological results
The user can now distinguish between two criteria on the basis of which the analysis is carried out.
i. Either the user defines the cost of the strategies as the criterion or ii. the weighting profile defined by the user him-/herself
The three top-ranking WW management options are subsequently displayed according to the criteria chosen (see Figure 10). Both the individual treatment costs and the distribution costs of the respective options can be compared. In addition, the cost-revenue value is calculated, which includes the foreseen water tariff. Furthermore, the user is provided with additional information on the treatment trains, unit processes, as well as detailed information on the cost values and calculations.
17 D.2. Qualitative national-level assessment results
Moreover, the user must decide how to display the results of the national-level assessment. It can be chosen between a simplified or an expert view. Since the results of the national-level assessment are very detailed, a simplified view has been added (see table 3) due to the different background knowledge of the users (see Figure 11).
The numerical results were normalized to a scoring between 1 (orange; lower ranked), 2 (yellow; moderate ranked), and 3 (green; higher ranked). The detailed results have been aggregated to provide an overall statement of each thematic subject. Consequently, the Figure 10: Technological results
18 average scoring result can be taken as an indicator for the thematic subject for which measures should be taken most urgently.
E. STEP 4: Summary
The summary at the end serves as an overview for the user. The user should select one of the top-ranked WW strategies per end-user. Consequently, the costs of the corresponding strategies are displayed and compared with the expected country-specific water tariffs (obtained from the national-level assessment). In addition, the national-level MCA results are presented again in abbreviated form and supplemented with potential measures to tackle single specific thematic subjects of water reuse. (Figure 12)
Figure 12: Summary of resulting wastewater management strategies Figure 11: National-level MCA results
19 2.1.5. Economic instruments applied in water management in the agricultural
sector
Economic instruments are used to add economic value to water in order to justify the need for the rational allocation of water as a scarce resource. There exist a variety of economic instruments that can be used in water management. In this section, we present a brief overview of the most usually applied instruments. In general, two different types of instruments can be distinguished. Firstly, the quantity-based instruments, where the quantity of water is limited and thus, if trade is permitted, a price is established through the trade market. Secondly, the price-based instruments, where the price is directly or indirectly influenced by instruments (e.g. increase through taxes or decrease through subsidies). Another not-classifiable instrument related to water management is the insurance instrument.
20 Table 4 gives an overview about the main types of instruments and their differences, supplemented by examples. The source of this economic instruments bases on the Deliverable 5.1 from the H2020 MADFORWATER project (MADFORWATER Project 2018).
21
Table 4: Economic instrument overview (MADFORWATER Project 2018)
Type of instrument Examples
Price-based instruments
P1: Pricing/ water tariffs
P2: Subsidies or other financial assistance (e.g. assisted loans)
P3: Taxes
Quantity-based instruments Q1: Quotas (command-and-control)
Q2: Water markets/ water trading
Non-classified instruments N1: Insurance
P1: Pricing/ water tariffs
Pricing is currently one of the most important economic tools in water management. Water prices are not usually set in market environments due to several issues (see MADFORWATER Project 2018 for further explanation) and therefore are usually subject to public intervention by means of the implementation of regulation and control from government and public administrators such as pricing schemes. Pricing schemes such as water tariffs can be distinguished in two main categories: Non-volumetric (do not depend on the actual amount consumed) and volumetric (a variable amount is charged according to the volume of water consumed). Non-volumetric pricing displays the advantage of being easy to implement, as only data about farm size, input, output, type of crop or time of use is needed. However, they do not usually provide much incentives for saving water and installing efficient equipment, as the charge does not vary with consumption. On the other hand, volumetric pricing is able to promote a better allocation of the resource, but it is more complex to manage, and it requires the installation of meters able to measure actual consumption (Dudu and Chumi 2008). P2: Subsidies or other financial assistance (e.g. assisted loans)
Subsidies are a form of financial aid or support usually with the aim of promoting economic, environmental or social goals. Financial assistance and subsidies usually come in various ways, including: direct forms (cash grants, interest-free or low-interest loans,…) and indirect (reduced regulation, tax breaks, rent rebates…).
In the agricultural sectors, financial assistance may have different objectives, such as providing a stable income to farmers -e.g. cash transfers- (Rey et al. 2018) or promoting incentives to install efficient modern irrigation systems -e.g. subsidized loans, rebate programs- (Thivet and Fernandez 2012). However, in practice, their contribution to achieving the objectives expected from water policy is not clear and they have been found to usually harm cost recovery (Rey et al. 2018).
P3: Taxes
Water taxes are levies or charges on water use directed at achieving a specific target (environmental, economic or social goals). They are useful in the sense that they can help to address market failures by internalizing the true cost of depleting the resource, with their functioning being very similar to other charges such as prices. Some examples of taxes related to agricultural water management are groundwater abstraction charges (in which a tax is
22 imposed on each cubic meter reflecting the cost of depleting aquifers) or effluent taxes (used to reduce point source pollution).
Q1: Quotas (command-and-control)
Quotas are based on providing farmers with the entitlement to a certain limited amount of water, which may be defined in absolute terms or according to several criteria (Van Den Berg et al. 2016). They might be useful to control the maximum demand that will be available, and they are equitable in the sense that water is allocated according to objective criteria, although they are less flexible than other methods such as water markets (Government of Canada 2005).
Q2: Water markets/ water trading
They can be defined as an institutional framework to trade water rights in a temporary or permanent way in exchange for pecuniary compensation (Rey et al. 2018). As with quotas, they offer the advantage to allow regulators to control the total amount of water that is abstracted. Moreover, in a competitive setting, markets would allow to reallocate water to its highest value use, thus promoting efficiency (Government of Canada 2005). Therefore, they are considered by some authors as a cost-efficient mechanism (Escriva-Bou, Pulido-Velazquez, and Pulido-Velazquez 2017). However, in practice water markets may end up operating in monopoly conditions (Government of Canada 2005) and sometimes local economies may be harmed (Doherty and Smith 2012). Therefore, a proper regulatory framework that stablishes clear guidelines for the design and implementation of water market has been found key for a correct functioning (Wheeler et al. 2017) and for the success of water markets.
N1: Insurance
Insurance is an economic instrument in which a person or entity (insurer) covers a potential loss of other agent (the insured) in exchange for guaranteed and relatively small payments. It is therefore a form of protection from financial and risk-contingent losses. In the case of agricultural water management, crop insurance protects for the effects of droughts, offering farmers a compensation for the loss in production. Since it has been found that water deficits during droughts usually lead to illegal abstractions (Pérez-Blanco and Gómez, 2014), crop insurance could prove a useful instrument to avoid aquifer overdraft.
2.2. Application of the DST and assessment of national-level conditions for water reuse
2.2.1. Assessment of potential for municipal wastewater reuse in agriculture
For every considered case study, treatment trains that comply with the water quality requirements of the ISO guidelines were identified. For all considered case studies, the results include the top-ranking option considering the cost (i.e., C1) and the top-ranking option considering the weighted evaluation factors (i.e., W1). Those results are a good indication of the potential for water reuse and possible treatment trains. However, this is a simplified pre-feasibility assessment with limitations, as it is only based on the parameters defined in the
23 DST. Additional parameters currently not considered should be included in future feasibility studies.
Nevertheless, the results show that there are available technologies that could treat typical Egyptian, Moroccan, and Tunisian municipal wastewater and secondary effluent of municipal wastewater treatment plants to fully comply with international standards. Identified options ranked according to costs have a lifecycle treatment cost ranging between 0.22-0.97 USD per cubic meter for reclaimed water. Thus, these options provide reclaimed water at an affordable cost.
Table 5: Top-ranking treatment trains based on cost (C1) and weights (W1) for treating municipal wastewater and secondary effluent to comply with ISO guidelines and lifecycle treatment costs in Egypt, Morocco and Tunisia
Ranking Egypt [USD/m3] Morocco [USD/m3] Tunisia [USD/m3]
Cat. A: Unrestricted urban irrigation and agricultural irrigation of food crops consumed raw
Typical municipal wastewater quality (MWW)
C1-‘Title 22: Belgium’ 0.97 0.59 0.52
W1-‘Only disinfection Benchmark
Technology’ 1.19 0.68 0.65
Typical municipal wastewater treatment plant secondary effluent (MWW-Eff)
C1-‘Lagooning: Australia’ I 0.39 0.23 0.22
W1-‘Wetlands: Spain’ 1.01 0.59 0.56
Cat. B: Restricted urban irrigation and agricultural irrigation of processed food crops
Typical municipal wastewater quality (MWW)
C1-‘Wetlands: USA’ 0.80 0.44 0.42
W1-‘Only disinfection Benchmark
Technology’ 1.19 0.68 0.65
Typical municipal wastewater treatment plant secondary effluent (MWW-Eff)
C1-‘Lagooning: Australia’ I 0.39 0.23 0.22
W1-‘Wetlands: Spain’ 1.01 0.59 0.56
Cat. C: Agricultural irrigation of non-food crops
Typical municipal wastewater quality (MWW)
C1-‘Wetlands: USA’ 0.80 0.44 0.42
W1-‘Wetlands: Spain’ 1.01 0.59 0.56
Typical municipal wastewater treatment plant secondary effluent (MWW-Eff)
C1-No treatment 0.00 0.00 0.00
W1-No treatment 0.00 0.00 0.00
Identified treatment trains presented in Table 5 are based on a list of 70 treatment trains included in the DST (Oertlé 2018b). These are mostly based on typical benchmark technologies and on case studies from around the world. Results show that five treatment trains highly ranked in the assessment have a high potential for the defined case studies: Title 22: Belgium: Example from Belgium re-using water to produce cooling water for
industrial purposes. A pharmaceutical company (Tienen) makes use of treated municipal wastewater for cooling water. Thereby, secondary treated effluent is ozonated for disinfection. If the amount of reclaimed wastewater is too low or temperature is too high, it is mixed with groundwater before usage. The wastewater treatment plant (WWTP)
24 consists of a low loaded activated sludge system with enhanced biological phosphorous removal (Davide Bixio, Wintgens, and Bixio 2006).
Only disinfection Benchmark Technology: Many examples are available all over Europe. Conventional wastewater treatment, followed by chlorination, enabling the reuse of the treated water for irrigation under restricted conditions (Van Der Graaf et al. 2005). Lagooning Australia: Example from Australia of water reclamation for horticultural
(unrestricted) irrigation. WWTP effluents are reused for horticultural irrigation. Main irrigated crops are root and salad crops, brassicas, grapes and olives (= unrestricted irrigation). Sewage is treated in the WWTP by activated sludge process. The effluents from secondary treatment are then held in shallow aeration lagoons for a minimum of 6 weeks, before passing through a dissolved air flotation and dual media filtration process at the water reclamation plant. Here, the effluents discharge to balancing storage via a chlorinator before being pumped into the pipeline for horticultural irrigation distribution (Davide Bixio, Wintgens, and Bixio 2006).
Wetlands Spain: Example from Spain with the goals to feed water of sufficient quality to the Cortalet lagoon in a Natural Reserve and to stimulate the recovery and establishment of local flora and fauna. The WWTP is of the extended aeration type and consists of a mechanical pre-treatment step and then two parallel treatment lines, each comprising a biological reactor, a clarifier and three effluent polishing ponds. There is also a chemical treatment for phosphorus removal. Further treatment is achieved by means of a wetland system (3 parallel cells) (Davide Bixio, Wintgens, and Bixio 2006).
Wetlands USA: Treated effluent from Arcata WWTP (California, USA), is discharged into ‘enhancement wetlands’, which are part of the Arcata Marsh and Wildlife Sanctuary. The first treatment steps at the Arcata WWTP consist of bar screens, a grit chamber and two settling tanks for primary treatment. Secondary and partial tertiary treatment is accomplished by two oxidation ponds followed by three parallel FWS (Free water surface) wetlands that were constructed in 1985. After chlorination and de-chlorination, part of the wastewater is released while another part flows into three so-called ‘enhancement FWS wetlands’. The ‘enhancement wetlands’ together with some additional landscape features, are referred to as the Arcata Marsh and Wildlife Sanctuary (Davide Bixio, Wintgens, and Bixio 2006).
For the national regulations of Egypt, Morocco and Tunisia, treatment trains were also identified for all simulated case studies (
25
Table 6). If limitations also apply to the results, they show that there are available technologies that could treat typical Egyptian, Moroccan, and Tunisian municipal wastewater and secondary effluent of municipal wastewater treatment plants to comply with national regulations. Identified options ranked on cost have a lifecycle treatment cost ranging between 0.16-0.80 USD per cubic meter for reclaimed water. Thus, these options provide reclaimed water at an affordable cost.
26 Table 6: Top-ranking treatment trains for treating municipal wastewater and secondary effluents to comply with Moroccan, Egyptian, and Tunisian regulations based on cost (C1) and weights (W1)
Ranking Cost
[USD/m3] Ranking
Cost [USD/m3]
Typical municipal wastewater quality (MWW)
Moroccan Regulation - Cat A: irrigation of crops to be eaten raw
Moroccan Regulation - Cat B & C: irrigation of other crops
C1-‘Wetlands: Nicaragua’ 0.16 C1-‘Wetlands: Nicaragua’ 0.16 W1-‘Wetlands: Spain’ 0.59 W1-‘Wetlands: Spain’ 0.59
Egyptian wastewater reuse regulation - Level A: landscape irrigation in urban areas
Egyptian wastewater reuse regulation - Level B: agriculture purposes in desert areas
C1-‘Wetlands: USA’ 0.80 C1-‘Lagooning: Australia I’ 0.39 W1-‘Only disinfection Benchmark
Technology’ 1.19 W1-‘Wetlands: Spain’ 1.01
Tunisian regulation - NT 106.03 standard: irrigation Tunisian regulation - Norm 106.03 revised, Cat III: infiltration of groundwater for agricultural use
C1-‘Wetlands: Senegal’ 0.37 C1-‘Only disinfection: Chile’ 0.52 W1-‘Wetlands: Spain’ 0.56 W1-‘Wetlands: Spain’ 0.56 Typical municipal wastewater treatment plant secondary effluent (MWW-Eff)
Moroccan Irrigation Regulation - Cat A: irrigation of crops to be eaten raw
Moroccan Irrigation Regulation - Cat B & C: irrigation of other crops
C1-No treatment 0.00 C1-No treatment 0.00
W1-No treatment 0.00 W1-No treatment 0.00
Egyptian regulation - Level A: landscape irrigation in urban areas
Egyptian regulation - Level B: agriculture purposes in desert areas
C1-‘Direct membrane filtration
Benchmark Technology’ 0.40
C1-‘Direct membrane filtration
Benchmark Technology’ 0.40 W1-‘Wetlands: Spain’ 1.01 W1-‘Wetlands: Spain’ 1.01
Tunisian regulation - NT 106.03 standard: irrigation Tunisian regulation - Norm 106.03 revised, Cat III: infiltration of groundwater for agricultural use
C1-‘Wetlands: Nicaragua’ 0.15 C1-‘Wetlands: Nicaragua’ 0.15 W1-‘Wetlands: Spain’ 0.56 W1-‘Wetlands: Spain’ 0.56
27 Table 6 show that four treatment trains in addition to the ones defined before (i.e., Wetlands: Spain, Only disinfection Benchmark Technology, and Lagooning: Australia I) have a high potential for the defined case studies:
Wetlands, Nicaragua: Constructed Wetland in Masaya Pilot Plant Nicaragua. The system is treating the domestic wastewater (100 cubic meters per day) generated by 1,000 people living in the city of Masaya, Nicaragua. The scheme comprises pre-treatment (screen and grit tank) and four constructed wetland beds fed in parallel. The area of each wetland bed is about 350 square meters, totaling 1,400 square meters. Effluent from the pilot plant in Masaya can be used for restricted irrigation (Gauss 2008).
Wetlands, Senegal: Example of water reuse for agricultural purpose from Dakar, Senegal. The main wastewater reuse site in urban agriculture in Dakar is Pikine. Of Pikine’s total cultivated area of approximately 120 acres (50 ha), about 40 acres (16 ha) makes use of raw wastewater for irrigation. Usually, farmers divert wastewater from the sewage using pipes to load narrow wells located in their plot. From that well, they use water cans to irrigate crops such as lettuce, which grow rapidly. Wastewater treatment using wetlands has been introduced which showed good removals of E.coli and helminth eggs. The treatment lines tested used combinations of four ponds (each 2 m3) in series: One waste
stabilization pond followed by three reed or Vetivera planted stabilization ponds with free water surface and surface water flow (US-EPA 2012).
Direct membrane filtration Benchmark Technology: New concept, which is investigated in several places (Netherland, China, Israel). Micro- or Ultrafiltration of raw wastewater followed by agricultural applications (Van Der Graaf et al. 2005).
Only disinfection, Chile: Treatment train of Copiapó Wastewater Treatment Plant. Water re-use in mining industry and agriculture. The wastewater from Copiapó are directed to Copiapó WWTP, where in the first place the WW is subjected to a primary treatment to retain thick solids, then through a secondary treatment to carry out the oxidation of organic matter by activated sludge. The mixture flows to a separation process of solid and liquid in the clarifier, generating a sludge stream and a treated water stream. The water stream is subjected to chlorination and discharged to Copiapó river (Verzandvoort et al. 2013).
2.2.2. Simulation and lifecycle costs of MADFORWATER project treatment trains
The second objective focuses on assessing the selection of treatment trains from the MADFORWATER projects that have been simulated with the DST. The performance of those trains is not known yet, as pilot plants are being implemented in the MADFORWATER project; however, the lifecycle treatment costs have been calculated for different flow rates in the three target countries (Figure 13). Apart from the train focusing on municipal wastewater, the four other WW treatment trains are specifically designed for industrial wastewater (i.e. olive mill wastewater, textile wastewater, and fruit and vegetable packaging wastewater); and for drainage canal water, which is more specifically addressed to the Egyptian case study. Additionally, to lifecycle treatment costs, the simulation with the DST allows to obtain detailed cost information for the different WW treatment trains that can be considered in the decision-making process.
28 Figure 13: Treatment trains lifecycle costs for different flow rates and countries. EG, MO and TU stand for Egypt, Morocco and Tunisia respectively. DCW stands for Drainage Canal Water, FVPWW stands for Fruit and Vegetable Packaging Wastewater, MWW stands for Municipal Wastewater, OMWW stands for Olive Mill Wastewater, and TWW stnads for Textile Wastewater.
![Table 13: Four top-ranking scenarios for water reuse in Morocco based on lowest cost of treatment (treatment of 10,000 [m3/d])](https://thumb-eu.123doks.com/thumbv2/123dokorg/8064309.123670/51.892.104.852.566.901/table-ranking-scenarios-water-morocco-lowest-treatment-treatment.webp)
