11
Carbon, Water and Energy Fluxes
of Terrestrial Ecosystems in Italy
Dario Papale, Mirco Migliavacca, Edoardo Cremonese, Alessandro Cescatti, Giorgio Alberti, Manuela Balzarolo, Luca Belelli Marchesini,
Eleonora Canfora, Raffaele Casa, Pierpaolo Duce, Osvaldo Facini, Marta Galvagno, Lorenzo Genesio, Damiano Gianelle, Vincenzo Magliulo, Giorgio Matteucci, Leonardo Montagnani, Fabio Petrella, Andrea Pitacco, Guenther Seufert, Donatella Spano, Paolo Stefani, Francesco P. Vaccari and Riccardo Valentini
© Springer-Verlag Berlin Heidelberg 2015
R. Valentini and F. Miglietta (eds.), The Greenhouse Gas Balance of Italy, Environmental Science and Engineering, DOI 10.1007/978-3-642-32424-6_2
D. Papale (*) · M. Balzarolo · L. Belelli Marchesini · E. Canfora · P. Stefani · R. Valentini Department for Innovation in Biological, Agro-Food and Forest System (DIBAF), University of Tuscia, Viterbo, Italy
e-mail: [email protected]
M. Migliavacca · A. Cescatti · G. Seufert
Joint Research Centre, Institute for Environment and Sustainability, European Commission, Ispra, Italy
E. Cremonese · M. Galvagno ARPA Valle D’Aosta, Aosta, Italy G. Alberti
Department of Agricultural and Environmental Sciences, University of Udine, Udine, Italy R. Casa
DAFNE, University of Tuscia, Viterbo, Italy O. Facini
IBIMET, CNR, Bologna, Italy L. Genesio · F.P. Vaccari IBIMET, CNR, Florence, Italy D. Gianelle
Department of Sustainable Agro-Ecosystems and Bioresources, Research and Innovation Centre, Fondazione Edmund Mach, Michele All’ Adige, Trento, Italy
Abstract In this chapter the Eddy Covariance network of Italy is presented, with
a short introduction to each of the 29 sites that were active during the CarboItaly project. These sites provided a unique dataset for a better study and understanding of the carbon cycle of terrestrial ecosystems and the links between carbon sink capacity and the main environmental factors. After a number of examples of Eddy Covariance time series where it is possible to see the effect of interannual climate variability and disturbances and managements practices, an analysis of the role of
the Carbon Uptake Period in the total Net Ecosystem Exchange (NEE) definition and a study of the effect of temperature and precipitation on the interannual vari-ability of NEE are presented in order to show the way these data can contribute to a better understanding of the role and response of ecosystems to climate change.
2.1 Introduction
Monitoring carbon, water and energy fluxes between terrestrial ecosystems and atmosphere is essential for a better understanding of the biological and ecological processes, also in relation to climate variability and climate change, and to assess the carbon balance of the different ecosystems and their ability to sequester CO2
from the atmosphere.
In order to improve the understanding of the quantities involved in the carbon bal-ance of terrestrial ecosystems, it is important to provide the following definitions: it is defined Gross Primary Production (GPP) of an ecosystem, the total amount of CO2
that is fixed by the vegetation in photosynthesis. The synthesis of new plant tissues and the maintenance of the plants themselves require energy that is provided by the auto-trophic respiration (Ra). The difference between the amount of carbon fixed by photo-synthesis and respired by the vegetation is defined Net Primary Production (NPP):
NPP = GPP − Ra
V. Magliulo
ISAFOM, CNR, Ercolano, NA, Italy G. Matteucci
ISAFOM, CNR, Rende, CS, Italy G. Matteucci
IBAF, CNR, Monterotondo, RM, Italy L. Montagnani
Forest Services and Agency for the Environment, Autonomous Province of Bolzano, Faculty of Science and Technology, Free University of Bolzano, Bolzano, Italy F. Petrella
Institute for Wood Plant and Environment (IPLA),
Environmental Disease and Soil Conservation Unit, Turin, Italy A. Pitacco
DAFNAE, University of Padua, Padua, Italy D. Spano
Department of Science for Nature and Environmental Resources (DIPNET), University of Sassari, via E. de Nicola 9, 07100 Sassari, Italy
P. Duce
IBIMET, CNR, Sassari, Italy D. Spano
Impacts on Agriculture, Forest and Natural Ecosystem Division (IAFENT), Euro-Mediterranean Center on Climate Changes (CMCC), Sassari, Italy
The NPP is allocated to the production of biomass (wood, leaves, roots, fruits, seeds etc.) and respired back to the atmosphere mainly due to decomposition by microbial activities. The quantity of carbon lost by respiration for heterotrophic organisms is defined heterotrophic respiration (Rh) and the difference between NPP and Rh is the Net Ecosystem Production
The NEP represents the net ecosystem carbon sink or source due to physi-ological processes and it is also named Net Ecosystem Exchange (NEE) when it is quantified using measurements of CO2 exchanges between ecosystem and
atmos-phere (while it is called NEP when measured using inventory approaches). The two terms are somehow interchangeable but in general with opposite signs: a flux of carbon from the atmosphere to the ecosystem is positive in NEP and negative in NEE. The sum of the two respiration components (Rh and Ra) represents the total ecosystem respiration (TER).
The NEP is however different from the long term carbon balance of the ecosys-tem because there can be changes in the carbon stocks due to episodic losses by natural or anthropogenic disturbances and management practices. For this reason the Net Biome Production (NBP) is defined as (Schulze et al. 2000):
There are different possible approaches and methods to measure the fluxes of energy and greenhouse gases (GHGs) in terrestrial ecosystems, ranging from inventory approaches to chambers measurements and ecosystem scale techniques such as the Eddy Covariance method (Aubinet et al. 2012).
The Eddy Covariance methodology has been developed in the early ’90s and has been widely applied at global level. It is based on high frequency (10 Hz) measurements of wind speed, temperature and gas concentration using a three-axis sonic anemometer (which measures the wind speed along the three axis) and a fast response gas analyzer, typically an Infra Red Gas Analyzer (IRGA) for CO2 and
H2O, even if new systems have been recently developed and commercialized to
measure high frequency concentrations of other gases such CH4, N2O and O3.
With the Eddy Covariance technique it is possible to measure the Net Ecosystem Exchange (NEE) of a GHG of a given surface extended around the monitoring tower (the footprint). The extension and shape of the footprint is func-tion of the wind speed, wind direcfunc-tion and the difference between the measure-ment and canopy heights and it has generally a radius between few hundred meters and one kilometer around the measurement point. The Eddy Covariance technique is the only method available today to continuously measure the net ecosystem exchanges at ecosystem level and in a not-destructive way.
In addition, for CO2 NEE measurements, there is the possibility to statistically
par-tition the net carbon fluxes measured into its major components as the gross primary production (GPP) and the ecosystem respiration (Reichstein et al. 2005; Lasslop et al. 2010) allowing a better interpretation of the fluxes in terms of ecosystem processes.
Nowadays, more than 500 sites exist globally, organized in regional networks contributing to the global network FLUXNET (http://fluxnet.ornl.gov/) with the
NEP = NPP − Rh = GPP − TER
aim to create global standardized datasets of Eddy Covariance measurements available to the scientific community (Papale et al. 2012). The usefulness of these measurements has been proved by the large range of applications published in the last years, ranging from empirical up scaling (Jung et al. 2010; Beer et al. 2010) to climate-ecosystem interactions (Reichstein et al. 2007), ecosystem function-ing (Mahecha et al. 2010; Williams et al. 2012) and model and remote sensing products parameterization and validation (Maselli et al. 2009; Chiti et al. 2010; Migliavacca et al. 2011; Wang et al. 2012).
2.2 The Italian Network
In Italy the first sites measuring CO2 and H2O fluxes continuously using the Eddy
Covariance technique were started in 1996–1997 (IT-Cpz, IT-Col and IT-Ren) within the context of the EUROFLUX European project (ENVCT 0095-0078), but the number increased rapidly in the following years thanks to other European research projects supporting the continental network of sites.
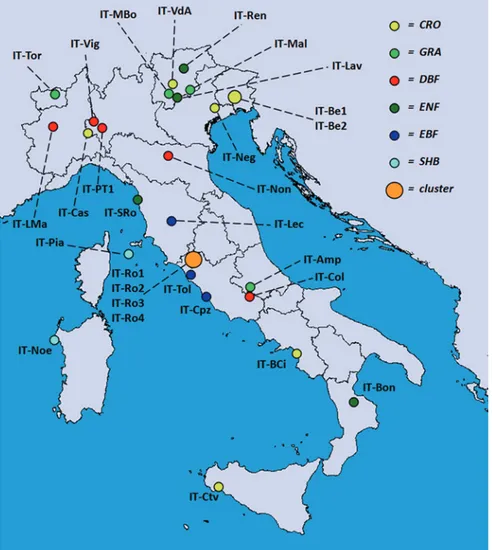
The CarboItaly FISR Italian project offered the opportunity to consolidate, enlarge and standardize the Italian network of sites which amounted to 29 sites in the 2007–2010 period. These sites, representing different Plant Functional Types (PFTs) and distributed along the Italian peninsula (Fig. 2.1), are briefly described in the following subsections. The network has been coordinated by the University of Tuscia, also hosting the database where all the data have been processed, stored and are today available to its users.
The data measured with the Eddy Covariance technique need a multiple-steps processing that, in particular for CO2 and H2O, has been standardized and
consoli-dated also during the CarboItaly project. The developed processing chain is appli-cable to all those sites minimizing potential differences due to the data Quality assurance/Quality control (QA/QC) used in particular when synthesis activities involving multiple sites are performed. The measurements acquired by the Italian sites have all been centrally processed according to the international standards described in Papale et al. (2006), Moffat et al. (2007) and Reichstein et al. (2005).
2.2.1 Amplero (IT-Amp)
The Amplero Mediterranean mountainous grassland is located in central Italy in the Abruzzo region (41.90409° N; 13.60516° E) on a flat to gently south sloping (2–3 %) area, at 884 m.a.s.l. The experimental area is a homogenous mixed grass-land, mainly composed by few dominant graminoids (genus Poa 10 %), forbs (genus
Trifolium 30 %, genus Medicago 20 %) and composites (genus Geranium 20 %, genus Cerastium 20 %). The growing season ranges from April to the end of May (roughly 60 days long) with the maximum of production at the end of May, while the
senescence occurs in June. At the end of June there is a clip and after that the animal grazing (cows, horses and donkeys) until the end of November. The estimated stok-ing rate is around 0.5–1 animals per hectare each year and we can therefore assume that the grazing is extensively managed. The climate of this area is mountainous Mediterranean (Petriccione et al. 1993), typical climate of the Italian Apennines region. Average annual precipitation is 1,365 mm (ARSSA local database) with two precipita-tion peaks: one in autumn (October to December) and the other one in spring (March to April). The precipitation minimum occurs in July. The soil is Haplic Phaeozems Fig. 2.1 Map of the Italian Eddy Covariance sites contributing to the CarboItaly project. Colors represent the different PFTs: CRO cropland, GRA grassland, DBF deciduous broadleaf forest, ENF evergreen needleleaf forest, EBF evergreen broadleaf forest, SHB shrubland. The Roccarespampani cluster includes two DBF and two CRO sites
(FAO 2008) with a depth of more than 1 m and drainage from poorly to imperfectly. The percentage of clays is 56 % and pH is 6.5. Roots reach down to 30 cm and more than 90 % of roots is placed in the first 15 cm. Starting from the last 50 years the area has been managed by a combination of clipping/harvesting and cattle grazing. The Eddy Covariance flux tower has been installed in June 2002 and the measurements have been carried out until July 2008 (Gilmanov et al. 2007; Wohlfahrt et al. 2008).
2.2.2 Beano (IT-Be1 and IT-Be2)
An agricultural field of 13.3 ha was selected in the north-eastern part of Italy in the late autumn of 2006. In this field, irrigated maize (Zea mays L.) was cultivated during the last 30 years and the soil was tilled using a winter plow to a depth of 0.35 m and a spring soil preparation (5 cm) prior to sowing. A quite constant high yield (10–11 Mg ha−1 dry matter) was achieved using a sprinkler irrigation
sys-tem and adding chemical fertilizers used in accordance with standard practices. The average annual temperature at the site was 13.7 °C and annual precipitation was around 1,200 mm (2000–2007). Soil can be classified as a Chromi-Endoskeletic Cambisol (FAO 2008) with the following characteristics in the 0–30 cm horizon: total SOC = 48.4 ± 8.5 Mg C ha−1, total N = 4.2 ± 1.1 MgN ha−1, soil bulk
den-sity = 1.25 ± 0.15 g cm−3, soil field capacity = 23 % v/v, wilting point = 12 %
v/v and pH = 7.1 ± 0.02 (Alberti et al. 2010). The study area was divided into two sections obtaining an eastern area of 8.6 ha and a western area of 4.7 ha. Maize was cultivated in the East field (IT-Be1, 46.00361° N; 13.0256° E) using similar management practices described above. After harvest, grain was removed from the field while residues were left there (harvest index: 50 %). Instead, the West field (IT-Be2, 46.00431° N; 13.02776° E) was converted to fodder alfalfa (Medicago
sativa L.), with a late winter plowing at 0.35 m (February 2007). At sowing, 39 kg ha−1 of seeds were used. No N fertilization was performed in IT-Be2. Alfalfa
was maintained from 2007 to 2009 with an average of four harvests during summer. In 2010, IT-Be2 was converted again to maize with a minimum tillage (0–5 cm) before sowing and following the same management practices used in IT-Be1.
2.2.3 Bonis (IT-Bon)
The experimental site is located in Southern Italy, in the Sila Greca mountain range, in the region of Calabria (39.47778° N; 16.53472° E). The watershed area is 140 ha, ranging from 975 to 1,300 m.a.s.l. and has been reforested between 40 and 50 years ago with conifers (Pinus nigra J.F. Arnold subsp. laricio, 80 %) and broad-leaves (Castanea sativa L., 6 %). The remaining surface is covered by pastures, crops, creeks and bare soil. The area is characterized by a Mountain Mediterranean climate with variable but generally sufficient rainfall (1,170 mm)
and an average temperature of 8.7 °C. Since 1986, the watershed has been equipped with meteorological stations and instrumentation in order to monitor hydrometri-cal heights and river discharge. Components of the hydrologihydrometri-cal balance are studied since 1994 in forest structures characterized by different thinning regimes. Since 1999, the effect of different fire types on soil erosion and hydrology is also studied. The flux stations have been established in 2003 over 35 years-old pine plantation (1,175 m.a.s.l.) with 637 trees ha−1. Mean diameter and height are 29.3 cm and
20 m, respectively, with a basal area of 45.4 m2 ha−1. In 2006, all sided Leaf Area
Index (LAI) was 6.55 ± 0.18. Substrate is granite and soils are Ultic Haploxeralfs.
2.2.4 Borgo Cioffi (IT-BCi)
The Borgo Cioffi monitoring site has been running since July 2002 on a arable field located on Gaetano Iemma’s farm (Eboli, Salerno, 40.52375° N; 14.95744° E), covering a total area of 150 ha in the centre of the Sele river Plain, an alluvial plain featuring an intensive and high income agricultural activity. The station is located about 20 m.a.s.l., which can be found south-west at a distance of about 5 km. The 16 ha field, in which all the experimental activities are carried out, is surrounded by irrigated land, has no aerodynamic obstacles in the vicinity of the boundaries able to influence the vertical profiles of atmospheric properties and it is irrigated by means of an automatic central pivot system.
The farm hosts a water buffalo operation with over 800 adult cattle, and the fields have been cultivated for decades to forage crops (alfalfa, winter and spring grass, corn silage) and winter vegetables (fennel, cauliflower). Solid and liquid manure are frequently applied at high rates.
The station is located approximately in the centre of the field, featuring an approximately rectangular shape with sides of 270 and 600 m. The fetch in the prevailing wind directions, south-west and north-east, is about 200 m. The slope is almost flat with a 2 % downward gradient towards the south.
The soil, classified as a Calcic Kastanozem Skeletic (FAO 2008) and derived from calcium carbonate parent rock, boasts an alluvial origin and features a silt-clay texture.
2.2.5 Castellaro (IT-Cas)
The site is located in Lomellina, a typical rural area of the Po Valley in Northern Italy, in the municipality of Torre Beretti and Castellaro (Pavia) (45.07005° N; 8.71752° E, 88 m.a.s.l.). The field extends for 400 × 700 m and it has been culti-vated with hybrid corn (Zea mais L., variety pioneer for silage production) in 2006 and with rice from 2007 to 2010. The rice cultivar was Balilla (japonica rice short grain), a typical management cycle starts with 25 cm deep ploughing in January,
laser soil leveling in February, in March sugar beet industrial slops (2,250 kg ha−1)
and urea (75 kg ha−1) are incorporated and compacted before sowing in April
into water with 210 kg ha−1 of seed. Weed control in May, top dressing with Urea
(90 kg ha−1) in June. The average depth of standing water was maintained at about
5 cm in 2007 and 10 cm in 2008. The standing water level fluctuates during the flooded periods due to the continuous water flow through the rice field, a typical management practice for this crop. At the beginning of September the water is removed from the field and the harvest takes place in October. The final rice pro-duction was about 9 tree ha−1. The soil originating from fluvial deposits is poorly
drained and characterized by a ground water table very close to the surface. In most parts of the field it is a Calcic Gleysol (FAO 2008), with a loam to clay-loam tex-ture, in other parts of the field we find Haplic and Mollic Gleysols. The A-horizon shows pH (H2O) values ranging at 6.4–7.1, the organic carbon content is between
1.6 and 2.4 %. The gleyic color pattern of soil materials indicates dominant water saturation for most of the year in combination with poor drainage due to cultivation tillage and agricultural practices. During the observation period the average annual rainfall was 704 mm while the average annual temperature was 13.0 °C.
2.2.6 Castelvetrano (IT-Ctv)
The site is an olive orchard (cv. Nocellara del Belice) located in western Sicily at Castelvetrano (37.64416° N; 12.84638° E). The orchard has an extension of about 11 ha and has four different plots characterized by trees of different age (75 % 12–16 years old, 25 % 150 years old) but similar LAI (2.6–3.4) and trees height (3.4–3.7 m).
The soil texture is clay-loam with a volumetric water content at a field capacity of 36.1 and 17.4 % at −1.5 MPa soil water potential.
All of the plots were equipped with an irrigation system characterized by two micro sprinklers (8 liters hour-1) per tree. During the vegetative season, the total
volume of water varied between 1,500 and 2,000 m3 ha depending on summer
weather conditions. In accordance with the cultural practice adopted in this tra-ditional olive-growing area, soil is clean cultivated during the vegetative season, whereas no weed control is undertaken during the rain season (autumn and winter).
The adopted tillage in the soil during the year allowed the growth of sponta-neous annual herbaceous crops, characterized by the prevailing presence of grass (Graminaceae spp).
2.2.7 Castelporziano (IT-Cpz)
The experimental site was a 60 years-old coppice under conversion to high for-est, inside the Presidential Reserve of Castelporziano (41.70525° N; 12.37611° E), 2.8 m.a.s.l., 25 km West of Rome. The natural Reserve covers about 4,800 ha, of
which 85.6 % are forests. The climate is Mediterranean Type humid sub humid with an average yearly rainfall of 780 mm and an air temperature of 15.6 °C.
The forest structure is characterized by two layers: a dominant layer of Quercus
ilex L. 12–15 m high and a shrub layer, 2–4 m high, with Phillirea latifolia L.
Pistacia lentiscus L., Erica arborea L., Cistus salvifolius L.,Cistus incanus L.,
Cytisus scoparius L., and some vines (Clematis flammula L., Hedera helix L.,
Rubia peregrina L., Smilax aspera L.). Large trees over 100 years old, and up to 17 m high and 170 cm in diameter, represent only 1 % of the stand. LAI is in between 3.2 and 3.8. The herbaceous layers are represented by Brachipodium
sylvaticum (Hudson) Beav., Cyclamen repandum Sibth et Sm., Carex distachya Desf., Asperula laevigata L., and Alliaria petiolata Bieb. The current Q. ilex forest represent a secondary succession after a fire destroyed the area in 1944. In 1985 the stand was converted from coppice into high forest.
The morphology of the reserve is mostly flat with altitudes ranging between 0 and 85 m.a.s.l. The soil is 40–60 cm deep with a pH 5.8 and the profile of the experiment is type A–C, with a fairly deep, well draining A horizon, rich in humus and calcium carbonate. The soil is sandy (75.2 % coarse sand, 11.2 % fine sand, 3.7 % coarse silt, 2.2 % fine silt, and 6.7 % clay). The soil organic matter is 3.4 % between 0 and 20 cm and 1.1 % between 20 and 40 cm. Organic carbon is 1.9 % in the organic horizon with a C/N ratio of 66 and is 0.65 % with a C/N ratio of 100 in other mineral Horizons.
The climate is characterized by a dry season extending for 4 months, from the beginning of May to the end of August. Water deficit during the dry seasons is 406 mm, while excess rainfall in other seasons is 410 mm. The scattered low sum-mer rains are offset by high night humidity, which over a period of 10–15 days can contribute to 0.2–0.8 mm of precipitation.
2.2.8 Collelongo (IT-Col)
The experimental site is located near the village of Collelongo, Abruzzo region, in central Italy, close to the external belt of the Abruzzo, Lazio and Molise National Park. The Selva Piana forest stand (41.84936° N; 13.58814° E, 1,560 m.a.s.l.) belongs to a 3,000 ha forest community which is part of a wider forest area. The environmental and structural conditions of the stand are representative of central Apennines beech for-ests. The site was established in 1991 to study ecology and silviculture of Apenninian beech (Fagus sylvatica L.) forest. In 1993, the site was the first European forest to be instrumented to measure ecosystem level fluxes with Eddy Covariance (Valentini et al. 1996). In 1995–1996, the area became an ICP-Forests level II and an ICP-IM moni-toring plot (http://icp-forests.net/). Since 2006, the site has become one of the main stations of the Long-Term Ecological Research site “Forests of the Apennine”. Over the years, the site was included in several EU and national research, monitoring and environmental projects. It is a pure beech forest with 830 trees ha−1, with an average
diameter of 22 cm and an average height of 21.5 m. The average tree age is approxi-mately 120 years (2011). LAI ranges between 4.5 and 6.2 (1992–2011). Aboveground
and belowground biomass is 171 Mg C ha−1. The 40–100 cm deep soil is developed
on calcareous bedrocks and is classified as humic alisol. Mineral soil carbon stock (0–80 cm) is 223 Mg C ha−1, with 4.4 Mg C ha−1 stocked as litter (OL layer). The
climate at the site is Mountain-Mediterranean with an average annual temperature of 6.9 °C and an average annual precipitation of 1,230 mm. Snow cover can last from mid December to mid March–early April.
2.2.9 La Mandria (IT-LMa)
The tower site (45.15258° N; 7.58259° E) is included into La Mandria regional park which has an extension of 3,000 ha and is located in the suburbs of Turin, near Venaria Reale, at about 350 m.a.s.l. The area is typical for peculiar geomor-phic features originated by the presence of old terraces, residual of the ancient level of the main plain, which forms a hilly landscape with highlands and valleys, connected by steep slopes and characterized by regressive erosion of small rivers.
Vegetation is mainly constituted by the oak-hornbeam (Quercus robur L. and
Carpinus betulus L.) of the high plains, which is considered an important forest-type to be studied and conserved. In the park there are also some plantations of red oaks (Quercus rubra L.), which cover around 20 % of the woods, some Robinia psuedoa-cacia formation on the slopes, some grasslands and poplar formations on the plains. Age of the oak-trees is about 80 years in average but an increase of trees mortality is registered along with wildlife high pressure which stops plant regeneration.
The soil on the top of the terraces is mainly ‘paleosols’, which according to the USDA classification are called Typic Fragiudalf, fine-silty, mixed, acid, mesic. One of the main features of the soil profile is connected to a temporary groundwa-ter, placed at 60–70 cm below the ground level and a top-layer rich of silt, above a sub-layer called ‘fragipan’ which is very hard to root penetration. Therefore trees tend to stay with their root-apparatus within the upper part of the soil profile, often increasing the chances of tipping. Moreover, the greatest percentage of biological activity is detected in the topsoil, due to the difficulties of organic matter to deepen below the ground water zone.
Climate is classified as humid (second mesothermic with a low summer effi-ciency) with an annual rainfall of 1,030 mm and an annual temperature of 11.6 °C. The stand in the surrounding area of the flux tower has a measured biomass of 14 kg m-2, a leaf litter of 1.4 kg m-2 and a tree density of 311 ha.
2.2.10 Lavarone (IT-Lav)
The Lavarone station is situated in the south east of the Trento province (45.95620° N; 11.28132° E; 1,300 m.a.s.l., average annual temperature 7.2 °C, total annual pre-cipitation 1,150 mm) on a mountain plateau ranging from 1,000 to 2,000 m.a.s.l.
The whole study area covers nearly 80 km2. This composite landscape is still
wide-spread in the southern Alps, although it is undergoing a rapid transformation because of the combined effect of land use intensification in some more productive areas and the abandonment of more marginal ones. The landscape is characterized by the spatial succession of the three typical mountain management systems: grasslands (Arrenatheretum), pastures (Festucaetum) and mixed coniferous and broadleaf for-ests (Abietis-fagetum). The area analysed is characterized by an uneven-aged mixed forest dominated by Abies alba Mill. (70 %), Fagus sylvatica L. (15 %) and Picea
abies (L.) H.Karst (15 %), with an average of 1,300 stems ha−1 (dbh > 7.5 cm) and
a LAI of 9.6. The canopy has a dominant layer reaching 33–38 m and crown lower limits at about 12 m. In the understorey suppressed beeches form a discontinuous sec-ond layer from 0 to 4 m. The site is located on a gently rolling karst plateau and has a homogeneous vegetated fetch larger than 1 km in all directions, except for a 45° sector (300 m fetch in the SSW direction). Soils are generally well developed brown earth lying on a calcareous bedrock with the following characteristics in the 0–30 cm horizon: total SOC = 11.8 ± 1.8 kg C m−2, total N = 0.61 ± 0.05 kg N m−2, CN
ratio = 15.9 ± 1.0.
2.2.11 Lecceto (IT-Lec)
Lecceto forest (43.30359° N; 11.26975° E) is a Holm oak coppice with a shift of 18–20 years located South-East of Siena, near the centre of the region of Tuscany, at about 300 m.a.s.l. It is the residual part of a broader forest named Selva del Lago for its proximity, during the Middle Ages, to a marshy area, subsequently drained in the XVIII century. That forest covered a surface of 10 km from north to south and 7 km from east to west. Because of the large use of wood during the Middle Ages, the Selva del Lago forest was subjected to specific rules of manage-ment and became a crucial crossroad between surrounding rural communities. In the XI century the most important Augustinian hermitage of Siena territory was founded in the middle of the forest. Since 1972 the hermitage was turned into a monastery of Augustinian cloistered nuns.
The forest covers an area of 900 ha and Holm oak represents 81 % of the total tree canopy; others species are represented by Arbutus unedo L., Juniperus
com-munis L., Quercus pubescens L., Phillyrea latifolia L., Fraxinus ornus L.
The soil of the site is rocky and shallow, characterized by metamorphic schists and anagenite, and secondarily by cavernous limestone and carsism phenomena. The climate of Lecceto is a Mediterranean one, characterized by a strong seasonal-ity with rainfall concentrated in autumn-winter, high inter-annual variabilseasonal-ity and frequent extreme events, such as summer drought and heatwaves. The average cumulated annual precipitation (1961–1990) at the nearest rain gauge is 780 mm, with a minimum in July (29 mm) and a maximum in November (108.7 mm); average annual temperature is 13.5 °C; July is the hottest month and January the coldest.
The stand in the surrounding area of the flux tower was coppiced about 15 years ago; its average stand height is around 9 m and the density of the stumps is about 1,200 ha−1.
2.2.12 Malga Arpaco (IT-Mal)
Tesino Upland is located in the eastern part of Valsugana, in the southern part of external Dolomites; its Northern border is marked by the Lagorai mountains (2,700 m). The study site is located on a farm (Malga Arpaco) at 1,730 m.a.s.l. (46.11402° N; 11.70334° E), near Passo Brocon, it is a seasonality pasture (alpeg-gio) with pasture times from the beginnings of June to the end of August (around 100 days). The climate in the southern part of Dolomites is influenced by the Adriatic sea, while in the northen part it is more continental; the annual rainfall is about 1,100–1,550 mm concentrated in spring (May–June) and in autumn (October– November); the average temperature is lower than 0 °C from December to March.
The examined pasture is in the inferior alpine horizon. This vegetation layer is the upper limit of the microtherrmal Fagus forest and it may be constituted by Picea in the lower part and by Larix in the higher part. In this area, human activity changed the original vegetation to pastures and grasslands by cutting the forests, while in other sites the alpine pastures are typically above the upper tree vegeta-tion line. The soil is an alfisol, sandy-loam and a Typic Hapludalfs (FAO 2008).
The Malga Arpaco pasture results to be sufficiently used, without bushes, pas-turing paths, erosion; yet, the negative effects of understocking begin to appear, as evidenced by the existence of some limited overpastured areas surrounded by
Deschampsia spp. and Cirsium spp.
From the floristic survey the grassland resulted to be composed predominantly by good fodder Poaceae (genera Festuca, Poa, Phleum), reduced by pasturing in summer; yet, the area shows, at least in some parts, the specific composition of a mid-damp and degraded grassland, with nitrophilous species, and the signs of a strong use, in transition from a grassland to an unrationally grazed pasture.
2.2.13 Monte Bondone (IT-MBo)
The study site was located at 1,550 m.a.s.l. on a mountain plateau in the Italian Alps (Viote del Monte Bondone, 46.01468° N; 11.04583° E). The average annual air temperature is 5.5 °C with monthly averages ranging from −2.7 °C in January to 14.4 °C in July. The average annual rainfall is 1,189 mm, with peaks in June (132 mm) and October (142 mm); snow cover occurs between November and April. The area is managed as an extensive meadow dominated by Festuca rubra L. (basal cover of 25 %), Nardus stricta L. (basal cover of 13 %) and Trifolium sp. (basal cover of 14.5 %), which represents a typical low productivity meadow of the alpine region. The maximum canopy height at the peak of the growing
season (mid June to early July) can reach up to 30 cm. Meadows represent the main land use on this plateau (2 km2) and are traditionally managed for hay
pro-duction with low mineral fertilization and one cut per year in mid-July. Soil can be classified as a Typic Hapludalfs, lyme loamy, mixed, mesic with the following characteristics in the 0–30 cm horizon: total SOC = 9.4 ± 0.4 kg C m−2, total
N = 0.29 ± 0.02 kg N m−2, soil bulk density = 0.79 ± 0.29 g cm−3.
2.2.14 Negrisia (IT-Neg)
The site is located in North-Eastern Italy in a commercial vineyard located in Negrisia di Ponte di Piave (45.74756° N; 12.44673° E, 11 m.a.s.l.). The climate is mediterranean, with average annual precipitations of 833 mm and an average annual temperature of 13.1 °C. The station, set up in July 2005, is in the center of a one single 25 ha plot. The terrain is quite flat and both soil and canopy are very homogeneous and thus suitable for both micrometeorological and remote-sensing approaches. The vineyard is mainly composed of Vitis vinifera L. cv.‘Carmenère N.’ grafted on SO4 rootstock. The vines were planted in 1992 in north–south
ori-ented rows (500–600 m long) 2.50 m apart. Plant spacing on the rows is 1.30 m, resulting in a density of 3,076 vines per hectare. Vines were grown with a sin-gle trunk trained to spur-pruned cordon, at about 1.7 m aboveground, for vertical shaker harvesting. The floor is grass covered and a 1 m wide strip on the rows is chemically treated. The silty-clay loam soil (International textural classes), classi-fied as Vertic Eutrudent (FAO 2008), is >1 m deep and highly homogeneous within the study site, rich in organic matter (about 18.2 g kg−1) and with an average pH
of 7.7. The vineyard receives standard management. Maximum canopy height was kept at 2.70 m, and no foliage could be found below the cordon. Maximum LAI, monitored both by direct and by indirect methods, ranges from 2.2 to 2.5.
2.2.15 Noè (IT-Noe)
The Noè site is located within a nature reserve called “Le Prigionette” (40.60613° N; 8.15146° E, 27 m.a.s.l.). The area is part of the Capo Caccia peninsula, in North-Western Sardinia, near the town of Alghero. The nature reserve, with a sur-face area of approximately 1,200 ha, is delimited by a cliff dropping to the sea on the north-western and western boundaries.
The climate is Mediterranean, semiarid with a warm summer, mild winter, and a prolonged water shortage from May through September. The averages for annual, minimum and maximum temperatures are respectively 15.9, 7.0, and 28.0 °C. The average annual thermal excursion is about 14 °C (10 °C in January and 24 °C in August). The average annual precipitation is 588 mm, mainly con-centrated during the spring season. In the course of the autumn intense rainstorms often occur with high runoff and low water storage.
The main species are juniper (Juniperus phoenicea L.), lentisk (Pistacia
lentiscus L.), tree phyllirea (Phyllirea angustifolia L.), and dwarf fan palm (Chamaerops humilis L.). These species form a sparsely vegetated shrub land, where juniper and lentisk, which respectively cover 53 and 22 % of the vegetated surface, are aggregated into variably-sized patches with bare ground in between. Phillyrea and palm can only be found as isolated elements inside the main patches. Other species typical of Mediterranean maquis are present on the experimental site: rosemary (Rosmarinus officinalis L.), Genista corsica (Loisel) DC., Daphne
gnidium L., Smilax aspera L., Euphorbia characias L., Helichrysum microphyllum DC., Asphodelus microcarpus Salzm., and Ferula communis L. The vegetation is a secondary succession following a fire event occurred in 1963 and agricultural abandonment in 1970. Currently, this area has limited human activity. The aver-age maquis height ranges between 0.93 and 1.43 m, and the ground cover varies between 42 and 91 %. Total LAI values range from 2.7 to 3.0. The soil is Lithic Xerorthent, 0.3–0.4 m deep, mainly composed of clay, and erosion is common.
2.2.16 Nonantola (IT-Non)
The Nonantola forest is a hardwood plantation located in a flat rural area of the Po valley in the Emilia Romagna region, close to Modena (44.69019° N; 11.09109° E 15 m.a.s.l.). The site was set up in 1992 with European fundings (Set-aside, Reg. CEE 797/85 and, being a re-forestation in a former rural area it is a proper representation of a Kyoto forest—Sect. 3.3 of the Kyoto Protocol). The forest is still growing and has not yet reached the final stage, its dominant species consisting of: Oak (Quercus robur L.) 35 %, Ash (Fraxinus spp.) 25 %, Maple (Acer campestre L.) 12 %, Willow (Salix
alba L.) 8 %, Poplar (Populus alba L.) 6 %, Cerry (Prunus mahaleb L.), other 8 %. The total area is 38.6 ha with a tree density of 1,100 trees ha−1 at the plantation stage,
and reduced to 826 trees ha−1 10 years after. The soil, by Soil USDA Taxonomy is
Fine, Mixed, Mesic Entic Chromusterts with a 60 % of clay, and a soil organic mat-ter (SOM) of 49.8 Mg C ha−1estimated in 1992 and 53.7 Mg C ha−1 measured in
2000. The average annual temperature of 13.1 °C and the average annual rainfall of 719 mm. characterize the site as located in Mediterranean climate, with rainfall con-centrated in autumn-winter, summer drought and some heat waves events. Fluxes have been measured since 2001 by means of the Eddy Covariance system placed at 13 m above the forest floor and steadily to rise during tree increase.
2.2.17 Parco Ticino (IT-PT1)
The study site is located at 60 m.a.s.l., about 10 km North-West of the city of Pavia (45.20087° N; 9.06104° E) in the municipal area of Zerbolò, within the Ticino Natural Park in Northern Italy. Poplar land-use was introduced in the area after 1973 when a fire destroyed the foregoing natural land cover, a floodplain forest with dominant oak
(Quercus robur L.), ash (Fraxinus excelsior L.), white poplar (Populus alba L.) and black alder (Alnus glutinosa (L.) Gaertn). A relict of the natural forest is represented by the 200 year-old Bosco Siro Negri located within 1 km. The poplar high stand of 46 ha (Populus × canadensis Moench, Clone I-214) was 12 years old in 2002, the spacing was 6 × 6 m and the tree density was 278 tree ha−1. The average tree height
was 26.6 m, while the average diameter at breast height (dbh) was 0.33 m and the stem basal area was 20.5 m2 ha−1 in 2005, when the site was logged. In order to carry
out replanting after logging, residues were removed, stumps were drilled to allow a 60 cm deep ploughing, and 4 m long shoots were inserted for about 150 cm into the ground. In general, management intensity was low with removal of ground vegeta-tion (mainly Artemisia and Poa) by harrowing during early summer and occasional irrigation on demand. During 2002–2005 one fertilization event of 300 kg ha−1 of
urea occurred in May 2002, and two natural flooding events in November 2002 and October 2004. Soils are Arenosols and Regosols not well developed on recent allu-vial sand and gravel deposits of the Ticino river. Topsoil shows a bulk density of 0.9– 1.4 g cm−3, the nitrogen and carbon content are 5.23 kg C m−2 and 1.36 kg N m−2,
pH (H2O) ranges at 5.5–7.0. The soil texture is sandy-loam (60.4 % sand, 30 % silt
and 9.6 % clay). The climate of the site is classified temperate continental, with an average annual rainfall of 912 mm and an average temperature of 12.5 °C. Budburst usually occurs at the beginning of April and senescence in October, with the LAI peaking at around 2.0 in July. Winds show a prevailing direction from the north-east and south-west. Atmospheric nitrogen deposition is about 20 kg N ha−1 per year.
2.2.18 Pianosa (IT-Pia)
The Island of Pianosa (42.58437° N; 10.07804° E) is one of the seven islands of the Tuscan Archipelago with a total area of 10.2 km2 and a coastal perimeter of
approximately 20 km. The island is almost completely flat, with some small undula-tions, its highest elevation is 29 m.a.s.l., while the average is about 18 m.a.s.l. On the basis of a historical meteorological dataset (1951–2009), the average air tem-perature is 15.8 °C and the average annual rainfall is 497 mm, ranging between a minimum of 176 mm (1999) and a maximum of 716.2 mm (1984). A clear seasonal precipitation pattern shows a maximum from October to December followed by a decrease with a minimum value in July. The soils are sandy-loam or sand, alkaline, rich in carbonates, with a moderate content of rock fragments, mainly classifiable as Leptosols. Three main ecosystems have been mapped: abandoned crops and pas-tures, Mediterranean macchia and woodlands. Abandoned croplands and pastures are the main ecosystems in terms of extent (52 %) but are less representative in terms of total biomass (26 %). The land previously used for agriculture is now covered by a species association typical of degraded Mediterranean agricultural soils. The Mediterranean macchia vegetation exists at different evolutionary stages as a con-sequence of the progressive re-naturalization process which the island is currently undergoing. The Island of Pianosa represents an interesting case study to assess the evolution related to land use change in a Mediterranean environment, since the island
was intensively used for agricultural production presumably since the Romans. In particular, intensive soil cultivation was carried out by the prisoners of the local Penal Colony in the last century and subsequently abandoned at the end of the 1990s.
2.2.19 Roccarespampani Forest (IT-Ro1 and IT-Ro2)
The two sites, along with the IT-Ro3 and IT-Ro4 described below, are part of the Roccarespampani cluster within a publicly owned farm in the Province of Viterbo. The climate of the sites is typical Mediterranean, with dry and hot summers and relatively mild and wet winters. The average annual temperature is of 15 °C with a total rainfall of 800 mm. The precipitation distribution pattern typically features a drought period in in the months of July and August. The bedrock is of volcanic origin and the soil is a 90 cm deep Luvisol (Tedeschi et al. 2006).
The Roccarespampani forest stretches for about 1,300 ha in a fairly flat area varying from 120 to 160 m.a.s.l. and it is mostly composed of Turkey oak (Quercus cerris L.) stands, historically managed under the silvicultural sys-tem of coppice-with-standards in the last 200 years with a rotation cycle ranging 15–20 years and it has been arranged in 15 sequentially aged compartments with an average area of 85 ha.
Eddy Covariance fluxes were monitored over two sites established in distinct compartments. The IT-Ro1 site (42.40812° N; 11.93001° E) operated in the period 2000–2009 and was representative for the initial developmental stages (0–9 years) of the forest after the forest cut (coppicing), which occurred in December 1999. The IT-Ro2 site (42.39026° N, 11.92093° E) is instead representative of older stages (11 years) and it was set up in 2002. In terms of vegetation composition and struc-ture, the earlier stages are characterized by a dense regrowth of shoots (~6,000 trees ha−1) on coppiced stumps accompanied by shrubs such as Cytisus scoparius (L.)
Link, Spartium junceum L., Crataegus spp., Paliurus spina-christi Mill., Rosa canina L., while oak standard trees in the range of 20–60 years (~100 trees ha−1) tower over
the low canopy. Later stages exhibit a less dense structure (~3,000 trees ha−1) with
a 16–20 m high main tree canopy, largely made up of Q. cerris, which includes also
Quercus pubescens Willd., Fraxinus ornus L., Ulmus minor Mill., Ostrya carpinifolia Scop., Acer monspessulanum L. and A. campestre L. An understorey layer typically composed of Phillyrea latifolia L., Crataegus spp., Ruscus aculeatus L., Cornus spp.,
Prunus spinosa L., Sorbus spp. completes the forest vegetation (PGAF 2009).
2.2.20 Roccarespampani Crops (IT-Ro3 and IT-Ro4)
The sites are part of the Roccarespampani cluster (see Sect. 2.2.19) and were estab-lished in the late summer of 2007 in a flat, non-irrigated cropland. The two Eddy Covariance systems were installed in two adjacent arable fields (42.37539° N;
11.91542° E for IT-Ro3 and 42.37333° N; 11.91922° E for IT-Ro4). The two cropland fields are of about 15 ha each allowing a minimum distance of 110 m from the fields’ edges, with surrounding fields being similarly covered by non-irrigated cropland. The soil is an Eutric Cambisol with a clay loam texture (40 % clay, 30 % silt, 30 % sand) and, on average, 10.8 g kg−1 of organic carbon and
1.3 g kg−1 of total nitrogen in the cultivated layer (0–30 cm).
The fields have been under dry arable cultivation for the last two decades, under a rotation including primarily durum wheat (Triticum durum Desf.) and annual for-age crops, mainly crimson clover (Trifolium incarnatum, L.) as a pure stand or as a mixture with oats (Avena sativa L.) and common vetch (Vicia sativa L.). In the 2007– 2008 and 2008–2009 growth seasons, the two sites were employed for a paired com-parison of different agronomic management for biofuel crop productions, namely a winter crop, i.e. rapeseed (Brassica napa L.), in 2008 and a spring crop, i.e. sunflower (Heliantus annuus, L.), in 2009. One of the fields (IT-Ro3) was managed convention-ally using mouldboard ploughing and disk harrowing, while the other (IT-Ro4) was managed as a no-tillage system. After 2009, the farm was converted into an organic agriculture regime and the no-tillage field, typically requiring chemical weeding, was then reverted to conventional tillage. Both fields were occupied by organically grown crimson clover (T. incarnatum) for seed production in the 2009–2010 growth season. In 2010–2011, the IT-Ro3 field was employed for (organic) durum wheat production, whereas the IT-Ro4 field was occupied by crimson clover employed as an annual for-age crop, i.e. occasionally grazed by cattle. In the 2011–2012 growth season one of the fields (IT-Ro4) was managed as crimson clover for seed and straw production while the other (IT-Ro3) was occupied by a mixture of vetch and oats employed as a forage crop with occasional cattle grazing and final hay harvest in June.
2.2.21 Renon (IT-Ren)
The Renon-Selva Verde site (46.58686° N; 11.43369° E, elevation about 1,735 m.a.s.l.) is located in the municipality of Renon, at a distance of 12.2 km North-Northeast from the town of Bolzano. Eddy Covariance measurements started in the year 1997. The site is placed on a porphyric plateau; the soil is clas-sified as Haplic Podsol following FAO (2008).
The site vegetation, a subalpine coniferous forest, is of natural origin and is used for wood production. As a result of the traditional harvesting method, which consists of irregular cuttings of 50–80 cubic meters, overall the forest is unevenly aged, but with homogenous groups. The largest group present in the area has been approxi-mately growing since the year 1820, after the Napoleonic wars. The main forest spe-cies is spruce (Picea abies (L.) Karst., 85 % in number) followed by cembran pine (Pinus cembra L., 12 %) and larch (Larix decidua Mill., 3 %). In the clearings, cov-ering approximately 15 % of the area, the dominant grass species is Deschampsia
flexuosa L. The canopy is irregular, with a maximal height of 29 m. The average LAI, measured by hemispherical photographs, is 5.1 (Montagnani et al. 2009).
The climate is strongly influenced by elevation, with cool summers and mod-erately cold winters. During the last decade, the average temperature was 6.21 °C and the annual precipitation was 964.21 mm (Niu et al. 2011).
2.2.22 San Rossore (IT-SRo)
The study site is an even aged Pinus pinaster forest located 9 km west of Pisa (central Italy) and 800 m east of seashore inside the regional park of San Rossore-Migliarino-Massaciuccoli, (43.72786° N; 10.28444° E, elevation 6 m.a.s.l.) The park extends for 24,000 ha about 30 km between Livorno and Viareggio along the Tyrrhenian coast with an estuarial morphology characterized by the presence of alluvial deposits and sandy dunes between the rivers Serchio and Arno. Pinus
pin-aster Aiton was introduced in 1771 in a strip of ca 10 × 1 km behind the dunes in order to protect the economically important P. pinea L. plantations more inland. Before human intervention, the P. pinaster area was covered by Mediterranean scle-rophyllous forests and scrubs, a formation of Ligurian-Thyrrenian meso-Mediterra-nean holm oak forests (Quercus ilex L.) with Fraxinus ornus L., Ostrya carpinifolia Scop., Viburnum tinus L. The current P. pinaster forest established from seed after a big fire in 1944 and was never thinned systematically. A survey of the experimen-tal plot in 2000 showed a tree density of 587 trees per ha (84 % P. pinaster, 12 %
P. pinea, 4 % Q. ilex in the understorey), a basal area of 40 m2 ha−1, an average
canopy height of 18.7 m, a LAI of 2.8 and a total aboveground and root biomass of 9.7 and 1.9 kg C m−2. Due to a very high ungulate density, there is no ground
vegetation and only few shrubs like Phyllirea angustifolia L., Myrtus communis L.,
Erica arborea L. The soil in the pinewood is a regosol with a 93 % sand texture extending down to 4 m depth. The top 10 cm of soil is characterized by pH (H2O)
of 6.5 and C/N ratio of 25.2; rooting depth is limited by the water table varying between 100 cm in winter and 200 cm in summer. The climate of San Rossore is Mediterranean sub-humid, with an average annual rainfall of 876 mm and an annual temperature of 15.6 °C. The wind regime is characterized by a land–sea breeze cir-culation with air flows from the west during the day and from the east during the night. A large scale dye back of P. pinaster took place in the 70s due to the com-bined impact of marine aerosol and surfactants. Currently, the P. pinaster area is under a large scale attack of the maritime pine bast scale (Matsucoccus feytaudi) and is going to be transformed into a more natural land cover with dominant Q.ilex.
2.2.23 Tolfa (IT-Tol)
The Tolfa-Allumiere site (42.18967° N; 11.92155° E) is an evergreen broadleaf managed forest extending for about 6 ha, primarily characterized as Mediterranean Macchia and located in a small and isolated mountainous chain in Central Italy, close to the Tyrrhenian Sea. The elevation is 422 m.a.s.l. and the climate is
essentially Mediterranean with a small increase in precipitation during autumn and spring, essentially driven by local meteorological circulation and updraft. The aver-age annual precipitation is 650 mm while the averaver-age annual temperature is 15 °C. The site has been set up as part of a large scale manipulation experiment called LASMEX in the framework of EU-funded MIND project which aimed at studying the effect of increased or decreased precipitation intensities on Mediterranean eco-systems through rain exclusion or irrigation. This specific site is the reference site with unmodified precipitation regime. The vegetation is a coppice rotation primar-ily composed by Arbutus unedo L. (65 %) and Erica arborea L. (13 %) and sec-ondarily by Fraxinus ornus L. and Quercus ilex L. The entire canopy grew up after fire events occurred on site in 1984. The soil is of volcanic origin and classified as Andosols, with an average depth of around 30 cm and acid (pH = 4).
2.2.24 Torgnon (IT-Tor)
The site, active since June 2008, is an old grazed pasture abandoned in late 1990s in the northwestern Italian Alps. It is located a few kilometers away from the village of Torgnon in the Aosta Valley region at an elevation of 2,160 m.a.s.l. (45.84444° N; 7.57806° E).
The dominant vegetation is composed by Nardus stricta L., 35 %, Festuca
nigrescens All. 11 %, Arnica montana L. 8 %, Carex sempervirens Vill. 5 %,
Geum montanum L. 5 %, Anthoxanthum alpinum L.L. 4 %, Potentilla aurea L. 4 %, Trifolium alpinum L. 4 %. Considering canopy properties, maximum sea-sonal LAI is about 2.9 and average canopy height is 18 cm. The terrain slopes gently (4 °) and the soil is classified as Cambisol (WRB classification), with the following characteristics in the 0–20 cm horizon: organic C = 2.8 kg C m−2 and
total N = 0.22 kg N m−2.
The site is characterized by an intra-alpine semi-continental climate, with strong seasonality, the average annual temperature is of 3.1 °C and the average annual precipitation is of about 880 mm. On average, from the end of October to late May, the site is covered by a thick snow mantle (90–120 cm) which limits the growing season length to four-five months. Growing season cumulative precipita-tion can show huge variaprecipita-tions (from 160 to 630 mm) and the average daily air temperature varies between 4 and 13 °C.
2.2.25 Valle dell’Adige (IT-VdA)
The Valle dell’Adige site is located in a vineyard in the Valle dell’Adige (46.19678° N; 11.11354° E; Mezzolombardo) at an altitude of 206 m.a.s.l. The average annual air temperature is 11.8 °C while the average annual precipitation is 822 mm. The soil was classified as a Gleyic/Haplic Fluvisol (FAO 2008) with the following characteristics in the 0–30 cm horizon: sand 42 %, silt 47 %, clay
11 %, total soil organic content (SOC) = 5.85 kg C m−2, total N = 0.66 kg N m−2,
bulk density 0.96 g soil cm−3. The vineyard covers an area of approximately
2.5 × 1 km cultivated with Vitis vinifera L. cultivar “Teroldego rotaliano”, and includes small patches of apple trees. The vegetation is about 2.0 m tall with more than 50 % ground shading. Mass and energy fluxes have been continuously meas-ured since 2008 at the site with an Eddy Covariance system mounted at 7 m height. The growing season starts in the middle of March and lasts until the end of September with maximum carbon dioxide uptake at the end of April (for high radiation and water availability) and in July. During the winter season (from October to March) the vineyard acted as a carbon source.
2.2.26 Vigevano (IT-Vig)
The experimental site is located near the town of Vigevano (45.29591° N; 8.87554° E, 117 m.a.s.l.) in the Lombardy Region, in the Province of Pavia and it consists of a poplar short rotation coppice (SRC) (P. generosa × P. nigra clone Pegaso) of about 80 ha. The traditional agricultural land use of the area is a corn-rice rota-tion transformed into SRC in March 2004 by planting one year old seedlings in a double row design with a spacing of 2.8 × 0.75 × 0.45 m corresponding to a den-sity of 12.500 plants ha−1. Before planting, soil was ploughed and disk-harrowed.
After planting, a pre-emergent herbicide was applied at 2 kg ha−1 with a pull type
sprayer. In the following years weed control was done mechanically four times in spring and summer with a rototiller. From May to September the experimental field was irrigated with a volume of water of 1,500 m−3 ha−1. Poplar shoots were
har-vested and chipped annually during winter with a special harvester and used in a nearby incinerator for energy production. No fertilizer was applied during the first three years of SRC cultivation. The soil is from fluvial sediments and has a sandy loam texture (53 % sand, 30 % silt and 17 % clay), bulk density is 1.21 g cm−3,
pH (H2O) is 6.5 in the uppermost 32 cm. The net primary production (NPP) as
measured as sum of stem+branch, coarse roots, fine roots, stump, leaf litter and fine root litter increased in 2004–2006 from 0.69 to 1.05 to 1.3 kg C m−2 year−1.
The height of the canopy reached 4.5 m in one year, the LAI peaked in July-August at 4.2. The average specific leaf area (SLA) of poplar leaves was 296.56 (±60.09) cm2 g DM−1. The climate of the site is classified as Humid
Subtropical-Mid Mild Latitude (Cfa)—Koppen Climate Classification, with an average annual rainfall of around 1,000 mm and an average temperature of about 12.5 °C.
2.3 Example of Measurements
The NEE measurements using the Eddy Covariance technique are typically half hourly average values expressed in μmol CO2 m−2 s−1. The data can be clearly
general as g C m−2 day−1. By convention, negative values are fluxes going from
the atmosphere to the ecosystem (carbon sink).
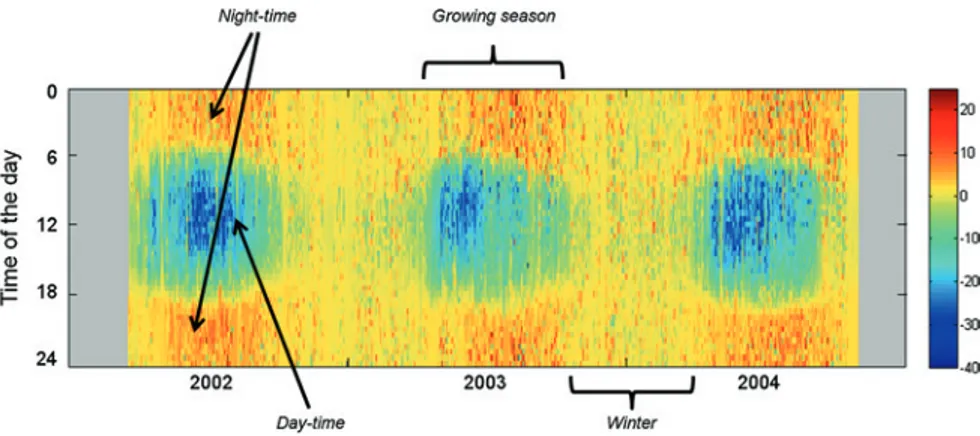
One of the best ways in order to have a graphical overview of the measure-ments is the “fingerprint” plot (Fig. 2.2): it is an image where on the X axis there are the days, on the Y axis the hours and the color indicate the flux magnitude and sign. Using this type of plot it is possible to easily follow and analyze the diurnal, seasonal and inter annual patterns and identify anomalies.
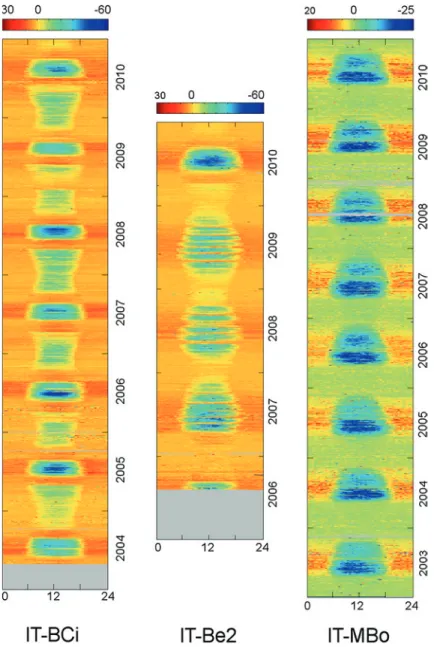
The Fig. 2.3 shows the comparison of two cropland sites (IT-BCi cultivated with maize all the years and IT-Be2 cultivated with alfalfa in 2007–2009 and maize in 2010) and it is possible to see the effect of the management options: till-age before the carbon uptake period (CUP) in IT-BCi, the four harvest in 2007– 2009 in IT-Be2 and the difference in the magnitude of the uptake, with the maize reaching higher values (C4 photosynthesis) in IT-BCi and also in IT-Be2 in 2010 (see Sect. 2.2.2). In the same figure a grassland site with a long time series of data is also reported (IT-MBo) and it is possible to identify the differences in the sea-sonal cycle with a winter basically without activities because of the snow and cold temperature.
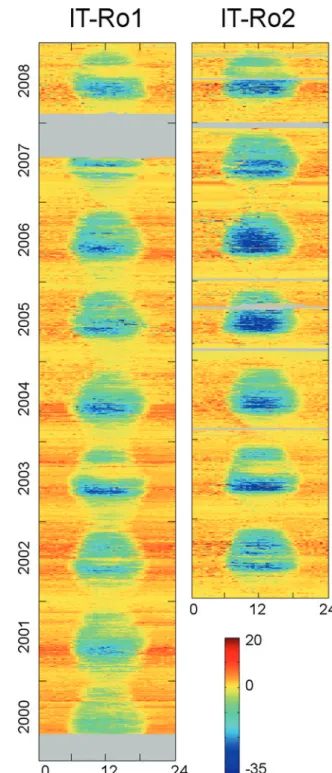
Another interesting example is given by the comparison of the two oak coppice forests in central Italy (Fig. 2.4). The two sites are in two compartments with dif-ferent ages with IT-Ro1 monitoring a forest just after the harvesting occurred in 2000 and IT-Ro2 in an older forest now ready to be harvested. It is interesting to note that the fluxes are higher in the mature forest but also the young stand recov-ered quite rapidly a good photosynthesis capacity. In addition in both the stands it is possible to see the effect of the heat-wave in 2003 (Ciais et al. 2005) with a strong reduction of the carbon assimilation in summer and a similar anomaly also in 2008.
Fig. 2.2 Example of fingerprint plot to visualize Eddy Covariance time series. The colors are
instantaneous (half hour) CO2 fluxes in µmol CO2 m−2 s−1 (site IT-PT1). It is possible to see
clearly the seasonal dynamic with emissions of CO2 during winter when only respiration is
pre-sent and the diurnal cycle with CO2 assimilation in the daytime. The minor CO2 uptake in the
Fig. 2.3 Comparison of two cropland sites: IT-BCi cultivated with maize all the years and
IT-Be2 cultivated with alfalfa in 2007–2009 and maize in 2010. The colors are instantaneous (half hour) CO2 fluxes in umol CO2 m−2 s−1. It is possible to note the different magnitude of
the uptake between the two species and the effect of the management practices. The third site (IT-MBo) is a grassland site and it is interesting to note the low fluxes during winter and the growing season characterized by two assimilation picks
Fig. 2.4 Comparison
of the two forest sites in Roccarespampani: IT-Ro1 and IT-Ro2 are in two different compartments with different stand ages but it is possible to identify common patterns (2003 and 2008) and seasonal dynamics. In addition to this, it is possible to see in IT-Ro1 the recovery of the forest after the harvesting in 2000. The
colors are instantaneous (half hour) CO2 fluxes in μmol
2.4 Analysis of Climate-Carbon NEE Interactions
The long time series of Carbon NEE, meteorological variables and ecosystem status characteristics measured by the Italian network of Eddy Covariance sites can be used to analyze the interactions between climate and ecosystem processes. Understanding the driver factors controlling the capacity of terrestrial ecosystems to store carbon is extremely important in the context of climate variability and climate changes processes.
Carbon fluxes measured at the Italian sites have been used to analyze the role of the main meteorological variables and length of the CUP in the annual NEE across sites and the inter annual variability.
2.4.1 Quality Criteria and Data Selection
The annual NEE has been calculated as the median of the four cumulative values of daily NEE time series that have been routinely produced in the Carbo Italy database using different processing approaches (gap filling and storage correction). Uncertainty of annual NEE (NEEmax–min) has been instead estimated as the difference between the
maximum and minimum cumulative values of the four daily NEE time series.
Two quality criteria have been used to select site years to be included in the analysis. The first quality check excludes site years with less than 330 days of data. The second criteria is based on the quality flags of daily NEE time series (defined in Reichstein et al. 2005) that indicate the percentage of high original measurements for each daily NEE value or high quality gap filled data: in particu-lar a site year is discarded if any of the four NEE versions has a within year per-centage of low quality days (daily quality flag < 0.85) higher than 25 %.
The application of these quality criteria resulted in a dataset for analysis which includes 22 cropland (CRO) site years, 26 deciduous broadleaf forest (DBF), 18 evergreen broadleaf forest (EBF), 27 evergreen needle leaf forest (ENF) and 14 grassland (GRA).
2.4.2 Relationships Between Carbon Uptake Period
Duration and Annual Net Ecosystem Exchange
The analysis of the relationship between annual cumulated NEE and the duration of the CUP has been conducted aggregating site years according to PFT. CUP for all site years has been computed as the number of days with daily NEE < −1 g C m−2 d−1.
A linear regression analysis at PFT level has been conducted in order to evaluate annual NEE sensitivity to CUP. Data have been weighted according to the uncertainty estimates (NEEmax–min) defined as described in Sect. 2.4.1.
Results of the linear regression analysis between annual NEE and CUP are reported in Fig. 2.5. Higher R2 values are obtained for EBF, ENF and GRA as
Fig. 2.5 Linear regression analysis between NEE annual values and CUP for each PFT. Panel f
presents the sensitivity (red bars with s.e.) and R2 (grey bars) of the relation between NEE and
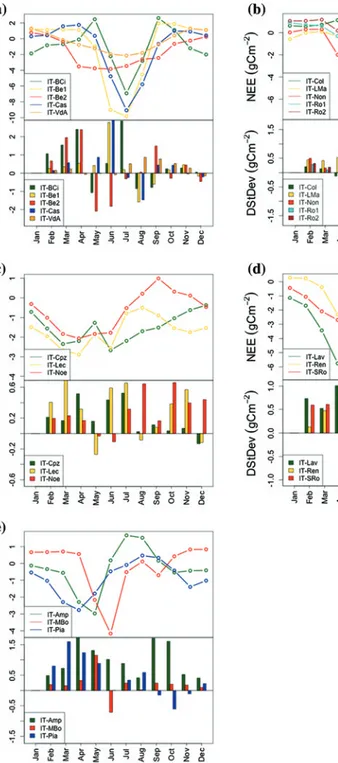
Fig. 2.6 Time series of average monthly NEE for the period reported in the database for each
site (upper panel); barplot of DStDev over the observation period (lower panel). Different bars represent different sites. Different plots represents different PFTs
of the large variability of ecosystems traits of sites that are included in this PFT; in fact the DBF sites in the networks are highly heterogeneous, with mature for-ests (IT-Col), coppices with different ages (IT-Ro1 and IT-Ro2) and a poplar plan-tation (IT-PT1). PFT annual NEE sensitivity to CUP variations range between
−2.97 ± 0.64 for CRO and −3.80 ± 0.56 C m−2 yr−1 day−1 for GRA.
Within some PFTs, sites with particular behaviors emerged (e.g. IT-Cpz for EBF and IT-Pia, included in this analysis in the grassland PFT) probably because of the effect of some site properties (in IT-Cpz for example there is the effect of the water table depth) or ecological parameters (e.g. LAI, fertility, …) on the rela-tion between annual NEE and CUP. These effects generally resulted in a similar NEE sensitivity to CUP variations but with different absolute values.
Moreover CRO and GRA, PFTs where management can play an important role, showed quite good relationship between NEE and CUP and sensitivity values sim-ilar to those obtained in the other PFTs (Fig. 2.5a, e).
2.4.3 Analysis of the Relationship Between Annual NEE and
Climate Variables
The analysis of the relationship between annual cumulated NEE and climate vari-ables has been conducted by aggregating site years according to the PTF. The analysis has been conducted in three different steps:
1. As a first attempt, a correlation analysis between annual NEE and average annual climate variables has been conducted. As climate variables temperature, precipitation, radiation and vapor pressure deficit (VPD) have been used. 2. In a second step, the stepwise regression has been used for the selection of the best
predictive variables of annual NEE. The predictive variables tested were meteoro-logical variables (T, Prec, VPD, Rg), LAI- and phenometeoro-logical indicators (i.e. CUP). A stepwise approach based on the Akaike’s Information Criterion (AIC) for model selection has been implemented. The AIC is a measure of the trade-off between the goodness-of-fit (model explanatory power) and model complexity (number of parameters). Therefore, the stepwise based on AIC is a multiple regression method for variable selection which accounts on one hand for the model explanatory power, and on the other for the increasing complexity of the model when addi-tional variables are tested in the multiple regression model (Venables and Ripley 2002; Yamashita et al. 2007). The stepwise AIC was preferred to other stepwise methods for variable selection since it can be applied to non-normally distributed data (Yamashita et al. 2007). The data have been weighted according to the uncer-tainty estimates (NEEmax-min), defined as described in Sect. 2.4.1 The outcome of
the stepwise AIC is a multiple linear model including the best set of predictive variables explaining the variability of annual NEE. Therefore, by applying step-wise AIC as explained above, the drivers explaining the variability of NEE for each PFT have been identified while the coefficients estimated for each selected variable represent the sensitivity of NEE to variations of each predictor.
3. In the third analysis, the inter-annual variability has been analyzed defining for each site with more than 3 years of data, the phenological period that mostly contribute to annual NEE variability. Following Marcolla et al. (2011), for each site-year the time series of cumulative monthly NEE and its standard deviation have been computed. According to Marcolla et al. (2011), variations of standard deviation from one month to the preceeding one (DStDev) quantifies the contri-bution of each month to the observed interannual variability (IAV). The analysis has been conducted also at weekly time scale with comparable results (data not shown). Resulting DStDev positive values means that the specific period con-tributes to the increase of the between year flux variability. Positive peaks of DStDev mean that climatic conditions in the period in which the peak occurs largely influence the inter annual variability. Periods with negative values of DStDev tend instead to mitigate the inter annual variability of NEE. Once the critical period for each PFT has been identified, the stepwise AIC regression between annual NEE and different predictors has been re-computed. Not only have the average annual values of climate predictors been tested, but also sub-annual variable aggregation (i.e. average temperature in spring and summer; cumulative precipitation in summer etc.). For each PFT the main driver control-ling spatial and year-to-year variation in NEE has then been identified.
The results of the pair wise correlation analysis between annual NEE and climate variables conducted for each PFT are reported in Table 2.1. The results show that average annual climatic variables cannot explain the variability of NEE except for the EBF, for which a statistically significant correlation (p < 0.05) with Ta, Ts and Rg have been found and for ENF, for which a correlation between NEE and Soil Water Content (SWC) is observed.
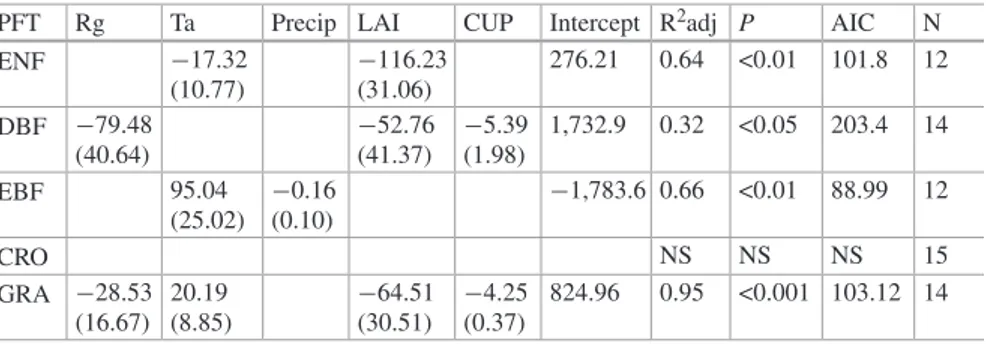
In Table 2.2 the results of the stepwise AIC regression between cumulative NEE and annual climatic predictors are reported. Even including multiple climate predictors, a statistical significant correlation with NEE is observed only for the evergreen PFTs (EBF and ENF).
By including as predictors the CUP and LAI, an important improvement of the R2adj has been observed, highlighting the importance of structural site
Table 2.1 Pairwise correlation (r) between annual NEE cumulated and annual average of
mete-orological variables
Bold numbers represent statistical significant correlations (p < 0.01). Rg Shortwave Incoming Radiation, Ta Air Temperature, Ts Soil Temperature, VPD Vapur Pressure Deficit,
Precip Precipitation, SWC Soil Water Content
Rg Ta Ts VPD Precip SWC ENF 0.01 0.00 0.00 0.00 0.00 0.44 DBF 0.02 0.00 0.01 0.01 0.03 0.02 EBF 0.49 0.70 0.58 0.01 0.08 0.04 CRO 0.03 0.00 0.03 0.09 0.04 0.02 GRA 0.26 0.00 0.02 0.01 0.00 0.21
characteristics and phenology in determining the spatial and temporal variability of annual NEE (Table 2.3).
The results of the DStdev computed for each site and grouped for PFT are reported in Fig. 2.6. The time series of DStDev highlights the period that mostly contribute to the inter annual variability of NEE at each site (hereafter referred as the critical period).
As an example, the DStDev computed for IT-MBo site (Fig. 2.5e) shows an abrupt increase in DStDev at the onset of the growing season indicating that this period has an important role in the IAV definition. Marcolla et al. 2011 concluded that climatic conditions and snow cover in late spring largely influence the inter-annual variability of NEE of this alpine grassland, and that the first half of the growing season at IT-MBo mitigates the IAV thanks to the negative correlation (R = −0.77) between the timing of snowmelt and the rate of carbon uptake at the beginning of the growing season. A second peak of DStDev due to the variable timing of the meadow cut has been observed, emphasizing the important role of management in controlling the inter annual variability.
The results show that for almost all the PFTs the critical period for the IAV occurs during the spring transient of NEE, when carbon uptake begins after winter, and in some water limited sites at the end of the growing season in late summer. Table 2.2 Results of model selection conducted with the stepwise AIC method using as
predic-tor annual averages of meteorological variables
Coefficients, their standard errors and the statistics of the best model selected are reported. Ta Air Temperature, Precip Precipitation, AIK Akaike’s Information Criterion, NS not significant
PFT Ta Precip Intercept R2adj P AIC N
ENF 13.08 (8.52) −0.33 (0.15) −456.3 0.36 <0.001 108.6 12
DBF NS NS 14
EBF 95.04 (25.02) −0.16 (0.10) −1,783.59 0.66 <0.01 88.99 12
CRO NS NS 15
GRA NS NS 14
Table 2.3 Results of model selection conducted with the stepwise AIC method using as
predic-tor annual averages of meteorological variables, LAI and CUP
Coefficients, their standard errors and the statistics of the best model selected are reported.
Rg Shortwave Incoming Radiation, Ta Air Temperature, Precip Precipitation, AIK Akaike’s Information Criterion, NS not significant
PFT Rg Ta Precip LAI CUP Intercept R2adj P AIC N
ENF −17.32 (10.77) −116.23 (31.06) 276.21 0.64 <0.01 101.8 12 DBF −79.48 (40.64) −52.76 (41.37) −5.39 (1.98) 1,732.9 0.32 <0.05 203.4 14 EBF 95.04 (25.02) −0.16 (0.10) −1,783.6 0.66 <0.01 88.99 12 CRO NS NS NS 15 GRA −28.53 (16.67) 20.19 (8.85) −64.51 (30.51) −4.25 (0.37) 824.96 0.95 <0.001 103.12 14