UNIVERSITA DEGLI STUDI DI VERONA
GRADUATE SCHOOL OF ECONOMICS AND MANAGEMENT
OF THE UNIVERSITIES OF VERONA, PADUA AND
CA’FOSCARI VENICE
Three Essays in Health Economics
Supervisor: Prof. Martina Menon
List of Acronyms
CHE – Catastrophic Health Expenditures DID – Difference in Difference
FFC – Fairness of Financial Contribution GEL – Georgian Lari
HH – Households
MAP – Medical Assistance for the Poor
EMAP – Expanded Medical Assistance for the Poor MOH – Ministry of Health
NBER – National Bureau of Economic Research OOP – Out-of-Pocket Expenses
OOPHE – Out-of-Pocket Health Expenditure PSM – Propensity Score Matching
SSA – Social Service Agency UHC – Universal Health Coverage WTO – World Trade Organization
iii
Abstract
This dissertation comprises three chapters on health economics, which analyses the existing problems in Georgia's healthcare system and offers specific recommendations for policy makers.
The first chapter, “Household Catastrophic Health Expenditure in Georgia and its Policy Implication” is a single authored paper. The main purpose of the aforementioned paper is to identify the factors affecting the prevalence of catastrophic healthcare expenditures (CHE) in Georgia and to evaluate the Fairness in Financial Contribution index (FFC) for the fourth quarter of 2015. By using the Integrated Household Survey Database of the National Statistics Office of Georgia, the research predicts the probability of occurrences of catastrophic health expenditure via the Logistic Regression Model and methodology developed by Xu (2005). According to the results, in 2015, the FFC index equaled 0.82 illustrating that it had been worsening since 2007 (when the FFC index equaled 0.72). Existing deterioration may be explained by the launch of the Universal Health Coverage program, introduced in 2013, offering similar insurance packages both to poor and rich households. The quintile for the poor, 3.5%, is more likely to face catastrophic health expenditures, compared to the higher income quintile groups, while the main factors causing catastrophic health expenditure are the costs associated with the chronically ill, and inpatient and outpatient treatments. To improve the fairness of the Georgian healthcare system, this research suggests focusing on segments of the poor population by expanding the size of their healthcare package.
The second chapter, “Moving towards a Universal Health Coverage System: Lessons from Georgia and its Policy Implications” is the main paper of the dissertation. Which studies the effects of Expanded Medical Assistance for Poor (EMAP) and the Universal Health Coverage (UHC) programs in Georgia on healthcare utilization rates and the financial burden of the population. In 2012, the Georgian government expanded its existing program, Medical Assistance for the Poor (MAP), by including pensioners, children under five and students. In 2013, Georgia subsequently moved to the UHC program from targeted healthcare
iv
insurance schemes. Since the initial implementation of the government’s initiative there has been no research assessing the impact of EMAP or UHC. Before 2012, the main recommendations of the existing research analyzing Georgia’s healthcare system was to focus on the most impoverished part of society and improve their insurance packages. Despite this, Georgia introduced UHC in 2013, instead of directing additional funds to vulnerable groups- offering better services, including medicinal benefits. The main objective of this paper is to evaluate the relevance of the decision of the Georgian government to move toward UHC in 2013 by comparing the effects of EMAP and UHC. Based on integrated data from the National Statistics Office of Georgia and using difference in difference (DID) with a matching methodology, this study reveals that EMAP had a positive effect in terms of utilization rates, but had no effect on the financial burden of participant households.
In 2012-2013 there was a 6% increase in inpatient and outpatient utilization rates. While, in evaluating the pure effect of UHC, there were no statistically significant changes in terms of healthcare service utilization or the financial burden on households without pensioners, children under five or students. The main recommendation for policy-makers is to target its budgetary resources on the most vulnerable part of society and to cover only catastrophic health expenditures for other households in need. Furthermore, it is recommended that pharmaceutical benefits be included in insurance packages, as it is currently the main out-of-pocket healthcare expenditure (OOPHE).
The third chapter, “Analyzing the Composition of Catastrophic Health Expenditures in Georgia (2012-2015)”, is also a single authored paper. The main purpose of the study is to identify the composition of OOPHE which cause catastrophic health expenditure and to measure the incidence and intensities of catastrophic payments in 2012 and 2015 through the World Bank Methodology. By using the Integrated Household Survey from the National Statistics Office of Georgia’s database, the study illustrates that pharmaceutical costs have a significant share in OOPHE. Moreover, medication appears to be the chief cause of
v
household catastrophic health expenditures, as a vast 72% of CHEs are prescription related expenses.
Furthermore, those households suffering with chronically diseased or disabled members spend 79% of their OOPHE on medicine, herewith the extent of pharmaceutical costs of OOPHE for the poor quintile is 84.7%: 16.1% greater than the rich quintile. The situation is comparable for outpatient treatments, where the proportion of medicinal expenses in OOPHE is 44%. In the case of poor households’, the share amounts to 57%, which is 21.3% over the rich quintile. An analysis of these incidences illustrates that the poorest quintile group’s catastrophic expenditures accounted for 16.6% in 2015, while it was 13.2% in 2012. Though, the fraction of money spent by households belonging to said quintile does not experience significant changes. Accordingly, as pharmaceutical costs cover such an extent, this policy paper offers its recommendations to the provision of whichever prescription benefits packages shall be the primary policy objective for the government, in order to truly protect poor households from financial ruin.
vi
Acknowledgments
I would like to express my gratitude to my supervisor, Professor Martina Menon for sharing her experience with me, giving accurate advice on many diverse issues during the process of writing my dissertation. I have benefited from her ideas and experience, intensive interactions and comments, which have helped me advance my research.
I am especially grateful to Mr. Michael Grossman as he allowed me to work at the National Bureau of Economic Research (NBER) during my stay in New York. This experience aided the development of my skills in various ways and has enhanced my research abilities, enabling me to initiate and fully accomplish my dissertation. As well as giving the opportunity to attend Health Economic Courses at the graduate school of the City University of New York. This academic perspective broadened my knowledge and understanding of this particular field. I would like to thank my colleagues for sharing their ideas on my research, as well as giving their professional advice on further developments.
vii
Contents
Abstract iii Contents vii List of Figures ix List of Tables ix1. Household Catastrophic Health Expenditure in Georgia and its Policy Implications………1
1.1. Introduction………..2
1.2. Data description and Methodology specification……….3
1.3. Results………..…9
1.4. Conclusion and policy implication……….11
References 2. Towards Universal Health Coverage system: Lessons Learnt from Georgia and its Policy Implications ………...……..18
2.1. Introduction………19
2.2. An Analysis of the Existing Research………20
2.2.1. The Georgian Experience………...…….21
2.3. Data………...….24
2.4. Methodology.……….………25
2.4.1. Control and Treatment Groups………25
2.4.2. Limitations………...25
2.4.3. Method I – DID with Covariates……….26
2.4.4. Method II – DID with PSM and covariates……….…27
2.4.5. Method III – DID with four grouping PSM and covariates………28
2.5. Results and Discussion………… ………..30
2.6. Conclusion………..33
References 3. Analyzing the Composition of Catastrophic Health Expenditures in Georgia (2012-2015)……….…...62
viii
3.2. Data description and methodology specification………...65 3.3. Results and Discussion………...69 3.4. Conclusion and policy implication……….72 References
ix
List of Figures
2.1. Measuring the UHC program through three dimensions……….36 2.2. The Difference between the Planned and Actual State Budget in 2013,
2014 and 2015………..36 3.1. Shares of Health Payments in 2012 and 2015………...……...76
List of Tables
1.1. Key Indicators by Consumption Quintile (HH’s Level Data) ………….12
1.2. HH’s Monthly Expenditure Characteristics Mean (99 % CI)…………..13
1.3. Share of HH’s by Quintile Groups, Facing Different Levels of Health
Expenditure at Different Cut-off Points (99% CI for Cut-off Points)………..13
1.4. Share of HH’s by Region Groups, Facing Catastrophic Health
Expenditure (99 % CI)……… ………14
1.5. Estimated Coefficients in OLS and Logistic Model for Catastrophic Health Care Expenditure (HH’s data)………..………14 2.1. Variable Names and Definitions ……….35 2.2. CPI - Adjusted Costs by Years ………..…..37 2.3. Distribution of Registered Households Across Different Score Groups..37 2.4. Distribution of Households where One Member has Private Insurance 2011-2015………37 2.5. Service Packet Coverage ……….38 2.6. Distribution of Observations among Groups 2011-2015……...………..39 2.7. Illustration of Selection Bias in 2011/Characteristic Differences Between
Groups ………...………..40 2.8. Illustration of Selection Bias in 2012/Characteristic Differences Between Groups ………..………...41 2.9. Illustration of Selection Bias in 2013/Characteristic Differences Between Groups ………..………...42 2.10. Illustration of Selection Bias in 2014/Characteristic Differences Between Groups………..43 2.11. Illustration of Selection Bias in 2015/Characteristic Differences Between Groups………..44 2.12. Differences within Groups Across Time (Education, Family size, Comfort)………...45 2.13. Differences within Groups Across Time (Urban, Age70, Chronic)…...46 2.14. Differences within Groups Across Time (Quintile 1,2,3) ………..…….47 2.15. Differences within Groups Across Time (Quintile 4,5) ………..48
x
2.16. Balance Test for Treatment Group 1 (2011, 2012, 2013) ………….…..49
2.17. Balance Test for Treatment Group 1 (2014, 2015)………..50
2.18. Balance Test for Treatment Group 2 (2011, 2012, 2013)………51
2.19. Balance Test for Treatment Group 2 (2014, 2015)………..52
2.20. Differences within Groups Across Time after PSM………53
2.21. Differences within Groups Across Time after Four Grouping PSM…....53
2.22. Results for Treatment Group 1 (Financial Variables)………..54
2.23. Results for Treatment Group 1 (Utilization Variables)………55
2.24. Results for Treatment Group 2 (Financial Variables)………..56
2.25. Results for Treatment Group 2 (Utilization Variables)………57
2.26. Descriptive Statistics for the Control and Treatment Group 2 in 2012-2013- Adjusted Using the Four Grouping PSM………...58
2.27. Descriptive Statistics for the Control and Treatment Group 2 in 2012-2014- Adjusted Using the Four Grouping Propensity Score Method…..58
2.28. Descriptive Statistics for the Control and Treatment Group 2 in 2012-2015- Adjusted Using the Four Grouping Propensity Score Method…..58
2.29. Descriptive Statistics for the Control and Treatment Group 1 in 2013-2014- Adjusted Using the Four Grouping Propensity Score Method…..59
2.30. Descriptive Statistics for the Control and Treatment Group 1 in 2013-2015- Adjusted Using the Four Grouping Propensity Score Method...59
3.1. General Statistics………..74
3.2. Incidence and Intensity of Catastrophic Health Payments, Using food………...75
3.3. Distribution-sensitive Catastrophic Payments Measures, Using Non-food………...76
3.4. Compositions of OOPHE……….77
3.5. OOPHE spending as a share of food and OOP share of non-food………...77
1
Chapter 1
Household Catastrophic Health Expenditure in
Georgia and its Policy Implications
Abstract
The main purpose of the present research is to identify the factors affecting the prevalence of catastrophic healthcare expenditure in Georgia and to find the Fairness in Financial Contribution index (FFC) for the fourth quarter of 2015. By using the Integrated Household Survey Database of the National Statistics Office of Georgia, the present research predicts the probability of occurrences of the catastrophic health expenditure via the methodology and the Logistic Regression Model developed by Xu (2005). The results reveal that, in 2015, the FFC index equaled 0.82, illustrating that it had been worsening since 2007 (when the index equaled 0.72). The deterioration may be explained by the launch of the UHC program, introduced in 2013, which offered comparable insurance packages both to poor and rich households, without a means testing approaches. The poor quintile is 3.5% more likely to face catastrophic health expenditures compared to the higher income quintile groups, while the main factors causing catastrophic health expenditure are costs associated with the chronically ill, and inpatient and outpatient treatments. To improve fairness within Georgia’s healthcare system, this present research suggests focusing on the population’s poorest members by expanding the size of their healthcare packages, for instance by incorporating prescription benefits.
2
1.1. Introduction
Fairness in financial contribution is determined by WHO (2000) as an intrinsic goal of health systems. Fairness in financial contribution and the protection against financial risk is based on the notion that every household should pay a fair share of their health costs. The FFC index reflects the overall inequality in households’ financial contributions into the health system. According to Xu’s (2005) highly discussed paper, health policy makers have long been concerned with protecting people from the possibility that ill health will lead to catastrophic financial payments and subsequent impoverishment.
The Fairness in Financial Contribution index measures whether a country collects contributions from households to finance health in an equitable manner (WHO, 2000), which notably is a common and developing problem within the process of designing and implementing healthcare systems of low and lower middle income countries like Georgia (Zoidze et al., 2012). Gotsadze et al. (2009) measured an FFC index for Georgia equating to 0.82, showing that Georgia, in 2007, had a relatively fair healthcare financing system compared to equivalent country peer groups.
Alongside measuring the FFC index, the necessity of determining the factors for catastrophic household health expenditures in Georgia were further discussed within Gotsadze’s et al. (2009) paper. The Research has identified Georgia as having one of the most unprotected healthcare financing systems, along with other transitional countries (Azerbaijan, Ukraine, Vietnam and Cambodia) which feature a similarly high rate. To reduce catastrophic health expenditures, Gotsadze’s et al. (2009) research suggested a greater focus on poor segment of the population by expanding government financed benefits for the poor and chronically ill, including, and broadening, inpatient coverage and implementing medication benefits. The focus on priority groups, and specifically on the poor, is a common feature of health financing reforms in other low and middle-income countries, including Cambodia (Leemput et al., 2007), China (Meessen, 2008), Indonesia (ILO, 2004), Mexico, the Philippines, Vietnam (Jowett et al., 2007), and Tunisia (Arfa & Achouri, 2008).
In 2007, the Georgian healthcare system provided assistance to the poorest sections of the society. Gotsadze’s et al. (2009) and Zoidze’s et al. (2012) papers measure the FFC index in
3
Georgia and analyze influences on catastrophic health expenditures. However, in 2013, the Georgian government launched the Universal Health Coverage program, since then, there has been no pertinent research determining either the FFC index in Georgia, its alternation, or identifying the factors that affect occurrences of catastrophic expenditure. The present research paper is aimed at analyzing the main factors triggering catastrophic health expenditures and at providing the necessary recommendations for policy makers for its reduction.
The study considers the following questions: 1. What are the main factors affecting occurrences of catastrophic healthcare expenditure at the end of 2015? And, showing whether these factors have changed since the previous research, conducted in 2007; 2. Did the FFC index change between 2007-2015? To answer these questions, the present study uses the Integrated Household Survey Databases of the National Statistics Office of Georgia. Utilizing the distribution of health payments and the catastrophic expenditures methodology developed by Xu (2005), alongside the Logistic Regression Model, it is possible to predict the probability of the frequency of catastrophic health expenditure.
The present paper is structured as follows. Section 2 focuses on the data and the specification of the methodology. Section 3 presents the results of the research. While, section 4 discusses policy implications and offers a conclusion.
1.2. Data Description and Methodology Specification
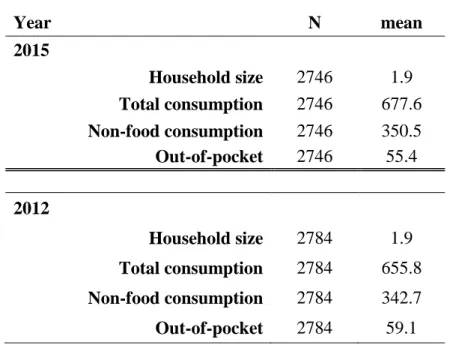
This study uses the Integrated Household Survey Databases of the National Statistical Office of Georgia from the fourth quarter of 2015. The data includes the average monthly expenditure, OPP health expenditure, geographical variables, and the socio-economic characteristics of each household, such as age, gender, and education. The total number of observations is 2746: where each household remains in the sample for one year, and four interviews are conducted during this period. As the survey only uses information from the fourth quarter of 2015, there is no reiteration of households in the database.
In the process of the construction of the FFC index, the present study uses the equivalent size of the household, which is directly created by the National Statistics Office of Georgia. This variable is calculated for each household. The indicator depends on the sex and age of household
4
members. There are six groups based on sex and age, each of which have corresponding weights: Children (aged 0-7) with coefficient 0.64; Adults (aged 8-15); Working age males (aged 16-64) with coefficient 1; Working age females (aged 16-59) with coefficient 0.84; Pension age males (aged 65 and over) with coefficient 0.88; and Pension age females (aged 60 and over) with coefficient 0.76. The corresponding coefficients are assigned to every household member and then calculated for each household.
The number of equivalent adults with scale (cohabitation) effect is calculated for each household. Indicators are calculated on the base of -0.6 coefficients. Scale (cohabitation) effect signifies that the expenditures of two households with one member is greater than the expenditure of one household with two members, because certain types of expenditures (rent, utility payments, etc.) are common for all household members. In the case of a single member household, the indicator does not change and is equal to the number of equivalent adults, while in all other cases, the indicator is equal to the number of equivalent adults to the power of 0.6.
With regard to health variables, the data identifies households with a chronically sick or disabled member. This is a dummy variable, equal to 1 if the household has a chronically sick or disabled member and 0 otherwise. The data also includes utilization variables such as: inpatient and outpatient variables that are identified subsequent to a National Statistics Office survey question. The following question was asked: did any member of the household use inpatient or outpatient services within the last three months? This dummy variable equals 1 if the household had used these services and to 0 otherwise. The present study also utilizes expenditure variables that measure both total expenditure and health expenditure of a household.
In 2013, the Georgian health system experienced significant changes by transitioning to Universal Health Coverage (UHC) from a targeted healthcare program, which provided governmental support to the poor and targeted groups such as children aged (0-5), elderly people, students, children with disabilities and persons with extreme disabilities. Under this health system, these targeted groups held a basic insurance package provided by the government.
In 2013, by moving to UHC, the government of Georgia realized its 2012 pre-election promise: “Free Insurance for all”, however there were no significant changes to the insurance packages. It is noteworthy that in 2013 the UHC program pilot version was lunched, which
5
covered several parts of Georgia. While by the end of 2013, the UHC program was wholly implemented and fully functional. Therefore, using data from 2013 to identify factors affecting occurrences of catastrophic expenditure would be irrelevant. Equally, data from 2014 would be insufficient for the study, as at the time, awareness of the program was relatively low in Georgia. Hence the study selected the latest available data, the fourth quarter of 2015, to identify the main factors behind catastrophic health expenditures.
Fairness in Financial Contribution
To estimate catastrophic health expenditures and measure the FFC index, this research uses the methodology developed by Xu (2005). The main notion behind FFC is that every household should pay their fair share, with fairness equating to greater contributions from those households with larger financial resources. Xu (2005) develops methods to measure catastrophic health expenditure and identifies how to construct all necessary variables to measure the FFC index.
To construct the FFC index, one needs to observe the following variables: 1. Household out-of-pocket heath expenditure (𝑂𝑂𝑃ℎ) 2. Household total expenditure (𝑒𝑥𝑝ℎ) and 3. Food Expenditure (𝑓𝑜𝑜𝑑ℎ) , which is the money spent on food items by a household, though expenditure on alcoholic beverages and tobacco are excluded.
Different types of methodologies exist to define the poverty line, and all of them have their own limitations, this study uses the food shared poverty line which is recommended by Xu (2005). This poverty line (pl) is defined as the food expenditure of a household whose food budget share is at the 50th percentile in the country. In order to minimize measurement errors, this paper uses the average food expenditures of households whose food share of total expenditure is within the 45th and 55th percentile of the total sample. Considering the scale
economy of household consumption, the household equivalence scale is used (a household’s equivalent size is defined by the National Statistics Office of Georgia).
𝑝𝑙 =∑ 𝑊ℎ∗ 𝑒𝑞𝑓𝑜𝑜𝑑ℎ
𝑊ℎ , 𝑤𝑖𝑡ℎ 𝑓𝑜𝑜𝑑45 < 𝑓𝑜𝑜𝑑𝑒𝑥𝑝ℎ < 𝑓𝑜𝑜𝑑55
where 𝑓𝑜𝑜𝑑𝑒𝑥𝑝ℎ is a household’s food expenditure share of the total expenditure; 𝑊ℎ is the weight of each household, 𝑒𝑞𝑓𝑜𝑜𝑑ℎℎ is the equalized food expenditure, which is defined as:
6
𝑒𝑞𝑓𝑜𝑜𝑑ℎℎ =
𝑓𝑜𝑜𝑑ℎ 𝑒𝑞𝑠𝑖𝑧𝑒ℎ
,
where 𝑓𝑜𝑜𝑑ℎ is the household food expenditure, while 𝑒𝑞𝑠𝑖𝑧𝑒ℎ is the equivalent household size.1 By using the poverty line, one can construct the subsistence expenditure for each household which is the poverty line multiplied by the equivalent size of household:
𝑠𝑒ℎ = 𝑝𝑙 ∗ 𝑒𝑞𝑠𝑖𝑧𝑒ℎ.
Using 𝑠𝑒ℎ, one can define a household’s capacity to pay, which is a household’s non-subsistence spending. When food expenditure is less than the substance of spending, it is possible to define the capacity to pay (cpt) as the difference between total expenditure and food expenditure. When food expenditure is more than the substance of spending, the capacity to pay will be the difference between total expenditure and the substance of spending:
𝑐𝑡𝑝ℎ = { 𝑒𝑥𝑝ℎ− 𝑠𝑒ℎ 𝑖𝑓 𝑠𝑒ℎ ≤ 𝑓𝑜𝑜𝑑ℎ, 𝑒𝑥𝑝ℎ− 𝑓𝑜𝑜𝑑ℎ 𝑖𝑓 𝑠𝑒ℎ > 𝑓𝑜𝑜𝑑ℎ.
Finally, using a household’s capacity to pay one can generate the main variable, which is used to find the FFC, the out-of-pocket health payments share of a household’s capacity to pay (oopctp):
𝑜𝑜𝑝𝑐𝑡𝑝ℎ = 𝑜𝑜𝑝ℎ
𝑐𝑡𝑝ℎ.
The distribution of households’ financial contributions across households has been summarized using the Fairness of Financial Contribution (FFC). This index is designed to weight heavily those households that have spent a very large share of their beyond subsistence effective income on health. The index thus reflects overall inequality in household financial contribution into the health system, and particularly reflects those households facing catastrophic health expenditure. The FFC is based on the mean of the cubed absolute difference between the oopctp a given household and the oopctp norm. The index is of the form:
𝐹𝐹𝐶 = 1 − √∑ 𝑤ℎ|𝑜𝑜𝑝𝑐𝑡𝑝ℎ− 𝑜𝑜𝑝𝑐𝑡𝑝0| 3 𝑛 ℎ=1 ∑ 𝑤ℎ 3 , Where:
7
𝑜𝑜𝑝𝑐𝑡𝑝0 =∑ 𝑤ℎ𝑂𝑂𝑃ℎ ∑ 𝑤ℎ𝑐𝑡𝑝ℎ
.
The FFC ranges between 0 and 1. The FFC index is close to 1 if each household’s OOPHE share of a household’s capacity to pay is close to the norm of OOPHE share of a household’s capacity to pay. Thus, the average household’s OOPHE (no matter which quintile group) is the same. When the FFC index is close to 1, it shows that a country has a fair financial system, because households’ OOPHE are more or less the same.
The Logistic Regression Model
In order to define the factors which cause catastrophic health expenditures, scholars commonly use the Logistic Regression Model (Akbar et al, 2015, Puteh & Almualm, 2017, Xu et al., 2003). In this research the Logistic Regression Model will help to find the factors that lead the population to catastrophic expenses. The dependent variable is a dummy variable equal to 1 if catastrophic expenditure occurs and 0 otherwise.
The Logistic Regression Model’s independent variables are those that one can define in the data charter: 1. a chronically sick or disabled member of a household (dummy variable); 2. the last inpatient service utilization used by any member of a household during the previous three months (dummy variable); 3. the last outpatient service utilization used by any member of a household during the previous three months (dummy variable); 4. household composition and demography; and 5. the expenditure quintile groups.2 To compare households with different economic statuses, the expenditure quintile groups were defined as the share of total expenditure divided by the equivalent size of a family and then ranked from the poorest to richest.3
Catastrophic Health Expenditures
Catastrophic health expenditure (CHE) refers to any disbursement for medical treatment that pose a threat to a household’s financial ability to maintain its subsistence needs. According to the World Health Report (2000), one of the fundamental functions of a health system is to protect a population from the financial risks associated with ill health, quantified in terms of catastrophic health expenditure and impoverishment from medical expenses. According to WHO
2 The lowest quintile is used for the reference group.
3 The expenditure quintile groups were defined through ranking household monthly expenditure per adult
8
(2010), about 150 million people face catastrophic expenditure as a consequence of high out-of-pocket expenditure (OOP) for healthcare each year.
As stated by Kimani & Maina (2015), two common approaches are used to measure catastrophic health expenditure (CHE). The first, proposed by Wagstaff & van Doorslaer (2003), is related to budget share. The second, by Xu (2005), is related to a household’s capacity to pay. Wagstaff and van Doorslaer defined OOP as catastrophic if they exceed certain fraction of a household’s total expenditure or income in a given period. Whereas, Xu (2005) defined catastrophic health expenditure in relation to a household’s non-food expenditure.
While the popular approach defines medical spending as “catastrophic” if it exceeds a fraction of a household’s income or total expenditure in a given period. For instance, WHO (2005) indicates that health expenditure is considered catastrophic whenever it is equal to or exceeding 40% of a household’s non-subsistence income. Subsistence need is defined as the minimum requirement for a household to maintain basic needs within society.4
Within research related to CHE and the functioning of health systems, both approaches are used to define CHE. In their studies Daneshkohan et al.(2011), Puteh & Almualm (2017), Kien et al. (2016), and Mchenga et al. (2017) define health expenditures as catastrophic if the out-of-pocket health expenditure is greater than 40% of a household’s non-subsistence (non-food) expenditure.
While other scholars such as Dorjdagva et al. (2016), O’Donnell et al. (2005), Ranson (2002), Nabila (2016), and Tolla et al. (2017), classify catastrophic health expenditure as annual out-of-pocket payments above 10% of a household’s total expenditure/income.
As the aim of the present research is to estimate the FFC index in Georgia and factors causing the population’s CHE, it is notable that both of the studies on Georgia, with the same objectives, conducted by Gotsadze et al. (2009) and Zoidze et al. (2012), define health expenditures as catastrophic if the OOP is greater than 40% of household’s non-food expenditure.
4The basic life needs are food, shelter, clothing and certain household goods. A household’s
9
Besides which, O’Donnell et al. (2008) notes that health spending is income elastic, hence non-food expenditure may be preferred to better detect catastrophic payments among the poor. Finally, in accordance with WHO’s (2005) definition and the studies previously conducted in Georgia, the present research will also assess the expenditure as catastrophic if out-of-pocket health expenditure is over 40% of a household’s non-food expenditure.
1.3. Results
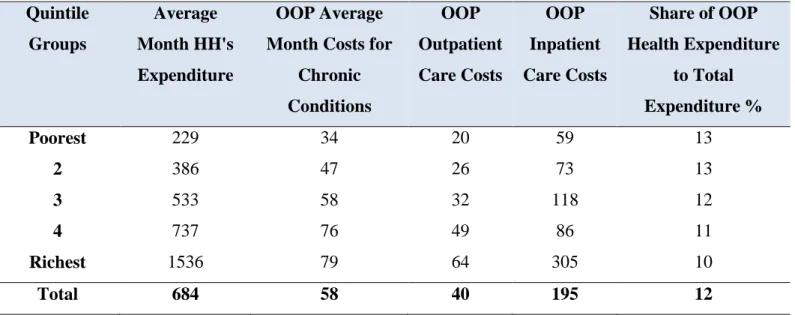
The main objective of the present papers is to define the factors causing the population’s catastrophic health expenditures. Variables such as utilization, geographic location, or having a chronically ill or disabled person in the household increase the probability of occurrences of catastrophic health expenditure. The number of households including the chronically ill or the disabled is very high in Georgia. Around 57% of households have at least one member with serious health conditions. According to the results of the present research, OOPs are significantly higher for the majority of households in the survey, regardless of whether they rank among the rich or poor quintile groups (Table 1.1). For instance, in the poor quintile, 96% of the expenditures incurred for the medical treatment of the chronically ill or disabled are paid by their households, similarly households from the rich quintile pay 95% of the same incurred expenditures.
Households from the poor quintile spend 34 GEL for the medical treatments of chronically ill or disabled members of the family, while their total expenditures are 229 GEL. Regarding the wealthiest quintile, the expenditures incurred for the medical treatment of chronically ill members of the household accounts to 79 GEL, out of their total healthcare expenditure 1536 GEL (Table 1.2). Therefore, the financial pressure incurred for the medical treatment of a household with chronically ill or disabled members is higher in the poor quintile compared to the rich quintile.
A similar picture holds for outpatient treatment. Regardless of the economic condition of the household (rich or poor), OOP expenditures are around 89% of OOP outpatient health expenditure share of the total outpatient health expenditure (Table 1.1). Poor households spend 20 GEL on outpatient treatments (their total expenditure accounts to 229 GEL), while the rich quintiles’ spending incurred for outpatient treatment is 70 GEL (and their total expenditures,
10
1536 GEL). These findings illustrate that as with chronic illnesses, outpatient treatments may also be a significant reason for catastrophic health expenditures for the poor, more so than the rich.
While with inpatient treatment, 68% of expenditure incurred for treatment comes from OOP of poor households, which is 22% less in comparison with the expenditures incurred by the rich quintile (Table 1.1). Specifically, the figures reveal that inpatient treatment expenditures for the poor quintile are 59 GEL (from a total expenditure of 229 GEL), whereas the same spending for the rich quintile amounts to 305 GEL (from the total 1536 GEL). The results illustrate that expenditures for inpatient treatment incurred by poor households relatively are higher in comparison to rich households.
Furthermore, the figures, provided in Table 1.3, reinforce the judgment, which highlights that 28% of poor households incur CHE, while only 10% of the rich quintile face catastrophic health spending.
It is also noteworthy that hospitals are more accessible in urban than in rural regions, thus, the demographic variable is significant to help illustrate the related differences in CHEs. In rural areas, 28% of households face CHE, while in urban areas it is only 18%. The difference between urban and rural CHE is statistically significant in the 99% CI interval (Table 1.4).
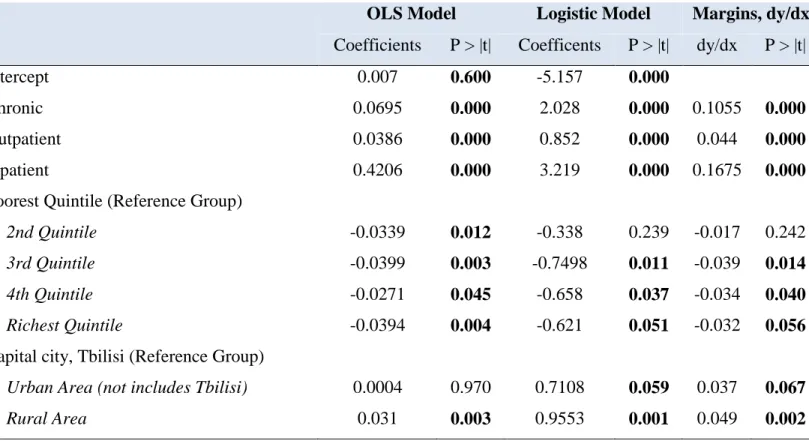
Each of the above-mentioned variables were used as independent variables and can influence the occurrence of CHE. Therefore, this study has run the OLS and Logistic Regression Model.
In both the OLS and Logistic Regression Models all the variables, except the urban variable, are statistically significant in the 95% CI (Table 1.5). Households which have members with a chronic illness or disabilities are 10% more expected to face CHE in comparison with other households. In addition, households who had outpatient treatment are 4.4% more likely to face catastrophic expenditure, compared to those who never utilized outpatient treatments. Furthermore, households whose members had inpatient treatment are 16.75% more likely to have catastrophic health expenditure, compared to households who did not use inpatient treatments.
In regard to the quintile groups, the richest quintile suffers 3.2% less risk of having catastrophic expenditure in comparison to the poor group. Likewise, the 3rd and 4th quintiles
11
suffer around 3.5% less risk in comparison to the poor quintile. Finally, rural areas suffer 5% more catastrophic risk compared to the capital city.
An analysis of two papers, the present work alongside Gotsadze’s et al. (2009), illustrates that in 2007-2015 there were the same variables affecting the prevalence of catastrophic expenditures of the population. This research has discerned that the FFC index in 2015 equals -0.72, which is worse than the FFC index in 2007 (-0.82). A decrease in the FFC index identifies that the health financing system, from 2007, had become less fair by 2015.
1.4. Policy Implications and Conclusion
The present research highlights specific recommendations to decrease incidences of catastrophic health expenditure. The focus on the poor population will help the Georgian government attain positive outcomes from the UHC program. According to this research the health system policies should be oriented on the following: 1. more attention should be paid to the poorest segment of the population. The size and the coverage of their insurance package should be increased. The aforementioned recommendation is based on the evidence that both during inpatient and outpatient treatment the poor quintile face more catastrophic health expenditure than the rich (Table 1.1 and 1.2). 2. The UHC package has a lack of pharmaceutical benefits for its beneficiaries, significantly increasing the occurrence of CHE for households. Therefore, the existing healthcare package should be improved through the inclusion of prescription medication for the poor. 3. Households in the rich quintile still face CHE, specifically, 1 out of 10 household is under the risk of catastrophic health expenditures (Table
1.3), hence, instead of a basic health coverage package, the government should introduce only coverage for catastrophic health expenditures.
The fact that the FFC index in Georgia worsened between 2007-2015 may be explained by the launch of the UHC program, introduced in 2013, which offers similar insurance packages both to poor and rich households. These policy recommendations may carry relevance for policy makers from other low and middle-income countries facing similar problems of high OOP and catastrophic health expenditures.
12 Table 1.1. Key Indicators by Consumption Quintile (HH's Level Data)
Indicator Total Number
Obs.
Poorest
Fifth 2 3 4
Richest Fifth
% of total population with chronically
diseased or disabled family member 57 1580 55 63 59.16 55 51
OOP Chronic Health Expenditure share
to Total Chronic Health Expenditure 96 97 97 97 97 95
% of total HH's with acute sickness during
last 3 month (Outpatient) 31 863 25 29 31 31 37
OOP Outpatient Health Expenditure share to Total Outpatient Health Expenditure
89 89 90 91 87 87
% of total HH's with Stationary Treatment
during Last 3 Month (Inpatient) 4 92 1 2 4 3 9
OOP Inpatient Health Expenditure share
to Total Inpatient Health Expenditure 53 68 63 65 49 46
% reported to be Beneficiaries of State Program for Population below the Poverty
13 Table 1.2. HH’s Monthly Expenditure Characteristics Mean in GEL (99 % CI)
Table 1.3. Percentage of HH's by Quintile Groups, Facing Different Levels of Health Expenditure at Different Cut-off Points (99% CI for Cut-off Points)
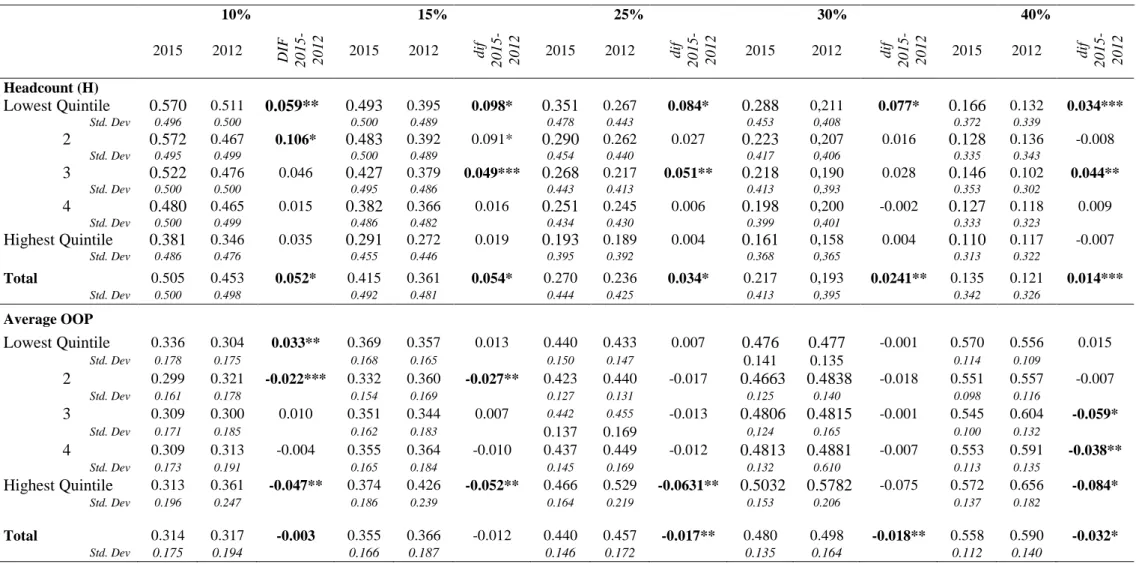
Note: The table shows that 18% of households are facing catastrophic health expenditure. Catastrophic health expenditure is defined by a household’s expenditure over 40% than their capacity to pay. The poor quintile faces a catastrophic health expenditure of 27%, which is 17% more than the rich quintile face. This indicates inequality between quintile groups with regards to the expenditure variables.
Quintile Groups Average Month HH's Expenditure OOP Average Month Costs for
Chronic Conditions OOP Outpatient Care Costs OOP Inpatient Care Costs Share of OOP Health Expenditure to Total Expenditure % Poorest 229 34 20 59 13 2 386 47 26 73 13 3 533 58 32 118 12 4 737 76 49 86 11 Richest 1536 79 64 305 10 Total 684 58 40 195 12
Poorest 2 3 4 Richest Total
OOP >= 40 % of CPT 27 23 19 12 10 18
OOP = 20-40 % of CPT 22 24 20 18 10 19
OOP = 10-20 % of CPT 11 16 17 15 15 15
14 Table 1.4. Percentage of HH's by Region Groups, Facing Catastrophic Health Expenditure (99 % CI)
Table 1.5. Estimated Coefficients in the OLS and Logistic Model for Catastrophic Health Care Expenditure (HH's data)
Region Total
Urban OOP >= 40 % of CPT 18
Rural OOP >= 40 % of CPT 28
Tbilisi OOP >= 40 % of CPT 19
OLS Model Logistic Model Margins, dy/dx
Coefficients P > |t| Coefficents P > |t| dy/dx P > |t|
Intercept 0.007 0.600 -5.157 0.000
Chronic 0.0695 0.000 2.028 0.000 0.1055 0.000
Outpatient 0.0386 0.000 0.852 0.000 0.044 0.000
Inpatient 0.4206 0.000 3.219 0.000 0.1675 0.000
Poorest Quintile (Reference Group)
2nd Quintile -0.0339 0.012 -0.338 0.239 -0.017 0.242
3rd Quintile -0.0399 0.003 -0.7498 0.011 -0.039 0.014
4th Quintile -0.0271 0.045 -0.658 0.037 -0.034 0.040
Richest Quintile -0.0394 0.004 -0.621 0.051 -0.032 0.056
Capital city, Tbilisi (Reference Group)
Urban Area (not includes Tbilisi) 0.0004 0.970 0.7108 0.059 0.037 0.067
15
References
Arfa, C. & Achouri, H. (2008). “Tunisia: “Good practices” in expanding health care coverage. Lessons
from reforms in a country in transition” in Lessons from reforms in low‐ and middle‐income countries. Washington DC: The World Bank, pp. 385-437.
Akbar, F.A., Hossein G., Farhad L., Masoud S., & Mohsen M., (2015). Main Determinants of
Catastrophic Health Expenditures. A Bayesian Logit Approach on Iranian Household Survey Data (2010). Global journal of Health science
Daneshkohan, A, Karami, M., Najafi. F. & Karami, M.B. (2001). Household Catastrophic Health
Expenditure. Iranian Journal of Public Health.
Dorjdagva, J., Batbaatar, E. & Kauhanen, J. (2016). Catastrophic health expenditure and impoverishment
in Mongolia. International Journal for Equity in Health.
Gotsadze, G., Zoidze, A., & Rukhadze, N. (2009). Household catastrophic health expenditure: Evidence
from Georgia and its policy implications. BMC Health Services Research.
International Labor Organization. (2015). Indonesia: Providing health insurance for the poor. Series: Social Security Extension Initiatives in South East Asia.
Jowett, M. & Hsiao, W. (2007). Philippines: “extending coverage beyond the formal sector”, in Social
health insurance for developing nations. Washington DC, The World Bank, pp. 81-104.
Kien, V.D., Minh, H.V., Ngoc, N.B., Phoung, T.B., Ngan, T.T. & Quam, M.B. (2017). Socioeconomic
inequalities in catastrophic health expenditure and impoverishment associated with non-communicable diseases in urban Hanoi, Vietnam. Asia Pacific journal of Public Health.
Kimani, D. & Maina, T. (2015). Health Expenditures and Impoverishment in Kenya. Health Policy Project; USAID.
Leemput, L., Ponsar, F., Philips, M. & Bricki, N. (2007). Health equity funds in Cambodia. Lancet, vol. 369, no. 9562, p. 638.
Mchenga, M., Chirwa, G. C. & Chiwaula, L. S. (2017). Impoverishing effects of catastrophic health
16 Meessen, B., Pei, X. Criel, B. & Bloom, G. (2008). Health and social protection: “experiences from
Cambodia, China and Lao PDR”. Antwerp: ITG Press.
Nabila, Z. (2016). Medical Expenditure and Household Welfare in Bangladesh. BRAC Institute of Governance and Development; BRAC University.
O’Donnell, O., van Doorslaer, E., Wagstaff, A. & Lindelow, M. (2008). Analyzing Health Equity Using
Household Survey Data. Chapter 18, pp 208-209.
O’Donnell, O., van Doorslaer, E., Rannan-Eliya, P.R., Somanathan, A., Garg, C.C., Hanvoravongchai, P. Nuq, N.M., Karan, A., Leung, M.M., Tin, K., & Vasavid, C., (2005). Explaining the incidence of
catastrophic expenditures on health care: “Comparative evidence from Asia”. EQUITAP
Project: Working Paper #5.
Preker, A., Carrin, G., Dror, D., Jakab, M., Hsiao, W. & Arhin-Tenkorang D. (2004). "Rich -poor
differences in health care financing", in Health financing for poor people resource mobilization and risk sharing. Washington DC, The World Bank, p. 352.
Puteh, S.E.W. & Almualm, Y. (2017). Catastrophic Health Expenditure among Developing Countries. Health System and Policy Research, 4(1): 1-5.
Ranson, M.K. (2002). Reduction of catastrophic health care expenditures by a community-based health
insurance scheme in Gujarat, India: current experiences and challenges. Bulletin of the World
Health Organization 80(8): 613-21.
The World Health Report, (2000). Health Systems. Geneva: World Health Organization.
Tolla, M.T., Norheim, O.F., Verguet, S., Bekele, A., Amenu, K., Abdisa, S.G. & Johansson, K.A. (2017).
Out-of-pocket expenditures for prevention and treatment of cardiovascular disease in general and specialized cardiac hospitals in Addis Ababa. Ethiopia: a cross-sectional cohort study.
Wagstaff, A. & van Doorslaer, E. (2003). Catastrophe and Impoverishment in Paying for Health Care:
With Applications to Vietnam 1993–98. Health Economics 12(11): 921–934.
Wagstaff, A. (2007). Health insurance for the poor: initial impacts of Vietnam's health care fund for the
17 World Health Organization, Department of health systems financing. (2005). Designing health financing
systems to reduce catastrophic health expenditure. Technical briefs for policy makers; p. 2.
No.2.
WHO, World Health Report. (2010). Health systems financing: the path to universal coverage.
Xu, K. (2005). Distribution of Health Payments and Catastrophic Health Expenditures: Methodology. Discussion paper. Geneva: World Health Organization.
Xu, K., Evans D.B, Kawabata, K., Zeramdini, R., Klavus, J. & Murray, C.J.L. (2003). Household
catastrophic health expenditure: a multicounty analysis. Evidence and Information For Policy.
World Health Organization.
Zoidze, A., Rukhadze, N., Chkhatarashvili, K. & Gotsadze, G. (2012). Health Insurance for Poor: Georgia’s path to Universal Coverage. Curatio International Foundation.
18
Chapter 2
Towards Universal Health Coverage system: Lessons
Learnt from Georgia and its Policy Implications
(Main Paper)
Abstract
This paper studies the effects of Expanded Medical Assistance for the Poor (EMAP) and Universal Health Coverage (UHC) programs in Georgia on healthcare utilization rates and the financial burden of the population. In 2012, the Georgian government expanded its existing program of Medical Assistance for the Poor by adding pensioners, children under five and students. In 2013, Georgia transitioned to the UHC program from targeted healthcare insurance schemes. Since the initial implementation of the government’s initiative, there has been no research assessing the impact of either EMAP or UHC. Prior to 2012, the main recommendations of the prevailing research analyzing Georgia’s healthcare system was to focus on the section of society in the greatest need and to improve their insurance packages. Despite this, Georgia introduced UHC in 2013, rather than directing additional funds to vulnerable groups- namely, offering better services and including prescription benefits. The main objective of this paper is to evaluate the relevance of the decision of the government of Georgia to move toward UHC in 2013 by comparing the effects of EMAP and UHC. Based on data from the National Statistics Office of Georgia and using difference in difference with a matching methodology, this study reveals that EMAP had a positive effect in terms of utilization rates, but it had no impact on the financial burden of participant households. Between 2012-2013, there was a 6% increase in inpatient and 7% increase in outpatient utilization rates. When evaluating the pure effects of UHC there were no statistically significant changes in terms of healthcare services utilization and financial burden on households without pensioners, children under five or students. Furthermore, this paper is encouraging for researchers working on cross-sectional data using a difference in difference (DID) approach due to the methodology. Cross-sectional data creates econometric problems, such as the differences in control and treatment groups on a set of baseline characteristics. The study’s assessment of UHC and EMAP is performed using four grouping propensity score matching (PSM) with a DID method, which offers less biased results in the cross-sectional data.
19
2.1 Introduction
The primary goal of this paper is to evaluate the effects of Universal Health Coverage (UHC), introduced in Georgia in 2013, on the utilization of health services and expenditures. This paper further seeks to evaluate the targeted health reforms of the Expanded Medical Assistance for the Poor (EMAP), introduced in 2012. The investigation provides a better informed decision-making process for policy makers determining whether to insure the entire population with basic health packages or to develop targeted insurance packages for the most vulnerable households. Despite the significant influence of healthcare systems on the wellbeing of households, there has been no research conducted in Georgia on the effects of transitioning to UHC. The empirical findings of this study will benefit Georgian policy makers as they proceed to the next stages of UHC reform. The subsequent findings may also be utilized as a guide for designing an effective transitional path towards Universal Health Coverage in countries similar to Georgia, which plan to implement universal healthcare reform.
The policy makers expected UHC and EMAP to improve the population’s financial protection and consumption of health services. This research, however, does not support their expectations either in terms of financial protection, either with UHC or EMAP. Nevertheless, EMAP, which covers households with pensioner, students and children, has had a greater positive effect on the utilization of health services. The combined results of UHC and EMAP also reveal a positive effect on both outpatient and inpatient visits for the households which were covered by EMAP.
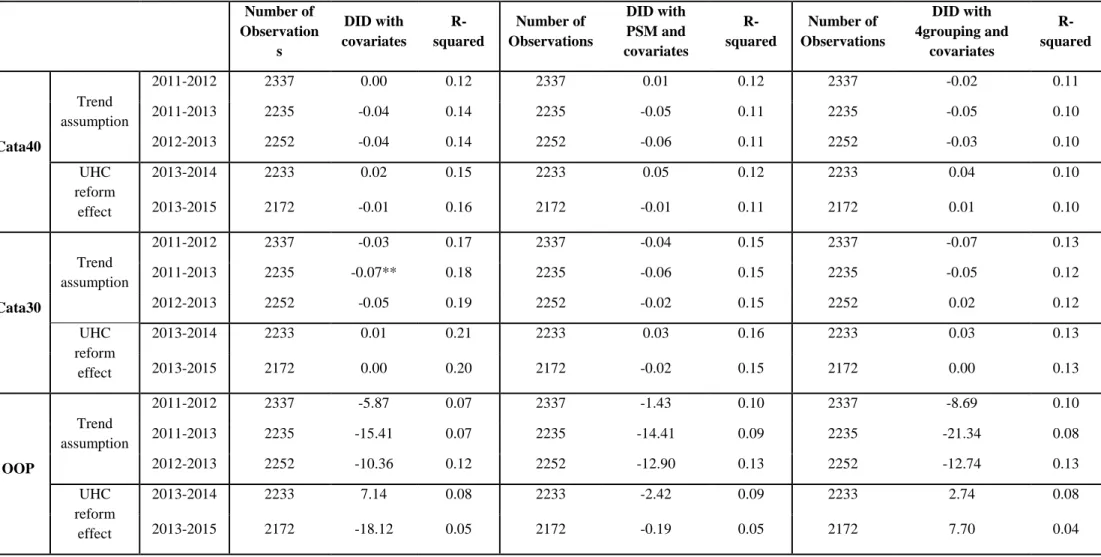
Furthermore, this paper is encouraging for researchers working on cross-sectional data using a difference in difference (DID) approach due to the methodology. Cross-sectional data creates econometric problems, such as the differences in control and treatment groups on a set of baseline characteristics.
The study’s assessment of UHC and EMAP is performed using four grouping propensity score matching (PSM) with a DID method, which offers less biased results in the cross-sectional data. In addition to this approach, the empirical analysis also employs the standard PSM with DID and the simple DID methods. When comparing the three methods, the four grouping
20
method appears to be the most valuable under statistical point of view for analyzing cross-sectional data.
In this paper, access to health services is evaluated by the inpatient and outpatient utilization rates, while financial protection is measured by individual households’ out-of-pocket health expenditure (OOPHE), and catastrophic health expenditures (CHE) using various thresholds.
This research looks at the following two questions: 1. What impact did the EMAP and UHC programs have on the ratio of OOPHE to capacity to pay between 2012-2015? 2. What impact did the EMAP and UHC programs have on inpatient and outpatient utilization rates in 2012-2015? To answer these research questions, the paper uses the Integrated Household Survey Database of the National Statistics Office of Georgia.
The paper is structured as follows: section 1 reviews the existing literature and Georgia’s previous healthcare system; section 2 focuses on the data and methodology; section 3 presents the results of the research; and section 4 discusses the policy implications and provides the conclusions.
2.2 An Analysis of the Existing Research
According to the World Health Organization (WHO), the core aim of UHC is to provide quality, essential health services to a population, without their being exposed to financial hardship. Numerous countries, at all levels of development, are embracing UHC to achieve a higher level of welfare for their citizens. UHC is also a decisive component within the United Nations’ 2030 Agenda on Sustainable Development Goals (SDGs), which outlines the following specific health goals: to ensure financial risk protection, access to quality healthcare services and to affordable essential medication (WHO & World Bank Group, 2015).
According to the World Bank Group and WHO’s joint global monitoring report on Universal Health Coverage, health programs should be measured using three significant facets: 1. who is covered; 2. which services are covered; and 3. the proportion of costs that are covered by who? (Figure 2.1). Ultimately, UHC should be implemented, such as individuals and
21
households are protected from “financial ruin” due to healthcare costs (McIntyre & Kutzin,
2016).
In impact evaluation literature, there are different approaches for examining the effects of healthcare reforms. The impact of Mexico’s “Seguro Popular (SP)” program on financial protection was examined by Galarraga et al. (2009) and King et al. (2009) by using both OOPHE and CHE variables. In each paper, a household’s healthcare spending exceeding 30% of their total capacity to pay indicated catastrophic healthcare expenditure. Another approach may be to consider health expenditure catastrophic whenever it equals or exceeds 40% of a household’s non-subsistence income. Where subsistence need is defined as the minimum requirement for a household to maintain a basic standard of living. In their studies, Puteh & Almualm (2017), Kien et al. (2017), and Mchenga et al. (2017) each define health expenditure as catastrophic if the out-of-pocket healthcare expenditure is more than 40% of a household’s non-subsistence (non-food related) expenditure. This paper will evaluate catastrophic expenditure using both the 30% and 40% thresholds.
Wagstaff et al. (2007) used inpatient and outpatient utilization variables to measure the impacts of the insurance program on access to health services in China. Trujillo et al. (2005) used the same variables to evaluate experiences in Colombia. These studies measure inpatient and outpatient utilization of health services via the following questions: was an individual hospitalized in the 12 months prior to the interview, and did an individual use outpatient care 30 days prior to the interview. This study differs slightly, as it uses data on inpatient and outpatient utilization over the three months prior to the day of the interview. Whilst the dummy variables are: the last inpatient service used by any member of a household over the last three months; and the last outpatient service used by any member of a household over the last three months.
The variables of the outcomes are based on how researchers evaluate healthcare reforms. This investigation evaluates reforms based on: 1. inpatient and outpatient utilization of health services, and 2. CHE at 30% and 40% thresholds, and on OOPHE.
2.2.1 The Georgian Experience
In accordance with WHO Guidelines on Healthcare Programs, since 2006, the Georgian government has been developing its own social and healthcare system. The Georgian healthcare
22
system has experienced diverse, large-scale reforms within this short period. Crucially, the system was adapted several times between 2006 and 2013, with the transformation of services, insurance coverage, financial protection methods and the scope of funding.
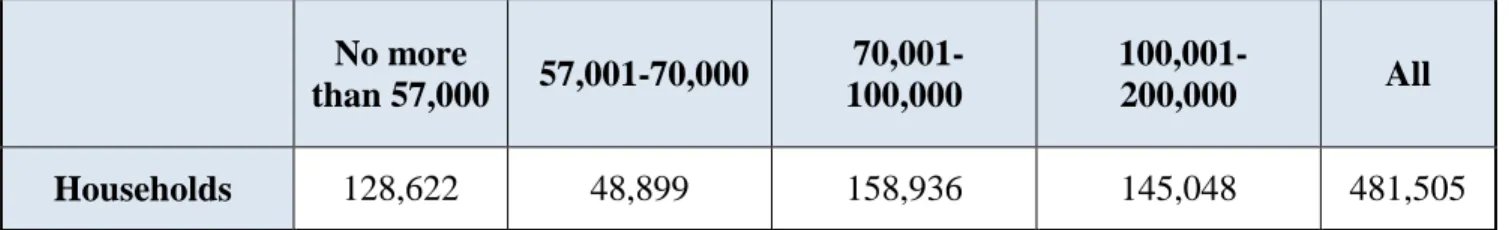
In 2006, the Georgian government launched an essential social policy, in which it established the Social Service Agency (SSA) to identify poor people based on a scoring and proxy means testing system. This scheme was based on each household’s welfare index. The lower the welfare index, the lower the welfare of the household. The SSA evaluated each applicant (household) based on the information collected from their SSA survey. In order to become recipients of MAP, households must first be registered in the SSA database and then assigned a score of 70,000 or less, via the SSA survey (Table 2.3).5 The proxy means test uses over 80 variables to determine each household’s welfare status. The main groups of variables are the following: the different types of properties owned; income; utility expenses; level of education; household size; and geographical location. There were no Georgian regions excluded from the program, with the exception of occupied territories. Different weights were applied to the variables depending on each regions’ development level. Similar proxy means tests have been implemented in other middle-income countries including Mexico, Honduras, Jamaica, Colombia, Russia, and Egypt (Coady et al., 2004).
In 2007, the Georgian government launched the Medical Assistance for the Poor (MAP) program, which was based on principles similar to the various health financing reforms in other low and middle-income countries like Tunisia (Arfa & Achouri, 2008), Mexico (Coady et al.,
2004), and the Philippines (Jowett & Hsiao, 2007). MAP was focused on the poorest segments of the population, identified by the SSA, and offered coverage for urgent outpatient and inpatient treatments. From 2007 to 2012, minor changes were made to Georgian healthcare programs, and in May 2012, the government further expanded the program to include both children under the age of six and the retired (EMAP), who were previously ineligible as recipients of MAP. Thus, EMAP offered coverage to households identified by the SSA, in addition to all pensioners, children under the age of six and to students. After these modifications to MAP, approximately 50% of the total population was covered (Zoidze et al., 2012). Finally, in the third quarter of 2013, the UHC program was introduced to cover the entire population. While, between 2011 and
5 There were 481,505 registered households, with households scoring below 100,000 obtaining social assistance
23
2015, no significant changes were introduced to the insurance packages offered to the households identified by the SSA (Table 2.5).
A few notable research papers have provided an in-depth analysis and assessment of the reforms conducted between 2007 and 2012. For instance, a study by Gotsadze et al. (2009) made recommendations to the Georgian government to focus on the financial protection of the poor, and to extend the benefits for the poor and the chronically ill by including and expanding inpatient coverage and with co-payments for medication. Pharmaceutical expenditure was found to be one of the main causes of impoverishment, thus adding a co-payment mechanism for medicine would improve the financial protection of the poorest households.
An additional piece of research by Zoidze et al. (2012), using data from 2007-2010, found that MAP had a positive impact in reducing expenditure for inpatient services and households’ total healthcare costs. However, MAP insurance had almost no effect on health services utilization or on household’s expenditure on outpatient medication. Analyzing the effects of MAP, Zoidze et al. (2012) further recommended the inclusion of additional co-payments for medication.
The general trends of this study’s variables are also noteworthy in the outcome of outpatient and inpatient visits, and CHE and OOP for the population: for instance, statistics from the Ministry of Health show an increase in outpatient utilization. From 2012 to 2015, individual average outpatient visits to hospitals increased by 1.3 visits per person. There is a similar trend for inpatient health services, which increased by 4253 for every 100,000. This research will further evaluate whether these increases were stimulated by UHC and EMAP. In terms of OOP, the WHO statistics identify that OOPHE per capita in Georgia increased by only 4% from 2012 to 2014, and decreased by 14.1% from 2014 to 2015. This contradicts UNICEFs research on OOP, which shows an increase of 31% from 2013 to 2015 (UNICEF, 2013 & 2015). These statistics do not show whether this change is due to UHC or to other factors. This research primary focuses on UHC and EMAPs effects on the OOPHE and CHE of households.
24
2.3 Data
The data is derived from the Integrated Household Survey of the National Statistics Office of Georgia, conducted in the first quarters of 2011-2015. The data is cross-sectional, and each household remains in the sample for one year and is interviewed four times during that period. Because the UHC program does not cover individuals with private insurance, to avoid compromising the results, households where at least one member is the beneficiary of private insurance are removed from the sample. The sample size for each year is shown in Table 2.4.
The majority of these observations, 15.6%, were withdrawn due to private insurance in 2013, and the least, 9.6%, in 2015.
In 2011, the National Statistics Office of Georgia included a new variable in the survey concerning insurance types. This variable provides information regarding the type of insurance for each member of a household, including state insurance, insurance at an employer’s expense or at an individual’s expense. The absence of this variable before 2011 limited the opportunity to study how insurance packages have changed over time. Due to this data limitation, it is not possible to create control or treatment groups prior to 2011.
The data includes the following general information about households: size, the number of children and pensioners in a family, and geographical characteristics (living in urban or rural regions). The data also reports household monthly expenditure, such as healthcare costs, food expenditure, etc. It also includes subjective evaluations of each household’s financial conditions, based on living conditions. In order to avoid the effects of inflation on expenditure variables, they have been adjusted to 2011 prices. General inflation statistics have been taken from the National Statistics Office of Georgia. While, the first three months of each year have been adjusted to the corresponding months of 2011 (Table 2.2).
Tables 2.7-2.11 report the baseline descriptive statistics for the characteristics and the outcomes studied within the control and treatment groups. Treatment group 1 has the highest level of education and comfort of living. As this group does not include pensioners or children, their need for healthcare services and their OOPHE is the lowest. The control group was created mostly from poor households, and therefore their standard of living is the lowest among the three groups. In 2011, around 70% of the control group lived in rural areas. In terms of the head of a
25
household’s educational level and comfort of living, their indicators are the lowest compared to the other groups.
2.4 Methodology
2.4.1 Control and Treatment Groups
The present study uses the following three different methods to estimate the impact of reforms: 1. DID with covariates; 2. DID with PSM and covariates; and 3. DID with four grouping PSM and covariates. These matching approaches alongside the DID method is increasingly common in the impact evaluation literature (Wagstaff et al, 2007, Shen & Zuckerman, 2005, & Stuart et al, 2014). The choice of the empirical approach has critical importance on the robustness of the results. This section will elaborate on the advantages and limitations of these various methods within the study.
Households are classified as a “control” if they were insured by the MAP program before EMAP or UHC were introduced. The first treatment group includes households that do not belong to the control group and where there is neither a pensioner, a student nor a child aged below six. Meanwhile, all households that are not in the control group or in treatment group 1, are comprised of treatment group 2 (households in which members were covered under EMAP). Therefore, the control and treatment groups contain the entire population, excluding households with at least one member with private insurance.
According to the Household Survey, around 19% of all households are in the control group (448 households). While, approximately 28% of households (690) are in treatment group 1, and 53% (1302 households) are in treatment group 2 (Table 2.6).
2.4.2 Limitations
According to Stuart et al. (2014), there are two potential types of selection bias that are of concern to DID studies: across time and across groups. The former, selection bias across time, occurs when treatment groups and control groups change in composition over time. Therefore, the control group from the pre-treatment period differs from the control group of the post-treatment period. Whereas, selection bias across groups occurs when post-treatment groups and control groups have different baseline characteristics, consequently they would be poor