This is an Accepted Manuscript of an article published in Crime, Law and Social Change , December 2012, Volume 58, Issue 3, pp 321-349 . The final publication is available at Springer via http://link.springer.com/article/10.1007%2Fs10611-012-9387-9
The Structure of Drug Trafficking Mafias: The ‘Ndrangheta and cocaine.
1. Introduction
This study analyzes the structure and organization of two drug trafficking groups belonging to the ‘Ndrangheta, a mafia organization operating in Southern Calabria, Italy. The main aim is to analyze the organizational structure of the mafias when engaged in drug trafficking and to compare it with the findings of previous studies on drug trafficking organizations.
The historical origins of the ‘Ndrangheta reach back to the nineteenth century, although some evidence suggest that it may have had precursors even before that period (Ciconte 1992; Gratteri and Nicaso 2009, 25).1 The ‘Ndrangheta is composed of a number of different groups, called ‘ndrine. The ‘ndrine from the same area form a locale, which controls a specific territory. According to official estimates, there are approximately 5,000 members of the ‘Ndrangheta (Paoli 2007, 856). Unlike the Sicilian Cosa Nostra, the ‘ndrine mostly consist of members of the same family (Paoli 2003; Varese 2006b). This reinforces the cohesion of the criminal groups. The ‘Ndrangheta further enhances the strength of the ‘ndrine and the locali by fostering a shared culture based on rituals, affiliation ceremonies, formal ranks and mythology.2 Familial, cultural and hierarchical ties reinforce trust among the members and give the ‘Ndrangheta exceptional solidity (Paoli 2003). As proof of this, very few pentiti (collaborators with justice) come from the ‘Ndrangheta, as opposed to the Sicilian Mafia or the Neapolitan Camorra (Paoli 1994, 216; Savona 2012, 19).
For years, the ‘Ndrangheta has received less attention than Cosa Nostra, which is widely considered to be the archetypical mafia organization (Paoli 1994). However, recent events have brought the Calabrian organization into the world media spotlight.3 Notwithstanding the lack of attention paid to it compared with the Sicilian Mafia, the ‘Ndrangheta is a fully-fledged mafia. It is a secret, criminal organization, with an extremely well-developed structure. It uses intimidation, threats and violence to commit crimes, to provide illicit goods and services, and to infiltrate legal markets as well as local and national politics (Paoli 1994; Paoli 2003; Paoli 2004a; Varese 2006b).
1 As far as is possible and reasonable, the analysis of the ‘Ndrangheta and of the Italian drug markets references
English-language literature.
2 Seizures have been made of written “regulations” which describe the rules of the organization and its secret
oaths (Gratteri and Nicaso 2009; Malafarina 1978; Paoli 2003). The ‘Ndrangheta has specific ranks for its members, with an elaborate formal hierarchy consisting of two main layers: the higher society (società maggiore) and lower society (società minore). There are multiple ranks within each layer (Paoli 2003).
3 The first event was the so-called ‘Duisburg massacre’ of 15 August 2007, when six people of Calabrian origin
were murdered in Duisburg, Germany, in connection with a decade-long blood feud between two ‘ndrine (D’Emilio 2007; Landler and Fisher 2007; Spiegel Online International 2007; Williamson and Bompard 2007). Investigators found evidence of an affiliation ritual in the pocket of one of the victims (the remnants of a burned holy image), which further confirmed the tight relation between the massacre and the ‘Ndrangheta (McKenna 2001). Second, on 30 May 2008 the President of the United States identified the ‘Ndrangheta as a significant foreign narcotics trafficker and included it in a special list entailing application of a number of sanctions by U.S. authorities. The ‘Ndrangheta is the only Italian mafia organization included in the list (OFAC 2012; U.S. Department of State 2011). Thirdly, two exceptional law enforcement operations of 15 July 2010 led to the arrest of more than 300 people and brought the ‘Ndrangheta to international media attention (De Cristofaro and Chu 2010; Dinmore 2010; BBC 2010; Panigiani 2010). Operation Il Crimine focused on Reggio Calabria (Calabria’s main city) while Operation Infinito highlighted the stable presence of the ‘Ndrangheta in Milan (the capital of Lombardy, Italy’s second largest city and its main economic and financial center).
One of the main criminal activities of the ‘Ndrangheta is the trafficking of cocaine. The ‘Ndrangheta has exploited its organizational structure to establish solid partnerships with Southern American cocaine suppliers (Paoli 1994, 222–223). Several official reports maintain that the ‘Ndrangheta has achieved a primary role in the Italian and international cocaine markets, outmatching other mafias, such as the Sicilian Cosa Nostra and the Neapolitan Camorra (CPA 2008; Paoli 2004b, 201; Wilkinson 2007).
The allegations that the ‘Ndrangheta has a leading role in cocaine trafficking are in contrast with the evidence produced by the literature on drug trafficking. Indeed, the literature has frequently described drug markets as examples of “disorganized crime” or a “cottage industry” (Reuter 1983; Eck and Gersh 2000). Several studies have found the prevalence of small, flexible and mutable networks with a limited number of entrepreneurs (Reuter and Haaga 1989, 54–55; Dorn, Murji, and South 1992, ix; Pearson and Hobbs 2001, 11–12; Desroches 2003; Paoli 2004b, 201; Dorn, Levi, and King 2005, 14– 15; Decker and Townsend Chapman 2008; Reuter 2009; Benson and Decker 2010; Bouchard and Ouellet 2011, 70–71). Structured criminal organizations may participate along with more unstructured criminal groups (Reuter 2009, 16). Violence is a “red thread” pervading criminal markets, but it appears to be rarely used. The capacity to apply violence is an important asset for a drug trafficking group, but the actual use of violence has been interpreted more as a signal of problems than of ordinary business activity (Dorn, Levi, and King 2005, 25). Indeed, violence is “bad for business” because it discourages customers and attracts the attention of the law enforcement agencies and the media (Pearson and Hobbs 2001, 41–42; Reuter and Haaga 1989, 26). In this regard, the ‘Ndrangheta appears to be an exception in a market where different organizational structures, not easy to assign to predetermined categories, are present (Curtis and Wendel 2000; Dorn, Levi, and King 2005; Natarajan and Belanger 1998, 1019).
The explanation for the “disorganized” character of drug markets resides in the nature of such criminal activities. It is the market which shapes the criminal actors, not the other way round (Reuter 1983; Paoli 2004b, 203). Given the illegal nature of the market, suppliers do not have access to the regulatory framework normally available to legitimate businesses (Paoli 2002b, 145; Reuter 1983). Moreover, market operators are under constant threat of punishment, and significant resources must be invested to minimize the risk of detection, apprehension, seizure and punishment (Paoli 2002b; Reuter 1983; Decker and Townsend Chapman 2008). These factors discourage the creation of large, structured and monopolistic enterprises (Reuter 2009, 15–16).
In recent years, an increasing number of studies have conducted detailed analyses of drug trafficking groups. They have used various quantitative methods to analyze the organization of drug networks and markets, focusing on their structure, level of integration in the drug trafficking chain and the roles of the individuals involved (Natarajan and Belanger 1998; Natarajan 2000; Natarajan 2006; Morselli and Giguere 2006; Morselli and Petit 2007; Malm, Kinney, and Pollard 2008; Morselli 2009a; Malm, Bichler, and Van De Walle 2009; Natarajan, Zanella, and Yu 2010; Morselli 2010; Jimenez-Salinas Framis 2011; Bright, Hughes, and Chalmers 2012). Among the various methodologies, growing use has been made of social network analysis (hereinafter SNA) and the content analysis of judicial sources, thus providing new insights (Jackson, Herbrink, and Jansen 1996; Morselli 2009b; Campana and Varese 2011). Most of these studies have highlighted flexible and fast-changing groups with low levels of cohesion and organization (Morselli and Giguere 2006; Morselli and Petit 2007; Morselli and Giguere 2006; Natarajan and Belanger 1998; Natarajan, Zanella, and Yu 2010; Natarajan 2006) . At the same time, some of these flexible organizations exhibit a remarkable resilience to law enforcement disruption (Bouchard 2007; Morselli 2010; Morselli and Petit 2007). Exceptionally, some more structured organizations have been identified, with clearer divisions of tasks and roles
(Natarajan 2000). In most of these dynamic networks, activities are managed by small groups of brokers. The latter have crucial roles because they control information and resource asymmetries within criminal groups. This gives them a “competitive edge” over other individuals (and this is the key to their success), but at the same time it grants them access to resources otherwise beyond their reach, to the benefit of the entire group (Morselli 2009b, 16; Decker and Townsend Chapman 2008, 39–45). Within criminal networks, brokers are confronted by the efficiency/security trade-off (Morselli, Giguère, and Petit 2007; Morselli 2009b, 16; Bouchard and Nguyen 2010, 132). On the one hand, efficient criminal operations require the delegation of activities and the diffusion of information; on the other hand, protection against law enforcement requires control over the partners and information. The most successful brokers tend to privilege indirect forms of control, which provide greater security (Baker and Faulkner 1993; Morselli 2010).
To date, no study has applied these new approaches in studying the structure of mafias, such as the ‘Ndrangheta, when engaged in drug trafficking. The structure of highly organized mafias has remained largely understudied. A few studies on the Italian drug market have stressed that there is limited empirical evidence of a monopoly exercised by the mafias (Becchi 1996, 125–127; Paoli 2002b, 145–147; Varese 2006b, 433–438). Indeed, “with the exception of a few mafia strongholds in southern Calabria and western Sicily, the Italian drugs markets have always been open, in which everyone is free to try their fortune selling, importing or manufacturing drugs” (Paoli 2004b, 203). Furthermore, scholars have argued that members of mafias enjoy a large degree of autonomy in their entrepreneurial activities. Therefore, drug trafficking can be performed in association with members of other families as well as with non-affiliated criminals (Paoli 2002a, 74–75). When mafias engage in drug trafficking, they adopt flexible, fast-changing and dynamic partnerships. The formal hierarchical structure leaves room for more pragmatic, opportunity-oriented mechanisms (Paoli 2004b, 198–199). Although these studies have provided some insight into the involvement of mafias in the Italian drug markets, their findings have been based on the analysis of official reports, crime data and judicial decisions. They have therefore adopted a macro approach. These results have never been tested in empirical works analyzing the structure of specific groups. Indeed, the operational organization, the division of tasks, the individuals roles, and the level of structure of specific mafias such as the ‘Ndrangheta have never been analyzed.
This lack of knowledge is particularly surprising, given the notoriety of mafias, their alleged importance in drug trafficking activities, and the extensive literature on them. This inevitably creates space for popular and non-empirical accounts of mafias controlling entire cities and markets, a picture which has been repeatedly discredited by empirical studies. Indeed, no information is available on the internal organization of ‘Ndrangheta groups trafficking cocaine, nor on how the structured and complex nature of such organizations adapts to the flexible and dynamic drug markets.
This study aims to fill this gap by providing a detailed account of the operations of two cocaine trafficking groups belonging to the ‘Ndrangheta. In particular, it addresses the following questions. How do the characteristics of the market affect the organizational structure of the mafias? Is the formal hierarchy important for the organization of drug trafficking? Is there a clear division of tasks and status differentiation? Is the business run by the leaders of the groups? How do leaders manage and control the criminal activities? How do they protect themselves from law enforcement action? The study is organized as follows. The next section presents the data sources and the methodology. Section 3 discusses the results of the analyses. Section 4 concludes, suggesting directions for further research and drawing law enforcement implications.
2. Methodology
1.1. Data sources
The data for the study come from two judicial documents relating to criminal investigations (called Operation Chalonero and Operation Stupor Mundi) on two different criminal groups including members of the ‘Ndrangheta.4 Both documents were court orders (ordinanze) issued by the preliminary investigation judge (Giudice per le indagini preliminari, henceforth GIP) upon request by the prosecution. Operation Chalonero lasted several years and ended in January 2007 with the arrest of 11 people, ordered by the GIP of Reggio Calabria. The telephone interceptions covered the period from August 2003 to June 2004. Chalonero focused on criminal groups belonging to the ‘Ndrangheta and trafficking cocaine from South America to Italy, through Spain. The drug was sold in Italy, particularly in the areas of Milan, Florence, Bologna, Rome and in Calabria (DIA 2007, 106). The court order consisted of 438 pages. Operation Stupor Mundi lasted for nearly five years and ended in May 2007 with the arrest of 38 people on order by the GIP of Reggio Calabria. The telephone interceptions covered the period from June 2002 to April 2004. The operation tackled a criminal group belonging to the ‘Ndrangheta and trafficking cocaine from South America to Italy, through Spain and the Netherlands. The drug was sold in Italy, particularly in the areas of Milan, Turin, Rome and in Calabria (CPA 2008, 195 and 235). The court order consisted of 651 pages.
In the Italian system, court orders such as those analyzed in this study have the function of restricting the suspects’ freedom, and in particular of remanding some of them in custody or pretrial detention. From a comparative perspective, the court orders are broadly similar to arrest warrants in other jurisdictions. The Italian law requires the judge to motivate his/her decision. For this reason, the documents provide a wealth of information for the analysis of the groups and their criminal activities. They contain personal details of the suspects (e.g. name, birth date, residence, citizenship) and of the crimes (for every crime, e.g. drug purchases, the sources report the date, the place, the participants and the modi operandi). They also provide details on the structure of the organization, the roles played by each member, and the evolution of the group during the investigation. Furthermore, the court orders report excerpts from telephone conversations intercepted during the investigation and detailed information about meetings among the suspects observed or reconstructed by the investigators. For each individual in the two groups, this material enabled the reconstruction of the number of contacts (other individuals with whom he/she had talked or had met), conversations (the number of telephone conversations in which he or she had participated, independently of the number of contacts), and meetings (the number of meetings in which he or she had participated, independently of the number of contacts) (Table 1).5
4 Both operations were coordinated by the Antimafia Prosecutor’s Office of Reggio Calabria. The two cases
were selected upon consultation with the Antimafia Investigative Directorate (Direzione Investigativa Antimafia in Italian, hereinafter DIA), a law enforcement agency specialized in the investigation of mafia cases. The DIA provided access to a number of judicial documents relating to approximately a dozen major investigations. The criteria used to select the cases included the direct involvement of the mafias (in this case, the ‘Ndrangheta) in complex drug trafficking operations. The selection aimed at identifying two broadly comparable cases (in terms of the size and type of criminal activities).
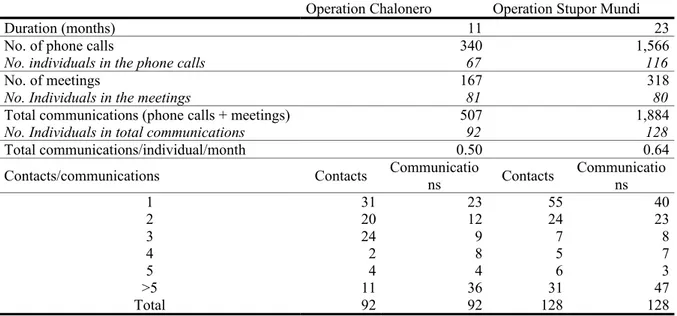
Table 1. Details on the data sources and distribution of individuals by number of contacts and communications
Operation Chalonero Operation Stupor Mundi
Duration (months) 11 23
No. of phone calls 340 1,566
No. individuals in the phone calls 67 116
No. of meetings 167 318
No. Individuals in the meetings 81 80
Total communications (phone calls + meetings) 507 1,884
No. Individuals in total communications 92 128
Total communications/individual/month 0.50 0.64
Contacts/communications Contacts Communications Contacts Communications
1 31 23 55 40 2 20 12 24 23 3 24 9 7 8 4 2 8 5 7 5 4 4 6 3 >5 11 36 31 47 Total 92 92 128 128
Overall, the information contained in the court orders provided rich reconstructions of the activities and structure of the groups. In both cases, the judges report abundant information significant for the proceedings, selecting relevant communications from all intercepted conversations, which included other information not pertinent to the cases, e.g. personal communications. The information extracted from the two sources complied with the requirements identified by the literature for the analysis of phone intercepts (Campana and Varese 2011, 15–17). In particular, criminals spoke freely and did not apply self-censorship in their conversations, and several excerpts demonstrate that they did not suspect that they were being investigated. Furthermore, the number of the participants in the conversations or the meetings was quite large, particularly compared to the number of individuals arrested. The number of individuals mentioned in the court orders was 92 for Chalonero and 128 for Stupor Mundi, while the arrested individuals were 11 and 38 respectively. Therefore, the group coverage was large and exceeded the subsets of the suspects of criminal activities, providing a broader picture of the activities of the groups. Finally, Campana and Varese argued that the amount of communications extracted from a “large” data set should include “at least several hundred conversations” and they stated that their two previous studies had covered periods “of ten and seven months” (Campana and Varese 2011, 17). Both conditions are satisfied by the case studies selected. The total amount of communications (telephone conversations and meetings) was 507 in Chalonero and 1884 in Stupor Mundi, and the duration of the investigations was 11 and 23 months, respectively (Table 1).6
Given the above considerations, the court orders provide information which is broadly representative of the activities and communications of the two drug trafficking networks. Data were available for a large set of individuals and did not concern the arrested suspects alone. This enabled a detailed analysis to be made of the structure of the mafias involved in drug trafficking beyond the narrower scope of the criminal proceedings.
6 Considering the different time spans of the two operations, and the number of individuals involved, the ratio of
1.2. Analysis of the two criminal groups
Analysis of the data in the two court orders highlighted that most individuals participated only marginally in the networks (Table 1). Many individuals were in contact with only one or two other individuals and participated in a low number of communications, while a limited number of individuals had a very high number of contacts and participated in a high number of communications. This picture is consistent with previous studies using similar sources and which point out a concentration of communications in criminal networks (Natarajan 2000, 277; Natarajan 2006, 179; Morselli 2009b, 51).7 The two ‘Ndrangheta networks were not an exception to this pattern. This may confirm that the finding that the specific features of drug markets tend to shape the structure of relations among the network’s members (Raab and Milward 2003, 433). The mafias conform to this pattern, and to prevent the excessive diffusion of information about illegal activities, only a limited set of individuals are the most active in the network.
The large majority of individuals with marginal participation were not directly involved in the criminal activities. Their mention may have been due to different circumstances, e.g. participation in a large meeting in a bar or personal phone conversations used by the court to demonstrate the location of another interlocutor at a specific date and time. Other individuals with minimal participation in the networks were minor subjects, frequently unidentified by law enforcement because of their occasional appearance in the communications, e.g. drug consumers or occasional street dealers.
To analyze the structure and activities of the two drug trafficking groups, selection was made of a main group of individuals for each case study. Similar operations were conducted also in previous studies using similar data sources, with different selection methods. Natarajan used a quantitative selection, including in her study only individuals with at least two contacts and participating in at least five communications (Natarajan 2006, 179). This led to the inclusion in the main group of only 38 individuals out of 294. Morselli and colleagues in various studies adopted a qualitative selection method, excluding individuals not clearly involved in criminal activities. This procedure always resulted in a reduction of the networks analyzed.8
In the case of the two ‘Ndrangheta networks, the sampling procedure adopted both a quantitative and a qualitative approach. Firstly, it selected only subjects with at least two contacts and participating in at least five communications. Secondly, it verified that the resulting groups did not exclude relevant individuals, i.e. suspects, arrested persons, or others with a significant role. The sampling resulted in a main group of 39 individuals for Operation Chalonero and 48 individuals for Operation Stupor
7 In particular, in a group analyzed by Natarajan, the most important player in the network participated in 83%
of total communications and was in contact with 24 out of 27 individuals in the network, while the second most important subject participated in only 16% of the conversations and had only 5 contacts (Natarajan 2000, 278). The most active node in Morselli’s 110-individual Caviar network was in contact with 49% of the other subjects and participated in 56% of the conversations. The second and third most active nodes were both in contact with 18% of the other members and participated in 9% and 6% of the total conversations (Morselli 2009b, 85). Contacts and conversations were calculated from the matrixes provided by Morselli in his book’s appendix (Morselli 2009b, 173–176).
8 In Morselli’s Ciel network, the final network was composed of 25 out of 75 individuals included in the
surveillance net (Morselli 2009b, 29). In their analysis of the Caviar network, Morselli and colleagues selected 110 individuals out of the 318 identified in the data (Morselli and Giguere 2006, 190; Morselli and Petit 2007, 113–114; Morselli, Giguère, and Petit 2007, 146; Morselli 2009b, 30). In the two car-rigging networks Siren and Togo, the study selected 44 and 33 individuals, out of an initial set of 68 and 45, respectively (Morselli and Roy 2008, 78–79; Morselli 2009b, 31). In the study on the Hells Angels in Quebec, the initial data included 1500 individuals, which were restricted to a final network of 174 subjects (Morselli 2009a, 152; Morselli 2009b, 33). Finally, in Morselli’s study on street gangs in Montreal the data identified 101 individuals, but only 70 were included in the analysis (Morselli 2009b, 35).
Mundi. This procedure selected the individuals with relatively major roles in the criminal activities, excluding subjects with marginal ones or with limited available information. Notwithstanding the significant reduction of the number of individuals, the loss of information was minimal.9 The resulting groups were representative of the main participants in the criminal activities and did not exclude any important player.10 The subsequent analyses were conducted only on the two main groups.
1.2.1.Task and status analysis
For each individual in the main groups, the analysis identified the main task in the drug trafficking chain and the relative status, based on the general information provided by the court orders and on the content analysis of a sample of conversations (Table 2).11
The status analysis relied on a coding scheme which was applied to the sample of conversations. The literature offers very limited examples of analyses of the status of individuals based on the content of conversations, all of them including elements such as “giving orders”, “requesting information” and “expressing (dis)satisfaction” (Natarajan 2000; Varese 2006a; Natarajan 2006). The study adapted the codes suggested by the literature to the Italian language and created the following six-code scheme for the status analysis:
(a) express (dis)satisfaction (b) request information (c) not provide information (d) give orders
(e) not seek clarification of orders
(f) not use the 3rd person singular or 2nd person plural when talking to others.12
Each individual was attributed a status score resulting from application of the coding scheme (one point for the presence of each of the above listed codes). In case of individuals participating in multiple conversations, the status score was the mean of the scores of the single conversations. For a few individuals there were no conversations available. This was because these individuals had participated in meetings but not in conversations. In these cases (n=3 and n=6 for Chalonero and Stupor Mundi, respectively), the status score was attributed on the basis of the detailed analysis of the overall context described in the court order. In particular, the status score was based on the considerations of the court and of the prosecution, and on the status of individuals performing the same task or with the same role within each criminal network.13 Furthermore, the individuals in each 9 In the undirected and valued affiliation matrixes with all the individuals participating in the communications
(counting how many times each individual communicated with any other individual), the sum of the connections was 1132 for Chalonero and 4008 for Stupor Mundi. In the submatrixes including only the individuals in the main groups, the connections were 916 and 3718, i.e. 80% and 92% of the initial networks.
10 The study conducted the network analysis also on the whole groups and on the groups including individuals
with at least two contacts. The distribution of degree and betweenness centrality scores was very similar to the one obtained from the main groups selected.
11 The sample of conversations included one conversation for every connected couple of individuals in the main
groups. The second conversation for every dyad was randomly selected. When a dyad was involved in a single conversation only, the analysis focused on that conversation.
12 In Italian, it is rare to use expressions like “sir”. Respect or deference, signals of higher status, are normally
expressed with the use of the third person singular (more frequently) or the second person plural (rarer and used in some Southern areas). For example, the informal and standard expression “tu sei” (“you are”), in more formal language would become “lei è” (person singular) or “voi siete” (person plural).
13 For example, in Chalonero, N1 was a fugitive, and he did not participate in telephone calls in order to avoid
being tracked and arrested. At the same time, he was the boss of the organization, as evident both from the considerations of the court and the fact that his agreement was required for major decisions. For this reason, he received a status score of 4, equal to that of the highest-status individuals identified in the same operation.
group were divided into three status classes (Table 2).14 The results of the status analysis were controlled for their reliability and validity. Reliability was assessed through independent coding of the sampled conversations by two coders. The correlation of the status scores assigned by the two coders was 0.85, in line with previous studies (Natarajan 2000, 182; Natarajan 2006, 280). The validity was verified through comparison of the resulting scores with the overall picture emerging from the court orders. For both orders, the status analysis assigned higher scores to the most prominent individuals in the networks, e.g. senior affiliates to the ‘Ndrangheta, acknowledged bosses, or older members of families (consistently with the important role of family ties in the mafias).
1.2.2.Network analysis15
This analysis examined the relations among the individuals in the two main groups through the application of the SNA approach and measurements.16 Firstly, the analysis calculated measures allowing description of the overall structure and connectedness of the network. These measures were density, degree centralization, and overall clustering coefficient.17 The resulting scores were similar: density was 11.5% and 14.9%; degree centralization was 68.4% and 71.1%; and the weighted clustering coefficient was 24.3% and 32.2% for Chalonero and Stupor Mundi respectively. Secondly, the analysis calculated the centrality of the individuals in the two groups. Several measures of centrality have been developed for different purposes (Hanneman and Riddle 2005, 147; McGloin and Kirk 2010, 219–220; Morselli 2009b, 38; Scott 2000, 82; Wasserman and Faust 1994, 169). This analysis adopted the two measures most frequently used in the study of criminal networks (Morselli 2009b; Varese 2006a): degree centrality and betweenness centrality (Table 2). The former is the simplest centrality parameter, and it measures the number of a node’s contacts. Betweenness centrality calculates the number of times a node lies in the shortest paths between two other nodes in the same network. In general, degree centrality reflects active involvement in group activities, but in the case of criminal networks it can also be interpreted as a sign of vulnerability. From this perspective, betweenness centrality may reveal more strategic positioning within a network, ensuring less visibility while allowing control to be maintained over the flow of information (Morselli 2010). 14 The medium status class included subjects with status scores within the mean +/- a half standard deviation; the
low status class comprised status scores lower than the mean minus half standard deviation and the high status class included individuals with a status score higher than the mean plus half standard deviation. The classes ranges were very similar between the two networks. The thresholds were 2.4 and 3.0 for Chalonero and 2.3 and 3.0 for Stupor Mundi.
15 The network analysis was performed using Ucinet 6 (Borgatti, Everett, and Freeman 2002).
16 Unless differently stated, the network analysis was performed on binary, undirected matrixes. This was
consistent with the approaches adopted in the literature on drug trafficking using SNA. Moreover, the use of valued, directed data would have excluded an important set of information, namely the data concerning meetings, which could not be gathered in directed form.
17 The density of the network is “the proportion of all possible ties that are actually present” (Hanneman and
Riddle 2005, 98; McGloin and Kirk 2010, 216–217; Morselli 2009b, 47). Density provides a measure of the overall level of a network’s connectedness.
The centralization of a network is a measure of “the degree of variability in the degrees of actors in our observed network as a percentage of that in a star network of the same size” (Hanneman and Riddle 2005, 50). A star network is a network where one central node is connected to more peripheral nodes, assuming the shape of a star. In these networks, the central node is the most important, i.e. central, according to all types of centrality measures. Centralization varies according to the measure of centrality adopted (e.g. degree centrality and centralization, betweenness centrality and centralization). Centralization measures indicate the extent to which the most central node of the network dominates the whole network.
The overall clustering coefficient of a network is the mean density of the neighborhood of each node (i.e. all the nodes directly connected to a given node). In order to account for different neighborhood sizes, the clustering coefficient may be weighted by the degree of each node (Hanneman and Riddle 2005, 124). The clustering coefficient measures the likelihood that two individuals connected to the same third individual are themselves connected.
The results of the analyses were used to investigate the structure of the two ‘Ndrangheta groups.
1.3. Limitations
The data sources and methodology had some limitations. First, as with most judicial documents, the data collection served mainly criminal procedural and evidentiary purposes. The specific requirements of the legal system may affect the completeness of the information. Second, the sources were inevitably affected by the point of view of the police and the prosecution. Investigative hypotheses and strategies necessarily shaped the boundaries and characteristics of the groups investigated. Lastly, some parts of the criminal groups may have been omitted and/or overlooked, either because of the criminals’ strategies to deflect attention or because of the limited resources available to law enforcement.
This study is inevitably exposed to the above problems. Unfortunately, these issues seem common to most studies on criminal networks, and the literature frequently highlights them (Malm and Bichler 2011, 20–22; Morselli 2009b, 41–50; Xu and Chen 2008, 63). But there are elements to suggest that these problems were relatively limited for the two groups studied. Firstly, Chalonero and Stupor Mundi were long-lasting investigations, so that the possibility that important individuals in the networks were missed should be relatively low. Secondly, the direct analysis of conversations adopted for the task and status analysis avoided excessive influence by the comments of the prosecution and the judge. Finally, the literature argues that network properties and measures are robust even if tested for missing data (Morselli 2009b, 48; Xu and Chen 2008, 63–64).
For the above reasons, although this study may not provide a flawless description of the actual organization of the two criminal groups, the data are sufficiently reliable for the analysis of the organizational structure of the ‘Ndrangheta. Indeed, several contributions in the literature have used similar judicial sources to study other criminal organizations (Natarajan and Belanger 1998; Natarajan 2000; Natarajan 2006; Morselli and Giguere 2006; Varese 2006a; Morselli, Giguère, and Petit 2007; Morselli and Petit 2007; Malm, Kinney, and Pollard 2008; Malm, Bichler, and Van De Walle 2009; Morselli 2009a; Heber 2009; Natarajan, Zanella, and Yu 2010; Morselli 2010; Campana 2011; Bright, Hughes, and Chalmers 2012; Varese 2012).
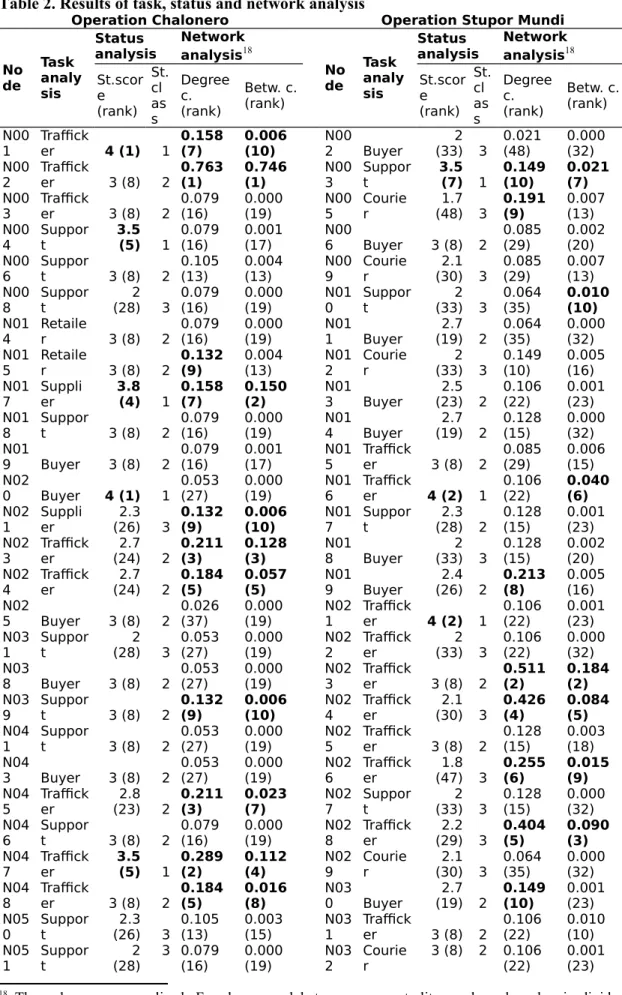
Table 2. Results of task, status and network analysis
Operation Chalonero Operation Stupor Mundi
No de Task analy sis Status analysis Network analysis18 No de Task analy sis Status analysis Network analysis18 St.scor e (rank) St. cl as s Degree c. (rank) Betw. c. (rank) St.scor e (rank) St. cl as s Degree c. (rank) Betw. c. (rank) N00 1 Trafficker 4 (1) 1 0.158 (7) 0.006 (10) N002 Buyer (33)2 3 0.021 (48) 0.000 (32) N00 2 Trafficker 3 (8) 2 0.763 (1) 0.746 (1) 3N00 Support 3.5(7) 1 0.149 (10) 0.021 (7) N00 3 Trafficker 3 (8) 2 0.079 (16) 0.000 (19) 5N00 Courier (48)1.7 3 0.191 (9) 0.007 (13) N00 4 Support 3.5(5) 1 0.079 (16) (17)0.001 N006 Buyer 3 (8) 2 0.085 (29) 0.002 (20) N00 6 Support 3 (8) 2 0.105 (13) 0.004 (13) 9N00 Courier (30)2.1 3 0.085 (29) 0.007 (13) N00 8 Support (28)2 3 0.079 (16) 0.000 (19) N010 Support (33)2 3 0.064 (35) 0.010 (10) N01 4 Retailer 3 (8) 2 0.079 (16) 0.000 (19) N011 Buyer (19)2.7 2 0.064 (35) 0.000 (32) N01 5 Retailer 3 (8) 2 0.132 (9) 0.004 (13) 2N01 Courier (33)2 3 0.149 (10) 0.005 (16) N01 7 Supplier 3.8(4) 1 0.158 (7) 0.150 (2) N013 Buyer (23)2.5 2 0.106 (22) 0.001 (23) N01 8 Support 3 (8) 2 0.079 (16) 0.000 (19) N014 Buyer (19)2.7 2 0.128 (15) 0.000 (32) N01 9 Buyer 3 (8) 2 0.079 (16) 0.001 (17) 5N01 Trafficker 3 (8) 2 0.085 (29) 0.006 (15) N02 0 Buyer 4 (1) 1 0.053 (27) 0.000 (19) 6N01 Trafficker 4 (2) 1 0.106 (22) 0.040 (6) N02 1 Supplier (26)2.3 3 0.132 (9) 0.006 (10) N017 Support (28)2.3 2 0.128 (15) 0.001 (23) N02 3 Trafficker (24)2.7 2 0.211 (3) 0.128 (3) N018 Buyer (33)2 3 0.128 (15) 0.002 (20) N02 4 Trafficker (24)2.7 2 0.184 (5) 0.057 (5) N019 Buyer (26)2.4 2 0.213 (8) 0.005 (16) N02 5 Buyer 3 (8) 2 0.026 (37) 0.000 (19) 1N02 Trafficker 4 (2) 1 0.106 (22) 0.001 (23) N03 1 Support (28)2 3 0.053 (27) 0.000 (19) N022 Trafficker (33)2 3 0.106 (22) 0.000 (32) N03 8 Buyer 3 (8) 2 0.053 (27) 0.000 (19) 3N02 Trafficker 3 (8) 2 0.511 (2) 0.184 (2) N03 9 Support 3 (8) 2 0.132 (9) 0.006 (10) 4N02 Trafficker (30)2.1 3 0.426 (4) 0.084 (5) N04 1 Support 3 (8) 2 0.053 (27) 0.000 (19) N025 Trafficker 3 (8) 2 0.128 (15) 0.003 (18) N04 3 Buyer 3 (8) 2 0.053 (27) 0.000 (19) 6N02 Trafficker (47)1.8 3 0.255 (6) 0.015 (9) N04 5 Trafficker (23)2.8 2 0.211 (3) 0.023 (7) N027 Support (33)2 3 0.128 (15) 0.000 (32) N04 6 Support 3 (8) 2 0.079 (16) 0.000 (19) 8N02 Trafficker (29)2.2 3 0.404 (5) 0.090 (3) N04 7 Trafficker 3.5(5) 1 0.289 (2) 0.112 (4) N029 Courier (30)2.1 3 0.064 (35) 0.000 (32) N04 8 Trafficker 3 (8) 2 0.184 (5) 0.016 (8) N030 Buyer (19)2.7 2 0.149 (10) 0.001 (23) N05 0 Support (26)2.3 3 0.105 (13) 0.003 (15) N031 Trafficker 3 (8) 2 0.106 (22) 0.010 (10) N05 1 Support (28)2 3 0.079 (16) 0.000 (19) N032 Courier 3 (8) 2 0.106 (22) 0.001 (23)
18 The values are normalized. For degree and betweenness centrality, each node value is divided by the
maximum possible centrality and can be read as a percentage of the maximum possible centrality within the network.
N05 3 Buyer 3.5(5) 1 0.053 (27) 0.000 (19) 3N03 Courier (33)2 3 0.085 (29) 0.001 (23) N05 4 Buyer 3 (8) 2 0.079 (16) 0.008 (9) 4N03 Support (33)2 3 0.149 (10) 0.018 (8) N05 6 Supplier (28)2 3 0.079 (16) 0.000 (19) N035 Trafficker 3.9(6) 1 0.447 (3) 0.085 (4) N05 7 Support (28)2 3 0.132 (9) 0.024 (6) N036 Support (23)2.5 2 0.128 (15) 0.002 (20) N05 8 Buyer (28)2 3 0.079 (16) 0.000 (19) 7N03 Support (33)2 3 0.106 (22) 0.000 (32) N06 1 Retailer (28)2 3 0.053 (27) 0.000 (19) N038 Trafficker (19)2.7 2 0.830 (1) 0.448 (1) N06 4 Buyer (28)2 3 0.053 (27) 0.000 (19) 9N03 Trafficker (33)2 3 0.128 (15) 0.001 (23) N06 5 Supplier (28)2 3 0.026 (37) 0.000 (19) N041 Support 4 (2) 1 0.043 (43) 0.000 (32) N06 6 Supplier (28)2 3 0.053 (27) 0.000 (19) N042 Courier (33)2 3 0.043 (43) 0.000 (32) N07 7 Supplier 4 (1) 1 0.026 (37) 0.000 (19) N043 Buyer (23)2.5 2 0.064 (35) 0.001 (23) N08 7 Supplier (28)2 3 0.105 (13) (16)0.002 N044 Buyer 3 (8) 2 0.043 (43) 0.000 (32) N09 0 Retailer (28)2 3 0.053 (27) 0.000 (19) N045 Support 4 (2) 1 0.064 (35) 0.000 (32) Minimum 2.0 0.026 0.000 N046 Trafficker 4.5(1) 1 0.234 (7) 0.008 (12) Maximum 4.0 0.763 0.746 N047 Support (33)2 3 0.043 (43) 0.000 (32) Mean 2.8 0.115 0.033 N048 Buyer 3 (8) 2 0.085 (29) 0.003 (18) St. dev. 0.6 0.121 0.122 N049 Buyer 3 (8) 2 0.149 (10) 0.001 (23)
The rank of each node is in parentheses. The first ranks are in bold
N05 0 Support 3 (8) 2 0.043 (43) 0.000 (32) N06 1 Buyer (33)2 3 0.085 (29) 0.000 (32) N06 8 Support (33)2 3 0.064 (35) 0.000 (32) N08 0 Support (26)2.4 2 0.064 (35) 0.000 (32) N12 0 Support 3 (8) 2 0.064 (35) 0.000 (32) Minimum 0.043 0.000 Maximum 4.5 0.830 0.448 Mean 2.6 0.152 0.023 St. dev. 0.7 0.148 0.072
3. Results and discussion
1.4. Division of tasks and status differentiation in the ‘Ndrangheta
Although Chalonero and Stupor Mundi were distinct groups, their operational structures (divisions of labor and status differentiation) were similar and comparable. A first interesting result from the overall analysis of both sources was that formal ranks and positions, characteristics typical of the ‘Ndrangheta, were never mentioned or referred to. Exceptionally, some individuals were widely recognized as prominent and authoritative individuals (for N1 in Chalonero and N46 in Stupor Mundi, the sources indicated that they were the bosses of a ‘ndrina), although no mention was made of any formal charge. Otherwise, the formal hierarchy of the ‘Ndrangheta was never mentioned in the conversations; nor did it influence operational activities in the trafficking. This is remarkable, since other investigations (e.g. the above mentioned Operations Il Crimine and Infinito, see above footnote
Error: Reference source not found) have shown that members of the ‘Ndrangheta frequently discuss affiliations and positions within the formal hierarchy of the organization. On the one hand, this may confirm that, when engaging in drug trafficking activities, the formal hierarchy of the ‘Ndrangheta does not play a major role in the actual organization of the illicit business. This is consistent with the findings of studies pointing out the relative autonomy and flexibility of these activities and the general need to adapt to market rules (Paoli 2004b, 198–199; Raab and Milward 2003, 431). Indeed, the drug trafficking operations were conducted in an open market where different supply channels were simultaneously available and exploitable. No trace of monopoly or oligopoly was apparent. The two groups operated as long-lasting criminal enterprises in a broader network of multiple and rapidly changing criminal partners. On the other hand, signs of a specific internal organization and status differentiation emerged from both the task and status analyses, indicating that the irrelevance of the formal hierarchy in drug trafficking did not automatically entail a flat, egalitarian structure.
The attribution of tasks was easily performed, since in both organizations the roles were immediately apparent from the conversations, and individual members knew their tasks and how to perform them. The tasks found in Chalonero and Stupor Mundi, however, were not directly comparable to previous findings (Natarajan 2000; Natarajan 2006; Bright, Hughes, and Chalmers 2012), given the differences in the types of drugs and modi operandi. Both networks comprised traffickers, buyers, and support individuals. Traffickers had the main task of finding drugs abroad and importing them into Italy. They were brokers with multiple supply channels, and they transferred drugs to other criminals. These were identified as buyers. Buyers were normally based in different areas, in Calabria as well as in important Italian cities (e.g. Milan, Rome, Turin). Buyers usually purchased large quantities, often several kilograms, of cocaine, and they frequently paid the traffickers in advance. Support individuals were members of the criminal groups tasked with a variety of activities. These included the transmission of messages and information, support and protection to fugitives, the transport of drugs, the finding of vehicles, hideouts and shelters. Besides this common structure, there were some differences between the two operations in the tasks performed. There were seven suppliers in Operation Chalonero. They were either drug producers of Bolivian nationality or North Africans with their own contacts with producers. There were also four retailers in Chalonero. These individuals had close links with traffickers and retailed cocaine in different areas. Unlike buyers, they did not pay for the purchase of cocaine in advance but instead were paid by traffickers. There were no suppliers or retailers in the Stupor Mundi main group. Instead, seven individuals were exclusively tasked with the transport of drugs either from abroad (Spain and the Netherlands) to Italy or within Italy. They were both Italians (with different levels of connections to the ‘Ndrangheta) and foreigners.19
The results of the task analysis for both groups revealed signs of clearly articulated criminal enterprises. The criminal activities were organized along a clear division of labor within the ‘Ndrangheta. In both cases, when participants referred to drug trafficking, they frequently talked about “working” and some of them even stated that they were going “on holiday” or taking a few days “off work”. The members of the groups perceived themselves as participants in an enterprise where each individual carried out specific tasks. For example, in Operation Chalonero, N23, an Italian man aged 35-37 years old during the period of phone interceptions, was based in Bolivia and was exclusively tasked with the organization of cocaine smuggling operations to Italy. N23 was in direct 19 The differences in the tasks identified in Chalonero and Stupor Mundi were probably due to both law
enforcement strategies and the selection of the main groups. Indeed, the scope and strategies of the two investigations may have focused on different phases of the drug trafficking chain. Moreover, the procedure used to select the two main groups may have dropped marginal individuals who performed other tasks in the drug trafficking chain. For example, Operation Stupor Mundi identified a few minor retailers and suppliers, but these had a minimal role in the activities of the criminal network and were excluded from the main group.
contact with N77, a Bolivian man which was able to supply large quantities of drugs to the criminal organization. In turn, N23 was constantly in contact with other fellow traffickers based in Italy. He frequently talked to his younger brother N24, who in turn transmitted information to N2 and N47, two of the most active traffickers in the group. The fact that the Chalonero network was able to maintain a “liaison” agent in Bolivia to ensure direct access to cocaine suppliers highlights that the network had a stable channel of supply directly from production countries, a feature not frequently encountered in criminal groups without South American ethnic backgrounds. Stupor Mundi provided another interesting example of the importance of the division of tasks. Different traffickers were identified in this organization. Two young brothers (N27 and N28 in their early twenties at the time of the interceptions) were “assigned” to two different high-status traffickers (N46 and N35 respectively) in order to collaborate with and support them. The subordination was clearly established within the group and any divergence from this was considered as misbehavior. On one occasion, N46 reproached N28 (N35’s assistant) for his conduct (he was trying to collect money to pay for a drug smuggling operation organized by N35 but opposed by N46). When informed of this undue interference, N35 was disappointed and explicitly reminded N28 that he was assigned to him, while his brother (N27) was assigned to N46.
The status analysis also revealed some elements of the internal organization of the two criminal groups. Overall, the distributions of status scores in the two networks were similar. Both in Chalonero and Stupor Mundi there was some variation in the individual scores, with a range of 2-4 and 1.7-4.5, an average score of 2.8 and 2.6, and a standard deviation of 0.66 and 0.70 respectively ( Table 2). In both criminal groups there were a few individuals with a high status and a number of medium-low status individuals. It is possible to broadly compare the two ‘Ndrangheta groups with the results obtained by Natarajan in two different studies. The first study identified a highly structured organization, with clearly identifiable leaders and a number of low-status participants. Status scores ranged between 0 and 5, while the average was 1.6 (Natarajan 2000, 282–285). Natarajan’s second study yielded different results, with a status range of 0-2 and an average of 0.97. This induced Natarajan to argue that the organization had “a flat, egalitarian structure with little differentiation between the core members” (Natarajan 2006, 182). The status scores in the ‘Ndrangheta groups showed more similarities to the first study by Natarajan, which identified an organization with a more elaborate structure. Indeed, the variation of the status scores suggests the existence of differences in the status of individuals. A minority of subjects assumed leading roles in the criminal activity, while the others had less power and lower prestige. This reveals that different layers of structure were present in the two ‘Ndrangheta groups.
A number of conversations provided support for the results of the status analysis. For example, in Stupor Mundi the already-mentioned N46 was a recognized boss within the organization and he received the highest status score (4.5). This was apparent in several conversations where he gave orders to other participants. Furthermore, other individuals, including medium-level traffickers, frequently reported to him before the finalization of specific deals, since N46 was regarded as particularly experienced and authoritative. On one occasion, N23, a very active medium-status trafficker, explained his plans to smuggle drugs from Spain to N46. The authority of N46 emerges from the indirect approach in the conversation, where he explicitly avoided denying support to the initiative. He instead expressed doubts, saying “if you want my opinion… it would be better to finish the things we’ve already started […] honestly I don’t see things very clearly, I shall say no more…” N23 replied: “I could start the operation slowly, otherwise another group will take it over…what do
you20 think?” N46: “You know what you’re doing…” N23: “No, we’ll do what you want.” N46: “No, [we’ll do] the right thing.” In Chalonero, N2 was one of the most active traffickers and the son of a prominent member of the ‘Ndrangheta N1, regarded by many as an authority (status 4). As already mentioned, N1 was a fugitive during the investigation, and he was unable to manage the criminal activities directly. He never spoke on the telephone, preferring to issue orders through meetings with a few trusted contacts, including his son N2. Notwithstanding this important family tie and the boss’s role as intermediary, N2 had problems in managing drug smuggling operations. Several conversations confirmed that he was not treated with a great deal of respect by his criminal partners. On one occasion, for example, N2 was harshly confronted by N38, a medium-status (3.0) buyer who had incurred financial problems caused by N2’s behavior. The argument was fierce, with insults and threats from both parties. N2: “Who the hell do you think you’re dealing with? You’ve always come (into my home and my restaurant) and done what the fuck you wanted!” N38: “Yes, but the important thing is that I’ve paid, while you haven’t paid […]. If you don’t refund me for this check that’s bounced, I’ll show you, because you’ve fucked me up, I told you […] I’m coming right now, where are you?” N2: “Where am I now? Don’t you know the problems I have now?” N38: “You have problems and who the hell looks after my problems!? […] Do what you want, you behaved like a shit, if you want we’ll close this thing and we won’t see each other anymore because you’re not worth my friendship.” The results of the status analysis captured difficulties faced by N2, assigning him a medium status (3.0). Interestingly, this diverged from the evaluation of the judge, who included N2 among the leaders of the criminal organization. This may have been due to N2’s highly active role in the group, and his participation in a number of smuggling operations. However, as the above conversation demonstrates, N2’s status within the criminal network was not particularly high, since he frequently had problems and his partners treated him without particular respect.
The combination of the status scores highlighted some differences among the statuses of certain tasks (Table 3). In both groups, traffickers scored higher than the other individuals. Buyers ranked second, followed by support individuals, although in Stupor Mundi they had the same average score as buyers. Not surprisingly, retailers and couriers had lower scores in Chalonero and Stupor Mundi respectively. Indeed, these tasks carry more risks, and individuals with lower status may be assigned to them. Suppliers in Chalonero scored relatively low, possibly because many of them were foreign nationals (six out of seven suppliers were non-Italians). Linguistic and cultural barriers or racial prejudices may have prevented or reduced the use of expressions indicating superior status. The higher status score of traffickers is consistent with the considerations advanced by Morselli in regard to the role of brokers in criminal networks when arguing that “brokers are neither patrons nor clients….individuals who are capable of maintaining such a stance are generally well-respected, higher achievers, and strategic participants in the networks that surround them” (2009b, 17). In general, however, the status differences among the different tasks were relatively low. This shows that individuals with different statuses were present within all tasks. It also reveals that, in the two groups, the operational structure was only partially influenced by the status of individuals and, although traffickers had higher scores on average, they were not always the most respected individuals.
20 In Italian, N23 was addressing N46 with the second person plural (“voi”), a sign of deference and respect.
Table 3. Average status scores and number of individuals per task for both networks Supplier Trafficker Buyer Courier Support Retailer Operation Chalonero
Avg. status score 2.6 3.1 2.9
n/a 2.6 2.5
No of individuals 7 8 9 11 4
Operation Stupor Mundi Avg. status score
n/a 2.9 2.6 2.1 2.6 n/a
No of individuals 14 13 7 14
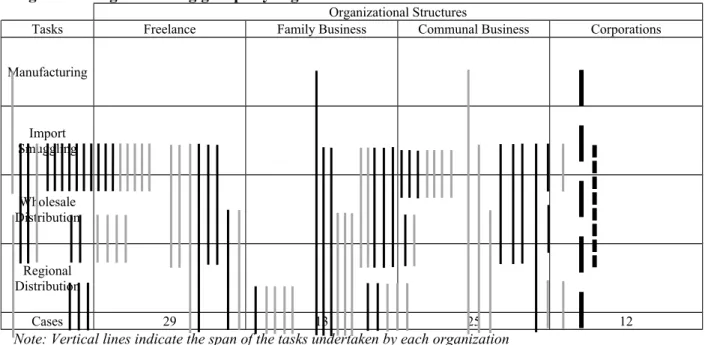
The results on the structure of the two ‘Ndrangheta organizations can be compared with the results of the analysis of drug trafficking groups in New York City conducted by Natarajan and Belanger (1998), which has recently been updated (Natarajan, Zanella, and Yu 2010). The authors drew up a typology of serious drug trafficking organizations by combining two dimensions: the tasks performed in the drug trafficking chain, and the organizational structure (Figure 1).21
Figure 1. Drug trafficking groups by organizational structure and tasks involved
Organizational Structures
Tasks Freelance Family Business Communal Business Corporations
Manufacturing Import Smuggling Wholesale Distribution Regional Distribution Cases 29 13 25 12
Note: Vertical lines indicate the span of the tasks undertaken by each organization
Grey segments: 39 drug trafficking organizations in NYC (1984-1996) by organizational structure and tasks Black segments: 40 drug trafficking organizations in NYC (1997-2007) by organizational structure and tasks Dotted segment: Operation Stupor Mundi
Dashed segment: Operation Chalonero
Source: (Natarajan, Zanella, and Yu 2010) and author’s elaboration
In comparison with the drug trafficking organizations studied by Natarajan and colleagues, Chalonero and Stupor Mundi are among the most complex criminal groups. The organizational structure of the ‘Ndrangheta groups matches that of a corporation. Both groups pursue the main purpose of profiting from drug trafficking; there is a clear division of labor and a distinguishable hierarchy. In regard to the tasks, Chalonero engaged in all four of them. Indeed, the criminal group included subjects responsible for the production or refining of cocaine, for smuggling it into Italy, for buying large quantities, and finally for selling it in small quantities. The only other corporation engaged in all four 21 The two dimensions were based on previous research on drug trafficking: the organizational structure was
elaborated by Curtis and Wendel (2000), while the task division was adapted from Johnson and colleagues (Johnson, Hamid, & Sanabria, 1992).
tasks identified by Natarajan and Belanger was the famous “Pizza Connection” case, where the Sicilian Cosa Nostra imported opium, refined it in Sicily and then exported heroin to the United States, distributing it through a network of pizza parlors (Natarajan and Belanger 1998, 1014). Although the Pizza Connection case had higher turnover and quantities of drugs, Chalonero was similar to it in its structure and vertical integration. Stupor Mundi did not include the production and retail tasks, although some retailers were excluded from the main group because of their limited participation in the activities (see above, footnote Error: Reference source not found).
Overall, the task and status analyses showed that the two ‘Ndrangheta organizations operated according to a clear division of tasks, where most members were in charge of specific functions within the groups. At the same time, individuals with different status scores were encountered in each task, with the traffickers recording an average score slightly higher than those of other participants. This revealed that the operational and reputational levels only partially overlapped, suggesting that key brokering roles (such as that of the traffickers) were not always performed by the most important individuals. This idea was further explored though the application of SNA methods to the two groups.
1.5. Network structure of the ‘Ndrangheta
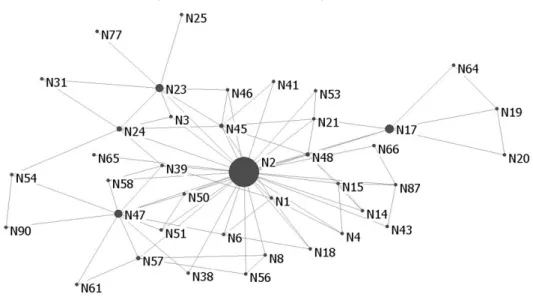
A first visual exploration of the two network graphs highlighted that both groups consisted of two single components (largest connected graph) (Figure 2 and Figure 3).
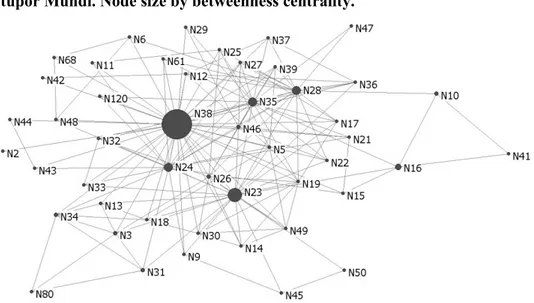
Figure 2. Chalonero. Node size by betweenness centrality22
22 The graphs for this study have been drawn with NetDraw 2.108. The graph layout was obtained through
NetDraw’s spring embedding function, with node repulsion and equal edge lengths. Minor manual adjustments were made to make node labels easily readable.
Figure 3. Stupor Mundi. Node size by betweenness centrality.
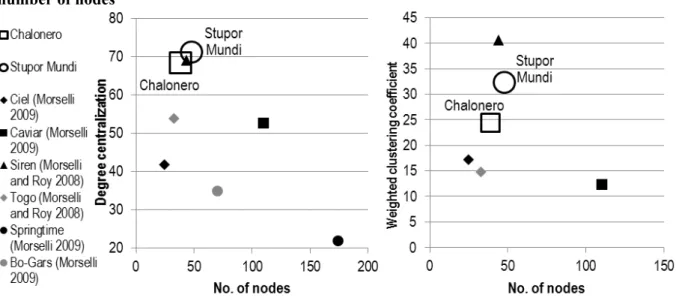
Overall network measures, such as degree centralization and weighted clustering coefficient, showed particular patterns of connections.23 Degree centralization measures the relative importance of the most central individual in a network compared to the other individuals (see footnote Error: Reference source not found). One the one side, high degree centralization implies that the most central node has a strong position within the overall network, thus being able to control information and operations directly. On the other side, the literature has observed that, in criminal networks, direct contacts also imply high visibility and vulnerability (Morselli 2009b, 13). Indeed, highly centralized networks are most vulnerable to the targeted removal of the most central players, which may cause major network disruption. Comparison of the degree centralization scores of Chalonero and Stupor Mundi with other groups described in the literature showed that the ‘Ndrangheta groups had higher scores than most other criminal networks (Figure 4). This indicated that the most central subjects in Chalonero (N2) and Stupor Mundi (N38) had more direct control over the criminal activities than did other network participants. At the same time, the two groups were particularly vulnerable to disruption as a consequence of the removal of the most central subjects. Analysis of the weighted clustering coefficient complemented this interpretation, suggesting alternative explanations.
23 Centralization scores and other overall network measures are sensitive to the number of nodes in a network
(Morselli 2009b, 47 and 96; Scott 2000, 74 and 89–90). Comparison of these measurements should be made with caution and considering the influence of the number of individuals in a network. On this basis, comparison was made of degree centralization and weighted clustering coefficient and the number of nodes of the two ‘Ndrangheta groups with the results of other studies on criminal groups involved in drug trafficking or in the provision of other illicit goods and services (Morselli 2009b, 2009a; Morselli and Petit 2007; Morselli and Roy 2008; Natarajan 2000, 2006). The measures were either drawn from the literature or calculated on the basis of the matrixes provided by Morselli in the appendix of his book (Morselli 2009b, 173–188).
Figure 4. Criminal networks. Degree centralization and weighted clustering coefficient by number of nodes
The clustering coefficient measures how one node’s contacts are in contact among themselves (Morselli 2009b, 40–41). A low score indicates that the contacts of a node are rarely connected, meaning that the removal of specific individuals may break the network or make communications more complicated. A high clustering coefficient, on the contrary, implies that other individuals are in direct contact and consequently that removal of nodes by law enforcement agencies would result in limited network disruption. The weighted clustering coefficients for Chalonero and Stupor Mundi were higher than those of most criminal networks studied in the literature (Figure 4).24 Individuals connected to the same third individual tended to establish connections among themselves more than in previously observed criminal networks.25
These results indicated that the ‘Ndrangheta groups had a particular structure allowing them to balance the efficiency of direct connectivity achieved by the most central individuals with the fact that these were not indispensable subjects, since other nodes were likely to be in contact among them. Indeed, if high degree centralization signaled vulnerability to the targeted removal of N2 and N38 in Chalonero and Stupor Mundi respectively, clustering coefficients higher than those of other criminal networks studied in the literature highlighted that the other individuals were able to enter into contact with each other. Such a structure provides particular strength to the mafias, since the removal of the most central players may result in their replacement with others (Carley, Krackhardt, and Lee 2002). This pattern suggested that ‘Ndrangheta groups may be particularly resilient to law enforcement intervention, since the removal of the most central nodes may be easily remedied through existing network connections, and the arrested individuals may be subsequently replaced with other participants. Interestingly, events in Stupor Mundi provided direct support for this interpretation, highlighting the resilience of the ‘Ndrangheta networks. During the investigation, N24, a very active low-status trafficker based in Milan, was arrested by the police. The organization was very rapid in adapting to the new circumstances. Other traffickers, such as N25 (N24’s brother) and N28, reacted by replacing the arrested criminal in the trafficking of cocaine and swiftly resuming the criminal activities at previous levels.
24 Values were calculated by the author on the basis of the matrixes provided by Morselli in the appendix of his
book (Morselli 2009b).
25 The only exception is the Siren network analyzed by Morselli and Roy, which was involved in the exporting
1.6. The internal organization of the ‘Ndrangheta: Strategic positioning of high status individuals The analysis of node centrality scores provided further insight in the individuals’ positions within the two criminal groups (Table 2). The distributions of the degree centrality scores were relatively similar in both main groups.26 In Chalonero, N2 was by far the most central individual, with degree centrality of more than 76% and betweenness centrality of 74.6% of the possible maximum. Some other individuals had both centrality scores above the average (N17, N23, N24 and N47) (Figure 2). In Stupor Mundi, N38 was the most central individual, with an extremely high degree centrality (he was in contact with 83% of the other members of the network). N38 also had the highest betweenness in the whole network (44.8%). In addition, N23, N24, N28 and N35 had both centrality scores above the group average (Figure 3).
In both networks, there was a very strong correlation between degree and betweenness centrality.27 Consequently it was not possible to identify strategically positioned individuals solely through the SNA, as suggested by Morselli (2010). As found by certain studies, in some criminal networks, degree centrality and betweenness centrality may overlap only partially. This has been interpreted as a signal of strategic positioning: degree centrality would entail greater vulnerability, while betweenness centrality would provide a strategic edge, reducing the risk of arrest and thus providing better security but still granting significant power within the network (Baker and Faulkner 1993; Morselli 2009a; Morselli 2009b, 156–157; Morselli 2010). This was not the case of the two groups analyzed.
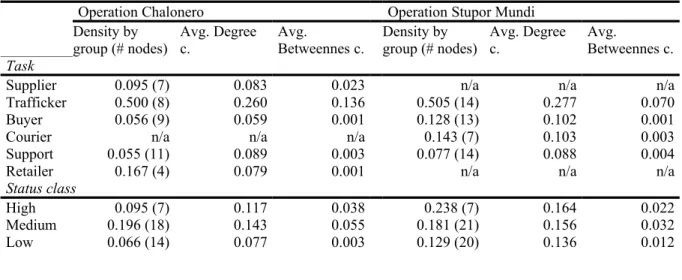
The joint analysis of the results of the task, status, and network analyses enabled identification of specific organizational structures within the two groups. The density and average centrality were calculated by tasks and by status classes, with similar results for both groups (Table 4, upper portion).28 In Chalonero and Stupor Mundi, traffickers were very tightly connected, each of them having contacts with approximately half of the other traffickers. The individuals performing other tasks did not come even close to these figures. Similarly, the average centrality scores for traffickers were significantly higher than those for the other tasks.
Table 4. Density by group, average degree and betweenness centrality by task and status class for both networks
Operation Chalonero Operation Stupor Mundi Density by
group (# nodes) Avg. Degree c. Avg. Betweennes c. Density by group (# nodes) Avg. Degree c. Avg. Betweennes c. Task
Supplier 0.095 (7) 0.083 0.023 n/a n/a n/a
Trafficker 0.500 (8) 0.260 0.136 0.505 (14) 0.277 0.070
Buyer 0.056 (9) 0.059 0.001 0.128 (13) 0.102 0.001
Courier n/a n/a n/a 0.143 (7) 0.103 0.003
Support 0.055 (11) 0.089 0.003 0.077 (14) 0.088 0.004
Retailer 0.167 (4) 0.079 0.001 n/a n/a n/a
Status class
High 0.095 (7) 0.117 0.038 0.238 (7) 0.164 0.022
Medium 0.196 (18) 0.143 0.055 0.181 (21) 0.156 0.032
Low 0.066 (14) 0.077 0.003 0.129 (20) 0.136 0.012
26 Stupor Mundi had a higher mean and standard deviation in the degree centrality scores. As regards the
betweenness centrality, Chalonero presented higher maximum, mean and standard deviation values.
27 Pearson’s r was 0.938 for Chalonero and 0.899 for Stupor Mundi respectively. All correlations were
statistically significant at 0.01 level.
28 The use of status classes was necessary because the correlation between status scores and centrality measures
The results revealed that in both networks traffickers constituted the true operational core of the criminal activities, with more intense interactions among them and with crucially central positioning in the flow of communications. This is consistent with the literature highlighting the importance of brokers in criminal networks identified by high betweenness centrality scores (Morselli 2009b, 15– 18). Indeed, the traffickers had typical brokering tasks connecting supply and wholesale/retail demand for cocaine and arranging smuggling operations. These nodes were the most central in the networks and, remarkably, their betweenness centrality scores were very much higher than those of other individuals. In Chalonero, 4 out 5 nodes with betweenness centrality above the mean score were traffickers; in Stupor Mundi they were 6 out of 6 (Table 2). These results provide further evidence of the fundamental role performed by brokers in criminal groups. Some studies in the literature have discussed the importance of brokers from a theoretical point of view (Coles 2001; Klerks 2001); others have identified brokers through qualitative methods (Pearson and Hobbs 2001; Zaitch 2002; Pearson and Hobbs 2003; Desroches 2005; Natarajan 2006); finally, yet other studies have identified brokerage positions by relying solely on network analysis measures (Baker and Faulkner 1993; Morselli 2010). In the case of the two ‘Ndrangheta groups, the task analysis was independent from the network analysis: yet individuals separately identified as traffickers proved to be the nodes with the highest betweenness centrality. This correspondence further validates the results, emphasizing that broker roles may be constant elements in the social organization of drug trafficking irrespective of the methods adopted to identify them.
Whilst the combination of the task and network analyses was consistent with previous studies highlighting the importance of brokers in drug trafficking, the findings of status and network analyses led to the identification of different organizational patterns within the ‘Ndrangheta groups (Table 4, lower portion).
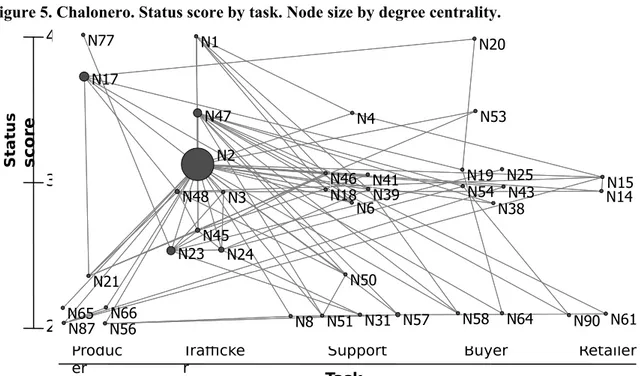
Differently from what could be expected, individuals with higher status were not the most central ones. In Chalonero, subjects of medium status are more densely connected with each other, and the group has higher centrality scores, meaning that they were also more actively involved in the network’s activities.29 In Stupor Mundi, higher-status individuals were more densely connected, although the difference was slight compared to medium-status individuals, possibly owing to the different sizes of the two classes. The average degree centrality did not vary significantly among the status classes, while betweenness centrality was higher for individuals with medium status. Figure 5 and Figure 6 plot the different tasks and the status scores of the individuals in both networks (node size by betweenness centrality). While traffickers were the most central individuals in both groups, among traffickers, the most central nodes are not those with higher status. In Chalonero 3 out the 4 traffickers with above-average betweenness centrality were medium-status individuals; in Stupor Mundi, the 6 nodes with betweenness above the average were all traffickers, but they were equally distributed among the three status classes. Furthermore, the top two traffickers by betweenness centrality were medium-status individuals (Table 2).
These results reveal a particular organizational structure within the two ‘Ndrangheta networks. Individuals with high status are not the most active players in the two networks. Medium-status individuals have higher centrality scores, in particular for betweenness centrality. This pattern appears consistent with the idea that more important individuals may prefer to remain more detached from the operational core of the criminal activities in order to reduce the risk of detection (Morselli 2010). Differently from the results of previous studies, this strategic pattern could not be identified exclusively on the basis of SNA measurements. Its identification was possible only through the joint