Alma Mater Studiorum – Università di Bologna
DOTTORATO DI RICERCA IN
SCIENZE BIOMEDICHE PROGETTO N°4 NEUROFISIOLOGIA
Ciclo XXV
Settore Concorsuale di afferenza: 5/D1
Settore Scientifico disciplinare: BIO/09
TITOLO TESI
THE ROLE OF MEDIAL PARIETO OCCIPITAL CORTEX IN VISUOSPATIAL
ATTENTION AND REACH PLANNING: ELECTROPHYSIOLOGICAL
STUDIES IN HUMAN AND NON-HUMAN PRIMATES
Presentata da: Marco Ciavarro
Coordinatore Dottorato
Relatore
Prof. Claudio Galletti
Prof. Claudio Galletti
i
T
ABLE OFC
ONTENTS1. INTRODUCTION ... 1
2. BACKGROUND AND MOTIVATION ... 3
2.1GENERAL ORGANIZATION OF THE POSTERIOR PARIETAL CORTEX IN HUMAN AND MONKEY BRAIN ... 3
2.2FUNCTIONAL ORGANIZATION AND CORTICO-CORTICAL CONNECTION OF REGIONS OF THE MEDIAL PARIETO-OCCIPITAL CORTEX ... 5
2.2.1 Visual area V6 ... 6
2.2.2 Visuomotor area V6A... 7
2.3POSTERIOR PARIETAL CORTEX IN ACTION: STUDIES ON PATIENTS WITH LESIONS IN THE PARIETO-OCCIPITAL REGION ... 9
2.3.1 Optic Ataxia: a specific disorder in visuomotor coordination ... 9
2.3.2 Is there a link between attention and visuomotor control deficits in patients with Optic Ataxia?... 11
2.4POSTERIOR PARIETAL CORTEX IN ACTION:“VIRTUAL LESION” APPROACH AFFORDED BY TMS TO MIMIC NEURO-PSYCHOLOGICAL CONDITIONS ... 12
2.5THE PRESENT RESEARCH ... 15
3. COVERT SHIFT OF ATTENTION MODULATES THE ONGOING NEURAL ACTIVITY IN A REACHING AREA OF THE MACAQUE DORSOMEDIAL VISUAL STREAM ... 19
3.1ABSTRACT ... 19
3.2INTRODUCTION ... 20
3.3MATERIALS AND METHODS ... 21
3.3.1 Experimental procedures ... 21
3.3.2 The attentional task ... 23
3.3.3 Neuronal data analysis ... 25
3.3.4 Behavioral data... 27
3.4RESULTS ... 28
3.4.1 Behavioral bases of covert attention shift... 28
3.4.2 Single-unit recordings... 29
3.4.3 Neural responses during outward attention ... 30
3.4.4 Neural responses during inward attention ... 36
3.5DISCUSSION ... 40
ii
4. BEHAVIORAL INVESTIGATION ON THE FRAMES OF
REFERENCE INVOLVED IN VISUOMOTOR TRANSFORMATIONS
DURING PERIPHERAL ARM REACHING ... 45
4.1ABSTRACT ... 45
4.2INTRODUCTION ... 46
4.3MATERIALS AND METHODS ... 48
4.3.1 Ethics Statement ... 48 4.3.2 Participants ... 48 4.3.3 Apparatus ... 49 4.3.4 Experimental procedures ... 50 4.3.5 Data analysis ... 51 4.4 RESULT ... 53
4.4.1 Accuracy (constant errors)... 53
4.4.2 Precision (variable errors)... 57
4.5DISCUSSION ... 58
4.5.1 Influence of visual and body fields ... 59
4.5.2 Influence of performing hand ... 60
5. R TMS OF MEDIAL PARIETO-OCCIPITAL CORTEX INTERFERES WITH ATTENTIONAL REORIENTING DURING ATTENTION AND REACHING TASKS ... 63
5.1ABSTRACT ... 63
5.2INTRODUCTION ... 64
5.3METHODS ... 66
5.3.1 Participants ... 66
5.3.2 Stimuli and Apparatus ... 67
5.3.3 Individuation of Anatomical rTMS Sites ... 67
5.3.4 Procedure for rTMS Stimulation ... 68
5.3.5 Procedure ... 69 5.3.6 Data Analysis ... 71 5.4RESULTS ... 72 5.4.1 TMS Effects ... 74 5.5DISCUSSION ... 77 6. GENERAL CONCLUSIONS ... 83 ACKNOWLEDGEMENTS ... 88 REFERENCES ... 89
iii
L
IST OFF
IGURESFigure 2 - 1 Representation of Posterior Parietal Cortex in the macaque monkey and
human brain. ...4
Figure 2 - 2 Postero-lateral view of partially dissected left hemisphere and mesial surface of right hemisphere in macacque brain. ...9
Figure 2 - 3 Experimental condition from Vesia et al., 2010. ...14
Figure 3 - 1 Attentional Task and effects in V6A ...24
Figure 3 - 2 Example of spatially-tuned modulations of neural activity during outward attention epoch. ...31
Figure 3 - 3 Typical visual response in V6A. ...32
Figure 3 - 4 Activity modulation during outward attention epoch. ...34
Figure 3 - 5 Preferred attentional and visual receptive-field locations in area V6A. .35 Figure 3 - 6 Examples of two neurons excited during inward attention epoch. ...37
Figure 3 - 7 Example of a cell modulated during outward and inward attention epochs. ...38
Figure 4 - 1 Schematic representation of the experimental paradigm. ...52
Figure 4 - 2 Absolute errors (Distance). ...54
Figure 4 - 3 Horizontal errors. ...55
Figure 4 - 4 Vertical errors. ...57
Figure 4 - 5 Confidence ellipses areas. ...58
Figure 5 - 1 Stimulation Site and trial structure. ...70
Figure 5 - 2 Mean response times during Sham/Vertex control stimulation. ...73
Figure 5 - 3 rTMS effects on attentional orienting and reorienting during the attention and the reaching task. ...75
Figure 5 - 4 rTMS effect on reaching endpoints. ...76
1
1.
I
NTRODUCTIONDirecting the arm towards a seen object that we want to grasp or touch in the peripersonal space is a typical example of visuomotor coordination. To achieve such actions our visuomotor system must transform stimulus position into coordinates suitable for producing the proper muscle contractions and must constantly update visual information about the object’s location with respect to the viewer and to other objects. In fact, in everyday life, we perform actions in a dynamic visual environment. For example, we are able to grab our phone while we read a book or even to quickly intercept it in flight if it’s falling. Crucial for these processes to smoothly occur is the ability to shift attention covertly (i.e. in absence of overt eye movements). This ability allows to select interesting information in the field of view in a voluntary way, as well as to quickly redirect the attentional focus when changes in location of an object unexpectedly occurs requiring an update of the current motor plan.
Recent behavioral studies in the human have demonstrated that attention is shifted to the goal of a reaching movement even when the eyes remain fixed, suggesting that, as for saccade, there is an obligatory attention shift to the reach goal before the reaching movement begins. (Baldauf et al., 2006; Baldauf and Deubel, 2008). In addition, other recent research has shown that attention was allocated in parallel in two locations when participants made simultaneous eye and hand movements towards separate locations (Jonikaitis and Deubel, 2011).
Previous neuroimaging and neurophysiological studies have shown that the mechanisms involved in the attentional selection of perceptual events and the execution of overt eye movements are implemented by partially overlapping brain systems in the posterior parietal cortex (PPC) and that attentional modulation in these regions may assist the control of eye movements (see Corbetta & Shulman, 2002 for a review). On the other hand, clear evidence about a direct involvement of reach-related areas of the PPC in attentional processes related to the control of arm movements exists (e.g. Goodale, 2011).
2
It is widely accepted that the PPC is critical for the on-line control of action. This has been highlighted especially by neuropsychological studies in Optic Ataxia (OA), a visuomotor deficit resulting from lesion of parieto-occipital region (Karnath and Perenin, 2005). These patients are unable (1) to perform accurate reaching movements especially for object located in the periphery of visual field (Perenin and Vighetto, 1988; Karnath and Perenin, 2005) and (2) to correct their arm movements in-flight to changes in target position (Pisella et al., 2003). Furthermore, recent studies have also demonstrated that the deficit in OA patients is not confined to movement execution but also appears to affect the ability to detect and respond to targets located in the periphery of visual field (Striemer et al., 2007; Striemer et al., 2009; McIntosh et al., 2011). These studies suggested that visuomotor symptoms in OA patients may be affected by the difficulty in shifting attention away from the current gaze position, or reorienting attention (Striemer et al., 2007; Striemer et al., 2009; McIntosh et al., 2011).
Consistent with these themes, the present thesis will examine whether in the PPC, similarly to oculomotor areas that provide signals for overt and covert shifts of attention, also reach-related regions may directly contribute in the shifts of spatial attention necessary to the planning and control of arm movements towards the object in the peripersonal space. To this aim we conducted studies in both monkey and human brain investigating whether a specific reach-related area, located in the dorsal part of the anterior bank of the parieto-occipital sulcus, has been implicated in a variety of attentional processes related to the control of goal-directed arm movements.
3
2.
B
ACKGROUND ANDM
OTIVATIONA brief overview of the theoretical background is presented in this chapter. This study is focused on the PPC, and a brief overview of its anatomic and functional properties is given in the following section. Instead, in the subsequent sections, we focus on some well known studies in monkey and human brain in which the functional and anatomical properties of regions in the caudalmost part of superior parietal lobule (SPL) were investigated, discussing the main conclusions obtained from these studies. Finally, the motivations for the works presented in this thesis are described at the end of the chapter.
2.1 General Organization of the Posterior Parietal Cortex in Human
and Monkey Brain
An extensive overview of anatomic division of the PPC identified regions are out of the scope of this work. The aim of this section is to provide the general background of the anatomical architecture of the PPC and illustrate a map of the anatomical subdivision of the more posterior region of the SPL (i.e. the region around the medial parieto-occipital cortex).
The parietal cortex is anatomically defined by the positions of the three sulci; the lateral sulcus (LuS) separates it from the temporal lobe, the central sulcus (CeS) from the frontal lobe, and the parieto-occipital sulcus (POS) from the occipital lobe. Anatomically the PPC is formed by two lobules: the SPL and inferior parietal lobule (IPL), separated by the intraparietal sulcus (IPS) (Fig. 2-1). The IPL in humans extends to the angular (Ang) and supramarginal (Smg) gyrus, the regions classified as Brodmann area 39 and 40, respectively. The latter occupies the junction of the parietal, temporal and occipital lobes. These two areas play an important role in attention, visual awareness and spatial orientation (see Driver and Mattingley, 1998 for a review). They are described only in the context of studies in humans, since no evidence of the equivalent regions is described in monkeys PPC (Mountcastle et al., 1975; Roland, 1980; Rizzolatti et al., 1998;
4
Michel and Henaff, 2004). On the other hand the regions classified as Brodmann areas 5 and 7a and 7b, the surface inside the IPS, and the related regions on the medial wall of the hemisphere in the parieto-occipital sulcus, have been
extensively described in both human and monkey brain. Specifically, the caudalmost region of SPL contains the most medial part of
Broadmann area 19, a cortical visual association area, and it is partly coextensive with area PO, an extrastriate visual area first defined on the basis of myeloarchitectural organization (Colby et al., 1988). More importantly, recent physiological and neuroanatomical studies in the macaque monkey have demonstrated that area PO contains two distinct areas, the visual area V6 and the visuomotor area V6A (V stands for visual, as it was originally identified for its visual properties) (Galletti et al., 1996). Thanks to neuroimaging methods these areas have been recently mapped also in the human brain and named in humans based on homologies in their visuotopic organization with non-human primate areas (Fattori et al., 2009; Cavina-Pratesi et al., 2010; Filimon, 2010; Pitzalis et al., 2012a; Pitzalis et al., 2012b Pitzalis et al., 2013). Their anatomy and functional roles will be described in more details in the following chapter.
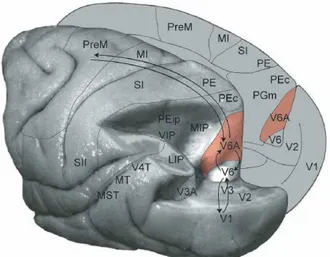
Figure 2 - 1 Representation of Posterior Parietal Cortex in the macaque monkey (A) and human (B) brain.
Each figure depicts the intraparietal sulcus dividing the posterior parietal cortex into superior and inferior regions. Modified from (Husain and Nachev, 2007).
5
2.2 Functional organization and cortico-cortical connection of regions
of the medial parieto-occipital cortex
The results showed in this section are mainly obtained by recording electrical activity in the monkeys brain trained to follow visual or visuo-motor tasks. In a typical setup, a monkey is placed in front of a rear-projected screen or in front of a panel. Microelectrodes are advanced through the intact dura and inserted into the brain tissue, to record extracellular potentials. Finally, the spike trains are extracted from these signals and used to further analyze the typical cell behavior. For analyzing the visuomotor properties, the animal is trained to execute movements towards targets in the visual field. Introducing a delay between the visual input and the movement, separates the sensory and motor related signals.
Instead, the cortico-cortical connections of areas in the parieto-occipital cortex in monkey have been described in the past decade using neuronal tracers, which are substances that, once injected in a brain region, are captured by the neurons and/or by the terminals of nerve cells, and are transported along the neuronal axon up to other brain areas. In this way this technique allows tracing the information flow towards and from the injected region.
In human we cannot record from neurons, because of ethical reasons. Therefore, human studies that are summarized in this section were obtained through the use of non-invasive techniques such as functional magnetic resonance (fMRI).
In the following paragraphs we will discuss the main results about the functional and neuroanatomical characterization of the areas in the parieto-occipital sulcus (POS) in monkey and human brain. This research is focused on area V6A, a reach related region located in the dorsalmost part of the POS. To better understand the roles that area V6A played in processing visuospatial information for the planning and control of goal-directed arm movements, a brief overview of the functional organization of visual area V6, from which V6A area receives directly information, are reported.
6
2.2.1 Visual area V6
Area V6 is a retinotopically-organized visual area located in the ventral part of POS and was first described in the macaque monkey (Zeki, 1986; Galletti et al., 1999) and then, recently, in the human on the basis of functional criteria (Pitzalis et al., 2006). In both primates it is located medially in the parieto-occipital region of the brain, distinguished from contiguous extrastriate areas of the dorsal visual stream (V2, V3 and V6A). In particular area V6 borders with V6A anteriorly and V3 posteriorly (Galletti et al., 1999a; Pitzalis et al., 2006). Similar to the other extrastriate areas, V6 contains a retinotopic map of about 80° of the contralateral hemifield, although unlike other extrastriate areas it lacks an emphasis of the central visual field (Galletti et al., 1991).
Recent studies have demonstrated that area V6 in the macaque contains many cells sensitive to the direction of motion and real motion cells, which show a better response to stimulus movement in the visual field than to a similar retinal image movement self-induced by an eye-movement (Galletti and Fattori, 2003). Thus, these results indicate that V6 can act as real-motion detector to distinguish actual motion from self-induced motion of retinal images (see Fattori et al., 2009a for a recent review). More specifically, these evidences have suggested that area V6 could provide useful information to guide actions and to shift attention towards moving objects (Galletti and Fattori, 2003). According to these data, Pitzalis et al (2012a) recently suggested that V6, in both human and monkey brain, is involved in the “recognition” of movement in the visual field (Pitzalis et al., 2012a).
These conclusions are supported also by evidence from neuroanatomical studies using neuronal tracers in monkeys. These studies showed that area V6 receives visual information directly from V1 and from other extrastriate areas of the occipital lobe, and sends visual information to several parietal areas, all belonging to the dorsal visual stream, including V6A (Galletti et al., 1999a; Galletti et al., 2001; Luppino et al., 2005; Passarelli et al., 2011). In particular, following V6 injection, the neighbouring extrastriate areas V2, V3, V6A and the V1 cortex was marked strongly. Moreover, area V6 results connected also with
7
high-order visual areas MIP and LIPv of the intraparietal sulcus and with MT/V5, V4T and MST, classically considered the key motor region of the dorsal visual stream (Tanaka et al., 1986; Tootell et al., 1997) also involved in attentional processes (Bisley and Pasternak, 2000; Corbetta and Shulman, 2002; Martinez-Trujillo et al., 2007). In conclusion, in line with functional evidence, the pattern of connection among these areas involved in higher order function, such as attention regulations and motor function, confirm that the area V6 could perform the fast form and motion analyzes needed for the visual guiding of action (Pitzalis et al., 2012a).
2.2.2 Visuomotor area V6A
Area V6A is located in the dorsal part of the anterior bank of the POS and borders on areas V6 ventrally, PEc dorsally, PGm medially and MIP laterally (Galletti et al., 1999b). V6A is a non-retinotopically organized visuomotor area receiving visual input from V6 (Shipp et al., 1998; Galletti et al., 2001; Passarelli et al., 2011).
A large number of studies have demonstrated that visual, somatosensory or bimodal cells are present in V6A area (Breveglieri et al., 2002; Galletti et al., 2003). A characteristic of the cells in this region is that they have large visual receptive fields, related to coding of peripheral, rather than foveal signals. The activity of most of the cells is modulated by the eye position, although a minority of them are independent of the gaze angle (Galletti et al., 1999b). Furthermore, it has been shown that in a minority of V6A neurons the receptive field (RF) remained stable in space despite changes in eye position (Galletti et al., 1993). This observation has shown that area V6A contains also cells able to encode the position of objects in the environment (Galletti et al., 1993, 1995). Specifically, when the monkeys perform a task in which the direction of arm movements remain constant while the position of gaze changes, a large amount of neurons in V6A showed a reach related activity (Marzocchi et al., 2008). This was due to the location of reaching target respect to fixation point and not simply to the eye position per se (Marzocchi et al., 2008). Therefore, these studies have suggested
8
that many of cell of area V6A are influenced by the eye and target position signals, but the influence of the hand position, and hand movement signals was also observed (Fattori et al., 2005). In fact, more recent studies based on the delayed reaching and reach to grasp tasks in both human and monkey brain revealed the activity related to planning of the specific type of hand movements, indicating the role of the V6A in the control of hand orientation and grasping (Fattori et al., 2009; Cavina-Pratesi et al., 2010; Fattori et al., 2010).
More importantly, Galletti et al (1996) have shown that the cells of area V6A change in discharge rate after fixation also when the eyes remain fixed, but this change in discharge rate did not occurs during free visual searching in darkness. These observations have suggested (1) that the activity of these cells may reflect the monkey levels of attention (Galletti et al., 1996) and (2) that V6A may play an important role in the planning of motor commands for hand movements, and for visual monitoring of target and hand trajectories.
The role of V6A as a visuo-motor area was supported by neuro-anatomical studies performed in the macaque brain (Shipp et al., 1998; Galletti et al., 2001; Luppino et al., 2005; Gamberini et al., 2009). These studies demonstrate as V6A represents the source of most of the inputs to the motor and premotor regions of the frontal lobe, supplying the information necessary for initiation of the reaching movements. In particular Galletti et al. (2001) have demonstrated that V6A receives from V6 and projects the outputs directly to the dorsal premotor cortex in the frontal cortex. It is importantly to note that all these cortical connection are bidirectional suggesting that area V6A has both visual and motor properties, features which can be useful for the visual guidance of hand movements (Fig. 2-2). On the basis of these evidences Galletti et al (2004) have suggested that area V6A is a crucial node of the most direct pathways from V1 to the dorsal premotor cortex, that form a short route from vision to action which is thought to be useful for the on-line control of hand actions. In summary, this pattern of connections helped to highlight that the area V6A is crucial in spatial representation for control of arm movements, providing signals for visually guided reaching for the motor-related regions.
9
Figure 2 - 2 Postero-lateral view of partially dissected left hemisphere and mesial surface of right hemisphere in macacque brain.
Arrows trace anatomical bidirectional connections between different cortical areas of dorso-medial visual stream. It is a cortical loop that includes visual, visuomotor, and motor areas. This pathway connects the primary visual area with the premotor areas of the frontal cortex. As shown, area V6A receives and sends information from area V6. Likewise, area V6A exchanges information with the premotor cortex. From (Fattori et al., 2007).
2.3
Posterior parietal cortex in action: studies on patients with lesions
in the parieto-occipital region
Valuable knowledge on the parieto-occipital region functions has been collected through clinical examination of patients with parietal lesions. Specific impairment of the visual control of limb movements has been observed in patients with lesions that involve the parieto-occipital region (Blangero et al., 2009).
2.3.1 Optic Ataxia: a specific disorder in visuomotor coordination
The term Optic Ataxia (OA), first introduced by Balint (1909) and followed by Holmes (1918), is a high-level visuomotor impairment characterized by incapacity to properly complete visually guided reaching and grasping tasks, which cannot be explained by any simple deficit in visual or motor processing. Although
10
discussions about which parietal regions are related to the emergence of OA still exist, the common believe is that this disorder appears as a consequence of lesions of the parieto-occipital region, which include the putative homologue of monkey area V6A (e.g. Khan et al., 2005).
Patients with OA exhibit large directional errors when reaching movements were performed towards objects located in the peripheral visual field, outside the field of view, whereas misreaching largely disappears if the patient performs reaching for object presented in central vision (Perenin and Vighetto, 1988; but see also Gréa et al., 2002; Milner et al., 1999). In particular, several studies have shown that the errors were towards the direction of gaze even when instructed to reach elsewhere, situation that gives rise to the “magnetic misreaching” and suggests that patients programmed they movements in oculocentric coordinates (Carey et al., 1997; Jackson et al., 2005) In addition, a number of studies have reported that specific property of this behavioral disorder is the hemispheric asymmetry that was observed when the lesion was unilateral (Perenin and Vighetto, 1988; Blangero et al., 2008). Right-handed patients with unilateral lesions on the right hemisphere, exhibited the so called “visual field effect”, a deficit that manifests in the inability to perform accurate reaching movements with both hands in the contralateral visual space. Instead, in the case of left-damaged patients, the “hand effect” was observed, the deficit in reaching appeared for the right hand only, for targets in both visual fields (Perenin and Vighetto, 1988; Blangero et al., 2008). On the basis of these results, recently Blangero et al., (2008) have developed a model to account for these effects. The authors have proposed that reaching movements are based on two independent spatial representations, i.e. the target and the hand location, probably controlled by two distinct modules. The target location would be coded first in gaze-centered coordinates and combined with the spatial representation of the hand to control the movements execution (Blangero et al., 2008).
Additional symptoms in patients with damage of parieto-occipital region are the problems in avoiding obstacles and correcting the hand trajectory during reaching (Schindler et al., 2004). In other words, in tasks where the target position
11
was changed during reaching execution (perturbed condition), patients were not able to correct the hand direction on time. In contrast, no major abnormal effects were observed in the foveal (unperturbed) condition (Pisella et al., 2000; Gréa et al., 2002; Blangero et al., 2008). Based on these evidences Rossetti et al., (2003) proposed that the impaired performance of OA patients in tasks requiring real-time automatic adjustments to moved objects could be explained by a deficit in the process of fast on-line visuomotor control, which is involved in rapid motor correction of the ongoing action. Moreover the authors suggested that this specific impairment in realtime motor control may explain the pattern of deficit observed in optic ataxia with respect to distinction between peripheral/central vision (Rossetti et al., 2003).
2.3.2 Is there a link between attention and visuomotor control deficits in patients with Optic Ataxia?
Studies on OA patients have argued and demonstrated that visuomotor deficits for visual targets, especially in the periphery of visual field, can occur independently from perceptual disorders. However, recent studies, which have investigated more thoroughly the perceptual and attentional deficit in OA patients, have revealed impaired discrimination of object location or the orientation in extrafoveal vision that may reflect an impairment in orienting attention towards objects located in the ataxic fields (Michel and Henaff, 2004; Rossetti et al., 2005; Pisella et al., 2009). In recent years, more stringent assessments have further supported this hypothesis (Striemer et al., 2007; Striemer et al., 2009), although their conclusions are mixed. For example, Striemer et al. (2007) have investigated the attentional deficit of two OA patients using a cued (exogenous and endogenous) paradigm. In this way, the authors have explored the ability to detect and respond to peripheral cued target in absence of overt goal-directed arm movement. The authors found that the deficit affects both the orienting and reorienting of attention in the ataxic field (i.e. the voluntary shift of attention towards peripheral target and the shift of attention generated by changes in the target location), suggesting that it was consistent with an overall decrease in the salience in this portion of visual fields.
12
Moreover, in a more recent study Striemer et al (2009) have investigated the possible relationship between attention and reaching comparing the response time to targets detection with the pattern of errors during the reaching execution to peripheral targets. The authors found a different pattern of errors between attention and reaching tasks in OA patients compared with control group, thus proposing that attentional and visuomotor deficits arise from independent mechanisms, accordingly with the most accepted theory about visual of visual processing (Goodale & Milner., 2006). Instead, in more recent studies McIntosh et al., (2011) using a task in which peripheral target jumps towards peripheral location have suggested that the two deficits could be linked, because peripheral target jumps slowed perceptual discrimination and mirrored the reaching deficit.
In conclusion, although the issue remains controversial, overall these studies suggested that the deficits seen in these OA patients could be caused by a deficit in initial decoupling of attention or in online monitoring of movements that imply covert attention shifts, of non-standard visually-guided reaches, rather than simply in the planning of reaching movements.
2.4 Posterior parietal cortex in action: “virtual lesion” approach
afforded by TMS to mimic neuro-psychological conditions
In this section, I would like to discuss the more recent advances in our understanding of the role of the PPC in visuo-motor planning and control provided by Transcranial Magnetic Stimulation (TMS) studies. In the last few years, TMS has been used to investigate in details the relationships between the PPC and visuo-motor control (see Vesia and Crawford, 2012 for a recent review). In fact, TMS, by directly interfering with ongoing neural activity to create transient “virtual lesions”, provides exactly the information on causal relations between brain and behavior that cannot be provided by correlative functional imaging or other neurophysiological techniques (Sandrini et al., 2011). This technique has an exquisite temporal resolution, allowing a detailed investigation of visuo-motor control while it unfolds over time. In addition, TMS has a good
13
spatial resolution, allowing a study of functional topography for visuo-motor function within human PPC. In other words this technique allows one to interfere with a specific stage of visuomotor transformation in a particular cortical area.
In a series of recent studies Busan and collaborators used TMS to stimulate medial parieto-occipital, parietal and premotor regions. In this way the authors have identified a discrete network of regions that were involved in the preparation of reaching movements (Busan et al., 2009b; Busan et al., 2009a). In particular, stimulating on-line (i.e. during the execution of task) with a single pulse of TMS the medial parieto-occipital region at the start of reaching preparation, independently of the use of foveal or peripheral vision and independently of the target position, they found a facilitation in reaction time. This result was explained by the state-depended theory of TMS (Silvanto and Muggleton, 2008), which suggests that TMS may pre-activate this region that is involved in the planning of reaching movements.
In a more recent study, Vesia and collaborators (2010) used TMS to determine effector specificity in human PPC. In particular, Vesia and collaborators (2010) used online 10 Hz repetitive TMS (rTMS) to examine the specific functional role of one posteriormedial site, which likely includes area V6A, and two anterior–lateral parietal sites, angular gyrus and midposterior intraparietal sulcus (mIPS), which likely includes LIP and MIP areas, in the planning of saccades versus reaches. Vesia et al. (2010) conducted three separate experiments using a delayed saccade and reach paradigm with six visual targets (aligned horizontally in steps of 10° from 30° left to 30° right). In the first experiment, subjects were required to perform saccades or reaching movements (randomly interleaved) with the right hand in complete darkness; in the second experiment, reaching movements were performed with the left hand (again in complete darkness); and in the last one, reaching movements were performed with the right hand, but now with visual feedback (Fig. 2-3).
14
Figure 2 - 3 Experimental condition from Vesia et al., 2010.
A: delayed saccade and reaching movement with right hand. B: delayed reach
task with the left hand. C: experiment 3, delayed reach task with visual feedback of the hand.
Task performance was evaluated in terms of movement accuracy and precision. Accuracy was measured as the signed difference between mean endpoint and target positions, whereas precision was measured as the area of 95% confidence ellipses fitted to endpoint distributions. One of the main findings of this study was the reduced accuracy of saccades and the reduced precision of reaches to contralateral targets after stimulation over right mIPS and AG. The TMS-induced effect in these anterior–lateral sites was further reduced by the visual feedback of the hand and, more importantly, it was limb specific, showing a contralateral limb related bias in precision measures. In contrast, stimulation of more posterior site around the parieto-occipital sulcus in either hemisphere did not affect saccade precision or accuracy and did produce a significant shift of mean horizontal reach endpoints toward central fixation (i.e., hypometria), which persisted even when
15
the hand was visible. Based on these data, Vesia et al. (2010; 2012) have proposed that the parieto-occipital region (likely includes area V6A) bilaterally is specialized for encoding reach targets in retinal coordinates, whereas the more anterior– lateral parietal regions are involved in computations for both reach and saccade motor vectors. In conclusion, Vesia and collaborators (2010) have used this innovative method (rTMS), complementary to functional neuroimaging and electrophysiological technique, to establish a causal link between the function of particular cortical regions and behavioural performance, although it is worth to note that some results and interpretation of this study were raised in a critical review by Ciavarro & Ambrosini (2011) and, therefore, further research is needed to clarify these complex issues.
2.5 The present research
Several studies have suggested that the reach-related area V6A is a crucial node of the dorsomedial visual stream, the most direct pathway from V1 to the dorsal premotor cortex, which is thought to be useful for planning and on-line control of hand action (Galletti et al., 2004). Electrophysiological studies have demonstrated that area V6A contains arm movement-related cells (active during spatially-directed reaching movements) (Fattori et al., 2005; Marzocchi et al., 2008) as well as visual cells (Galletti et al., 1996; Galletti et al., 1999b), and cells that change in discharge rate after fixation, also when the eyes remain fixed (Galletti et al., 1996). These latter observations have suggested that the activity of these cells may reflect the monkey levels of attention (Galletti et al., 1996). On the other hand, neuroanatomical studies using tracers have shown as area V6A receive directly information from area V6 (Galletti et al., 2001; Galletti et al., 2004), which is a visual area very sensitive to the direction of motion and therefore could provide useful information to guide actions and to shift attention towards moving objects (Galletti and Fattori, 2003). Thus, these results from monkeys seem to provide evidences to support the hypothesis that area V6A may participate in visuo-spatial processes related to the control of arm movements. Moreover, a
16
possible causal role of area V6A in attention processes seems to be supported also by recent neuropsychological evaluation in OA patients (Striemer et al., 2007; Striemer et al., 2009; McIntosh et al., 2011) (see paragraph 2.3.2). Finally recent TMS study has suggested that in human this cortical region is causally involved in the encoding of reach goals (Vesia et al., 2010). However, at present, despite these encouraging results, direct evidences of an involvement of area V6A in attentional processes associated with the planning and control of arm movements are still unknown. To this aim, we conducted studies in both monkey and human brain investigating whether area V6A is implicated in a variety of attentional processes related to the target detection as well as the planning of peripheral arm movements.
In a first study (Chapter 3) we performed single cells recordings in three macaque monkeys to investigate whether the activity of single cells in V6A is influenced by shifts of covert attention (i.e. in the absence of overt eye or arm movements). To this aim we designed a task that required covert attention shifts from a central fixation point outward to a peripheral location, and then inward shifts of attention back to the fixation point. Behaviorally we found faster response times for outwards shift of attention towards cued targets. More importantly, we found that the covert shift of attention influences the activity of V6A neurons. In particular, the spatially-directed of modulation observed during outwards shifts of attention suggested that this modulation may be helpful in guiding the hand during the reach-to-grasp movements, particularly when the movements are directed towards non-foveated objects. In addition, the modulations observed during the inward shift of attention from the periphery have suggested that area V6A may be involved in the processes of disengagement of attention from current focus.
In human we have conducted two studies, one behavioral (Chapter 4) and one using Transcranial Magnetic Stimulation (Chapter 5) to investigate the performance of healthy subjects while performing naturalistic reaching movements towards memorized- and cued targets, respectively. To this aim, we have developed a specific apparatus to investigate the kind of errors (spatial
17
accuracy) while subjects performed fast-reaching movements, without visual feedback of the hand, towards peripheral targets located at different eccentricities. In this way we have investigated (1) the frames of reference involved in the visuomotor transformation during reaching movements towards memorized target (Chapter 4), and (2) the possible causal role of the putative homologue of area V6A (pV6A) in the planning of reaching movements in which the location of targets is validly or invalidly predicted by spatial cues (Chapter 5). In particular, in this TMS study, we have tested the involvement of pV6A in the reorienting of attention towards unattended target (i.e. the target changes in location with a probability 25%) by introducing a manipulation to increase the magnitude of the validity of the cues (the cue correctly predicted target location with 75%). To this aim, in addition to the kinematic parameter of reaching movements we have recorded also the response time to target detection. The results have shown as on-line TMS on the pV6A selectively interfere with the encoding of goal-directed movements directed towards unattended target, affecting both the response to targets detection and the end-point of reaching movements. On the basis of these results, we have demonstrated that area V6A plays a crucial role in the disengaging/reorienting of attention, an indispensable process to make a rapid and adaptive motor response such as reaching, grasping or pushing away when a behaviorally relevant object unexpectedly appears at an unattended location.
19
3.
C
OVERTS
HIFT OFA
TTENTIONM
ODULATES THEO
NGOINGN
EURALA
CTIVITY IN AR
EACHINGA
REA OF THEM
ACAQUED
ORSOMEDIALV
ISUALS
TREAM 13.1 Abstract
Attention is used to enhance neural processing of selected parts of a visual scene. It increases neural responses to stimuli near target locations and is usually coupled to eye movements. Covert attention shifts, however, decouple the attentional focus from gaze, allowing to direct the attention to a peripheral location without moving the eyes. We tested whether covert attention shifts modulate ongoing neuronal activity in cortical area V6A, an area that provides a bridge between visual signals and arm-motor control.
We performed single cell recordings from 3 Macaca Fascicularis trained to fixate straight-head, while shifting attention outward to a peripheral cue and inward again to the fixation point. We found that neurons in V6A are influenced by spatial attention. The attentional modulation occurs without gaze shifts and cannot be explained by visual stimulations. Visual, motor, and attentional responses can occur in combination in single neurons.
This modulation in an area primarily involved in visuo-motor transformation for reaching may form a neural basis for coupling attention to the preparation of reaching movements. Our results show that cortical processes of attention are related not only to eye-movements, as many studies have shown, but also to arm movements, a finding that has been suggested by some previous behavioral findings. Therefore, the widely-held view that spatial attention is tightly intertwined with - and perhaps directly derived from - motor preparatory processes should be extended to a broader spectrum of motor processes than just eye movements.
1
A version of this chapter was originally published in PLoS ONE journal: Galletti C,
20
3.2 Introduction
When we want to recognize an object in the field of view, or want to grasp it, we typically direct our gaze towards the object. The shift of gaze is the consequence, and the overt evidence as well, of the shift of our attention towards the object of interest. Although under normal circumstances the direction of attention and the direction of gaze are aligned, we are able to disengage attention from the point of fixation. This ability, known as covert spatial attention, allows us to select and acquire peripheral visual information without shifting the gaze (Posner, 1980).
Attention enhances both behavioral and neuronal performances (Spitzer et al., 1988). Reaction to attended targets is faster than to unattended targets (Posner et al., 1980), and responses of neurons to covertly attended stimuli enhance above those of unattended stimuli (Fischer and Boch, 1985; Desimone and Duncan, 1995; Colby et al., 1996; Connor et al., 1997; Kodaka et al., 1997). Thus, attention modulates the processing of information in visual cortical maps, and selects parts of the scene to receive increased processing resources.
The selection of the part of the scene to receive attention, i.e. the control of the focus of attention, is driven by the saliency of the stimuli and by the requirements of the task that is currently performed. If motor actions are to be performed on the selected targets, the focus of attention is closely related to these actions. The initiation of a saccade, for instance, is preceded by a mandatory shift of attention towards the saccade goal (Hoffman and Subramaniam, 1995; Kowler et al., 1995; Deubel and Schneider, 1996; Awh et al., 2006). The deployment of attention are linked to the mechanisms of selecting a saccade target and preparing the saccade even for covert attention shifts (Moore et al., 2003; Cavanaugh and Wurtz, 2004; Ignashchenkova et al., 2004; Hamker, 2005; Thompson et al., 2005; Liu et al., 2010).
The link between attention and goal-directed motor action is not confined to eye movements. Also the preparation of reaching movements is paralleled by a shift of attention to the goal of the reach (Castiello, 1996; Deubel et al., 1998). Therefore, one might expect that, similar to oculomotor areas that provide signals
21
for overt and covert shifts of attention, also cortical areas that are involved in arm movements may contribute to shifts of attention, or may use spatial attentional signals to prepare arm movement or direct the hand towards the object to be grasped.
The medial posterior-parietal area V6A acts as a bridge between visual processing and arm motor coding (Galletti et al., 2003). Our aim in this work was to find out whether the activity of single cells in V6A is influenced by shifts of covert attention. Since, usually, the direction of gaze and the direction of attention are aligned, and since area V6A contains a high percentage of gaze-dependent neurons (Galletti et al., 1995), we had to disengage attention from the point of fixation (covert attention) in order to demonstrate that the direction of attention, and not the direction of gaze, modulates V6A neurons. In a task specifically designed for this, we found that the neural modulation was still present when the covert attention was shifted without any concurrent shift of the direction of gaze. We suggest that this attentional modulation is helpful in guiding the hand during reach-to-grasp movements, particularly when the movements are directed towards non-foveated objects.
3.3 Materials and Methods
3.3.1 Experimental procedures
Experiments were carried out in accordance with National laws on care and use of laboratory animals and with the European Communities Council Directive of 24th November 1986 (86/609/EEC), and were approved by the Bioethical Committee of the University of Bologna and authorized by Ministero della Salute (Permit N° DM 47/2008-B, 6/4/2008, signed by the Direttore of the Dipartimento Sanità Pubblica Veterinaria). In accordance with the European Legislation and Guidelines and with the recommendations of the Wheatherall report, “The Use of non-human primates in research”, many measures were taken to ameliorate animal welfare: monkey training adopted positive reinforcement techniques. No deprivation, punishment, or suffering was inflicted. All procedures used have
22
been approved and controlled by the Central Veterinary Service of the University of Bologna. Monkey food and water intake, as well as daily weight, were controlled by researchers and veterinarians, in order to monitor the wellbeing of the monkeys. Veterinarians were ready to detect, if present, clinical signs of pain or distress and to suggest the appropriate measures to increase animal welfare.
Three trained Macaca fascicularis of 6, 5 and 4 kg (Monkey L, Monkey C and Monkey X) sat in a primate chair and performed an attentional task with their head restrained. We performed single microelectrode penetrations using home-made glass-coated metal microelectrodes with a tip impedance of 0.8-2 MOhms at 1 KHz, and multiple electrode penetrations using a 5 channel multielectrode recording minimatrix (Thomas Recording, GMbH, Giessen, Germany). The electrode signals were amplified (at a gain of 10,000) and filtered (bandpass between 0.5 and 5 kHz). Action potentials in each channel were isolated with a dual time-amplitude window discriminator (DDIS-1, Bak electronics, Mount Airy, MD, USA) or with a waveform discriminator (Multi Spike Detector, Alpha Omega Engineering, Nazareth, Israel). Spikes were sampled at 100 KHz and eye position was simultaneously recorded at 500 Hz. Eye position was recorded using an infrared oculometer (Dr. Bouis, Karlsruhe, Germany) and was controlled by an electronic window (5 x 5 degrees) centered on the fixation target. Behavioral events were recorded with a resolution of 1 ms. We performed extracellular recordings on all the 3 animals; on two of them we also performed behavioral recordings.
Surgery to implant the recording apparatus was performed in asepsis and under general anesthesia (sodium thiopenthal, 8 mg/kg/h, i.v.). Adequate measures were taken to minimize the animal’s pain or discomfort. Specifically, analgesics were used postoperatively (ketorolac trometazyn, 1mg/kg i.m. immediately after surgery, and 1.6 mg/kg i.m. on the following days). Extracellular recording techniques and procedures to reconstruct microelectrode penetrations were similar to those described in other reports (Galletti et al., 1995b).
23
3.3.2 The attentional task
Data were collected while monkeys were performing a task specifically designed to study the effect of covert spatial displacements of the spotlight of attention on neural responses. The monkeys sat in front of a fronto-parallel panel which was located 14 cm from the animal’s eyes. The panel contained 3 green/red light emitting diode (LED; 4 mm in diameter; 1.6° of visual angle) that served as fixation point and target to be detected. The fixation point was the green/red LED located in the straight-ahead position. Two circular rings (12 mm in diameter; 4.8° of visual angle), illuminated by a yellow LED, served as a cue that indicated the spatial position of the subsequent target to be detected. The cue and target LEDs were located 15° peripherally on opposite sides from the fixation point.
The time sequence of the task is shown in Figure 3-1 a. A trial began when the monkey decided to press the home-button near its chest. After pressing the button, the animal waited for instructions in complete darkness. It was free to look around and was not required to perform any action. After 1000 ms, the fixation LED lit up green. The monkey was required to look at the fixation target and to maintain the button press while waiting for an instructional cue.
After 1700-2200 ms, another LED (the CUE) lit up for 30-150 ms in one out of the two peripheral positions located 15° apart from the fixation point. After 1000-1500 ms a red flash (TARGET) of 5 ms occurred in the cued position. The monkey had to release the home-button as soon as it detected the target. The maximum time allowed to release the button was 1000 ms. If the monkey did not release the button during this period the trial was marked as error trial. After 1000-1500 ms, the fixation point changed in color from green to red. The monkey had to press the home-button again (maximum time to press was 1000 ms) to drink the reward. Home-button pressing ended the trial, issued monkey reward, and started the next trial.
24
Figure 3 - 1 Attentional Task and effects in V6A
a) Schematic representation of the task. Top: Sequence of events in a single trial.
After button pressing, the monkey maintained fixation on the central fixation point (white dot, FP) all throughout the trial while covertly shifting attention (dashed circle) towards the cued location (grey dot). After target (black dot) detection, the animal released the button, continuing to gaze the fixation point until it changed in color (from green to red). Color-change detection was reported by the animal by button pressing. Bottom: typical example of neural activity and eye traces during a single trial. Short vertical ticks are spikes. Long vertical ticks among spikes indicate the occurrence of behavioral events (markers). Below the neural trace, time epochs during a typical trial are indicated. ATNout: outward attention epoch, ATNin: inward attention epoch. b) Performance of 1 monkeys expressed as
25
reaction time to detect the target at different inter-stimulus-intervals (ISIs). Results from valid (continuous) and invalid (dashed) trials are shown. Significant difference in reaction times between valid and invalid trials at ISI 150 shows that attention is directed towards the peripheral cue location at this time. c) Peri-stimulus time histograms of an example neuron recorded with different ISIs. Trials are aligned to cue onset. The neuron shows two discharges (after cue onset and button release, respectively) that separate (arrow) clearly at longer ISIs.
The correctness of the animal’s performance was evaluated by a software supervisor system (Fattori et al., 2005) which checked the status of microswitch (monopolar microswitches, RS components, UK) mounted under the home-button. Button presses/releases were checked with 1 ms resolution.
Displacements of the spotlight of attention towards the two peripheral positions were typically tested as a randomized sequence in order to collect trials in one position intermingled with the other. Up to ten trials for each position were collected (20 trials in total). The panel could be rotated in 4 different positions (horizontal, vertical, and 2 oblique positions in between the two), allowing to test up to 8 spatial displacements of the spotlight of attention.
The task was performed in darkness. Eye fixation was always maintained in the straight ahead position within an electronic window of 5° amplitude. Fixation had to remain within this window throughout each trial until the fixation point switched off, otherwise the trial was aborted and a new one began without any reward. Off line inspection of eye records allowed to check for actual performance of fixation.
3.3.3 Neuronal data analysis
We divided the trial into functional epochs, defined as follows (see bottom part of Figure 3-1a):
• FIX: steady fixation of the LED from its appearance to the cue onset; it contains the baseline activity of the neuron, used to compare the cell activity during the other epochs.
26
• VIS: from 40 to 150 ms after the cue onset; it could contain the passive visual response evoked by the cue appearance.
• outward attention epoch (ATNout): from 200 to 500 ms after the cue onset; it could contain the response due to the covert, peripheral displacement of the spotlight of attention.
• inward attention epoch (ATNin): from 400 ms after button release to the change in color of the fixation point; during this epoch the animal concentrates attention on the fixation point, as it has to detect the fixation point’s change in color.
For behavioral analysis, the reaction time between target onset and button release was determined.
Only units which were tested in at least 7 trials for at least two target positions were included in the analysis. This is a conservative choice connected to the implicit high variability of biological responses (Kutz et al., 2003).
For each neuron, the mean firing rate was calculated for each trial in outward attention epoch and inward attention epoch, and statistically compared with the mean firing rate in epoch FIX (two-tailed Student's t-test; significance level, p < 0.02 with Bonferroni correction for multiple comparisons). Units with a significant discharge during at least one of the two attentional epochs were considered task related and were further analyzed. Excited cells during ATNout were defined as those cells whose discharge during ATNout was stronger than the one during FIX. Inhibited cells during ATNin were defined as those cells whose discharge during ATNin was stronger than the one during FIX. The same was done for the epoch ATNin.
The spatial tuning of activity in the task-related cells was analyzed statistically by comparing the mean firing rate in each target position (one-way ANOVA, F-test; significance level, p < 0.05) for each of the functional epochs described above. A neuron was defined as 'spatially tuned' when it showed a statistically significant difference in mean firing rate in the same epoch in different spatial locations. Direction selectivity of neurons modulated during outward attention
27
epoch and/or during inward attention epoch was quantified by a preference index (PI) for each functional epoch as follows:
PI = abs(D - OD)/(D + OD)
where D = maximal discharge for cells excited with respect to FIX or minimal discharge for cells inhibited with respect to FIX, and OD = discharge for the opposite position.
PI ranged from 0 to 1.
Population activity of tested neurons was calculated as averaged spike density functions (SDFs). A SDF with a Gaussian kernel of half-width 40 ms was calculated for each neuron included in the analysis, averaged across all the trials for each tested condition, and normalized to the peak discharge of the neuron in the behavioral epochs of interest. The normalized SDFs were then averaged to derive population responses. We statistically compared the population SDFs with a permutation test with 10,000 iterations comparing the sum of squared errors of the actual and randomly permuted data.
3.3.4 Behavioral data
We performed psychophysical measurements in separate sessions on 1 animal. In these sessions for monkey L we collected reaction times of the monkeys in valid trials, in which the target appeared in the cued position, and in invalid trials, in which the target appeared in the uncued position. These reaction times were recorded separately from the physiological data because the physiological recordings contained only valid trials. We recorded behavior during batteries of trials containing 20% of invalid trials randomly interleaved with valid trials. We tested two opposite target positions, to the right and to the left of the fixation point.
Various inter-stimulus-intervals (ISIs) were tested:, we used ISIs = 150 ms, 450 ms, 1000 ms (similar to the ISIs tested in Bowman et al., (1993). ; A repeated measures ANOVA (p<0.05) with factors: ISI (3 levels) and validity (2 levels) was used to assess the effect of validity, of ISI, and of the interaction
28
between the two, on reaction time to target detection. To assess the validity effect for each ISI, post hoc comparisons using the Newman Keuls correction were used.
3.4 Results
We performed extracellular recordings on 182 single cells of area V6A in 3
Macaca fascicularis. Cells were ascribed to V6A following the functional criteria
described in Galletti et al. (1999a), and on cytoarchitectonic criteria according to Luppino et al. (Luppino et al., 2005).
Animals were trained to fixate a light-emitting diode (LED) in the straight-ahead position in darkness while pressing a button located outside their field of view. While fixating, the monkeys had to detect a target (5 ms red flash) in one out of several peripheral positions and respond to it by releasing the button without moving the eyes (Fig. 3-1a). The target position was cued by a yellow flash (30-150 ms) preceding the target onset by 1-1.5 s. The cue signal prompted the monkeys to covertly displace attention towards the periphery. After target detection, the monkeys shifted attention back towards the straight-ahead position to detect the change in color of the fixation LED. This change in color had to be reported by pressing the button again. The monkeys were trained to maintain gaze in the straight-ahead position all throughout the trial. Their fixation was checked using an electronic window and off line inspection of recorded eye traces.
We quantified each cell’s discharge during three time epochs (see Fig. 3-1a): the starting fixation epoch before cue onset (baseline activity, FIX), the epoch from 200 to 500 ms after cue onset (covert attention shifted towards the cue location, ‘outward attention’), and the epoch from 400 ms after button release to the change in color of the fixation LED, when attention is again directed towards the central fixation point (‘inward attention’). We also analyzed passive visual response to the cue appearance in an epoch from 40 to 150 ms after the cue onset (VIS; see supporting information).
3.4.1 Behavioral bases of covert attention shift
To check whether our experimental conditions induced covert attention shifts, we measured reaction times (RTs) between target onset and button release in one
29
monkeys. These measurements were collected in separate behavioral testing sessions before the onset of single unit recording. These sessions contained valid trials as described above, and invalid trials in which the cue was misleading because the target appeared on the opposite side. It is well known that effects of covert attention shifts are reflected in differences in the reaction times between valid and invalid trials both in human (Posner, 1980) and monkey (Bowman et al., 1993). In valid trials, especially with brief inter-stimulus-interval (ISI), the reaction time are expected to be shorter than during invalid trials because the location where the target appears benefits from attentional enhancement evoked by cue appearance.
As reported in Figure 3-1b, reaction times for target detection in valid and invalid trials were recorded at ISIs of 150, 450 and 1000 ms (Monkey L). Mean reaction times were 400.01 ms (ISI 150), 360.01 ms (ISI 450) and 335.90 ms (ISI 1000) for valid trials, and 412.89 ms (ISI 150), 357.35 ms (ISI 450) and 336.16 ms (ISI 1000) for invalid trials These data were entered in 3x2 repeated measures ANOVA with ISI (150, 450 and 1000) and validity (Valid vs invalid trials) as within factors. The ANOVA has revealed a significant interaction ISI x validity (F(2,36)=5.47, p=0.008) with a difference in reaction time between valid and invalid trials occurred for the ISI of 150 ms (p=0.0009, Newman-Keuls post hoc test). The shorter RT for valid trials is an index of attention allocated to the cue, and confirms that the experimental paradigm we used elicited covert attention shifts in our monkey subjects. For longer ISIs, the validity effect was no longer significant, although reaction time for both trial types decreased with increasing ISI (repeated measures ANOVA, main effect of factor ISI, F(2,36)=72.87, p=0.000001) suggesting an increase of alertness when the ISI is longer.
3.4.2 Single-unit recordings
Since significant RT difference between valid and invalid trials was observed for ISI of 150 ms but not for ISIs of 450 ms and higher, and because we wanted to exclude from the analysis the effect of putative visual responses to cue onset (see
30
supporting information), we restricted the analysis of the effect of outward attention shifts to a time epoch from 200 and 500 ms after cue appearance. However, we performed also the analysis with a time window from 150 ms to 450 ms and the results were the same. Below, we report the results of the former analysis as a more conservative approach.
Since key-press and key-release actions elicited neural responses in V6A (Galletti et al., 1997; Marzocchi et al., 2008), we wanted to separate in time the responses related to inward shifts of attention from the responses related to the button press. To this aim, in preliminary experiments we varied ISI during cell recordings. Figure 3-1c shows an example of a cell recorded with different ISIs (150, 450 and 1000 ms, tested in randomly interleaved trials) and a cue duration of 30 ms. When the ISI was 150 ms (Fig. 3-1c left), the cell had a strong and long discharge starting immediately after the cue onset. An increase of the ISI to 450 ms (Fig 3-1c, center) caused the tendency of the discharge to separate in 2 components (see arrow in Fig 3-1c, center). These two components became further separated and distinguishable at an ISI of 1000 ms (see arrow in Fig 3-1c, right), the first component related to the cue, the second to the button release. Since these components were clearly separable only at an ISI of 1000 ms, when recording from neurons we used ISIs of 1000 and 1500 ms, to be able to correlate each discharge component with the different events occurring during the trial.
Of 182 recorded cells, 83 (46%) showed neural discharges during the outward and/or inward attention epochs that were significantly different from the baseline (epoch FIX) as assessed by Student’s t-test (with Bonferroni correction, p<0.02). From now on, we will refer to these cells as ‘task-related cells’.
3.4.3 Neural responses during outward attention
Fifty-one task-related cells were modulated during outward attention epoch (Student’ t-test, p<0.05). In particular, 24 cells (47%) were inhibited (i. e. the discharge during outward attention epoch was weaker than during FIX), and 27
31
cells (53%) were excited (i. e. the discharge during outward attention epoch was stronger than during FIX).
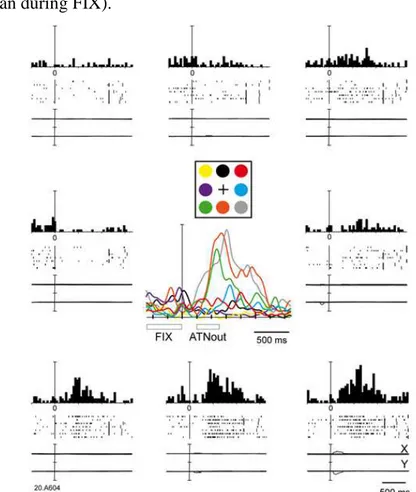
Figure 3 - 2 Example of spatially-tuned modulations of neural activity during outward attention epoch.
The neuron shows a strong discharge during outward attention epoch preferring covert shifts of attention towards the bottom part of the space. Each inset contains the peri-event time histogram, raster plots and eye position signals, and is positioned in the same relative position as the cue on the panel. In the central part of the figure, the spike density functions (SDFs) of the activity for each of the 8 cue positions are superimposed and aligned on the cue onset. The mean duration of epochs FIX and outward attention is indicated below the SDFs. Neural activity and eye traces are aligned on the cue onset. Scalebar in peri-event time histograms, 70 spikes⁄s. Binwidth, 40 ms. Eyetraces: scalebar, 60°. Other details as in Figure 3-1.
32
Figure 3-2 shows a cell with a typical outward attention response for cues presented in the lower space. The spatially-tuned outward attention activity had a very long latency (on average 283 ms). The cell discharged strongly after cue onset and continued to discharge well after cue offset. In some trials, the response lasted until target onset, that is 1 s or more later than cue onset. This discharge was very different from a typical V6A visual response (Galletti et al., 1999c). To compare the effect of what we call “outward attention” to a purely visual response in our neuronal sample we assessed the influence of the visual stimulation by the cue appearance (epoch VIS) on the firing rates. Consistent with earlier observations that a stationary light stimulus like the cue is not the most effective stimulus for V6A visual cells (Galletti et al., 1999c), only 40% of the cells (72/182) were modulated during VIS with respect to the baseline epoch FIX (Student’ t-test, p,0.05).
One example of a cell with a typical visual response to cue onset is shown in Figure 3-3. The response started about 80 ms after the cue onset. The cell showed a brisk response whose duration was similar to the duration of the stimulus (150 ms).
Figure 3 - 3 Typical visual response in V6A.
Neural activity and eye traces are aligned with cue onset. Peri-event time histograms: binwidth, 40 ms; scalebars, 38 spikes/s. Eyetraces: scalebar, 60u. Other details as in figures 3-1 and 3-2.The response started about 80 ms after the cue onset. The cell showed a brisk response whose duration was similar to the duration of the stimulus (150 ms).