New obesity classification criteria as a tool for bariatric
surgery indication
Antonino De Lorenzo, Laura Soldati, Francesca Sarlo, Menotti Calvani, Nicola Di Lorenzo, Laura Di Renzo
Antonino De Lorenzo, Menotti Calvani, Laura Di Renzo,Division of Clinical Nutrition and Nutrigenomic, Department of Biomedicine and Prevention, University of Tor Vergata, 00133 Rome, Italy
Antonino De Lorenzo, Department of Internal Medicine, UOSD Service of Clinical Nutrition, parenteral therapy and anorexia nervosa, Policlinico Tor Vergata, 00133 Rome, Italy
Laura Soldati, Department of Health Sciences, University of Milan, 20122 Milan, Italy
Francesca Sarlo, Department of Agriculture University of Naples “Federico II”, 80055 Portici (NA), Italy
Nicola Di Lorenzo, Department of Surgical Sciences, University of Tor Vergata, Policlinico Tor Vergata, 00133 Rome, Italy Author contributions: De Lorenzo A conceived, designed the research, drafted the manuscript, and had primary responsibility for the final content; Soldati L, Sarlo F, Calvani M, Di Lorenzo N and Di Renzo L collected the data; Sarlo F and Di Renzo L wrote the paper; all the author have contributed to the interpretation of the revision of the manuscript.
Conflict-of-interest statement: Antonino De Lorenzo, Laura Soldati, Francesca Sarlo, Menotti Calvani, Nicola Di Lorenzo and Laura Di Renzo have no conflict of interest to disclose. Open-Access: This article is an open-access article which was selected by an in-house editor and fully peer-reviewed by external reviewers. It is distributed in accordance with the Creative Commons Attribution Non Commercial (CC BY-NC 4.0) license, which permits others to distribute, remix, adapt, build upon this work non-commercially, and license their derivative works on different terms, provided the original work is properly cited and the use is non-commercial. See: http://creativecommons.org/ licenses/by-nc/4.0/
Correspondence to: Antonino De Lorenzo, MD, Division of Clinical Nutrition and Nutrigenomic, Department of Biomedicine and Prevention, University of Tor Vergata, Via Montpellier 1, 00133 Rome, Italy. [email protected]
Telephone: +39-6-72596856 Fax: +39-6-72596853
TOPIC HIGHLIGHT
DOI: 10.3748/wjg.v22.i2.681 © 2016 Baishideng Publishing Group Inc. All rights reserved.2016 Laparoscopic Surgery: Global view
Received: May 28, 2015
Peer-review started: June 1, 2015 First decision: July 14, 2015 Revised: October 5, 2015 Accepted: November 30, 2015 Article in press: December 1, 2015 Published online: January 14, 2016
Abstract
Obesity plays relevant pathophysiological role in the development of health problems, arising as result of complex interaction of genetic, nutritional, and metabolic factors. Due to the role of adipose tissue in lipid and glucose metabolism, and low grade inflammation, it is necessary to classify obesity on the basis of body fat composition and distribution, rather than the simply increase of body weight, and the Body Mass Index. The new term of adiposopathy (‘‘sick fat’’) clearly defines the pathogenic role of adipose tissue. Four phenotypes of obese individuals have been described: (1) normal weight obese (NWO); (2) metabolically obese normal weight; (3) metabolically healthy obese; and (4) metabolically unhealthy obese or “at risk” obese. Moreover, sarcopenic obesity has been related to all the phenotypes. The category of normal weight lean, represented by metabolically healthy normal weight has been classified to distinguish from NWO. It is crucial to recommend a bariatric surgery taking into account adiposopathy and sick fat that occurs with the expansion of fat mass, changing the inflammatory and metabolic profile of the patient. Body fat percentage and genetic polymorphism have to be evaluated to personalize the best bariatric surgery intervention.
Key words: Obesity; Adiposopathy; Normal weight
lean; Normal weight obese; Metabolically obese normal weight; Metabolically healthy obese; Metabolically healthy normal weight; Metabolically unhealthy obese;
major regulators of adipose tissue metabolism[10].
Therefore, the greatest limitation of any measure that relegates the diagnosis of obesity to the mere quantity of weight and circumference gain, without taking into account the body composition, in terms of body fat increase and body lean decrease, is the failure to consider the impact of adiposity on physiological and metabolic processes that result in increased morbidity and mortality[11].
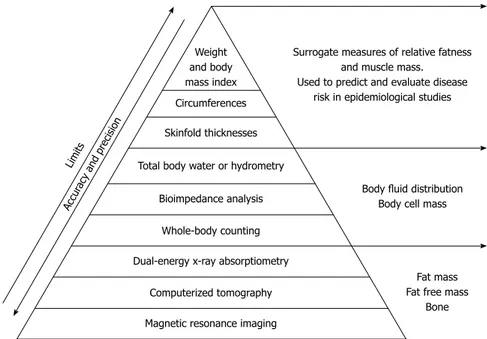
Due to the endocrine and inflammatory role of the adipose tissue it is necessary to classify obesity condition on the basis of body fat composition and distribution, rather than simply on the increase of body weight (Figure 1). Therefore, the body mass index (BMI), a ratio between weight to the squared height (kg/m2) of a subject, used to easily approximate body
fat percentage and stratify people into categories, leads to a large error and misclassification.
According to BMI, general population is classified in five categories: underweight (BMI < 18.5 kg/m2),
normal weight (BMI 18.5-24.9 kg/m2), class
Ⅰ obesity - overweight (BMI 25.0-29.9 kg/m2), class
Ⅱ obesity - obesity (BMI 30.0-39.9 kg/m2), class
Ⅲ obesity - extreme obesity (BMI > 40 kg/m2).
The currently used BMI cut-off values for pre-obesity and obesity are based on morbidity and mortality studies in relation to Caucasian population[8-10].
However, there is a controversy in the literature, termed the “obesity paradox”, which associates better survival and fewer cardiovascular events in patients with mildly elevated BMI afflicted with chronic diseases[11].
In fact, the outdated BMI formula developed nearly 200 years ago by Quetelet, is not a measurement of adiposity, but merely an imprecise mathematical estimate[12-14].
Its popularity stems in part from its convenience, safety, and minimal cost, and its use is widespread, despite the fact, BMI ignores several important factors affecting adiposity. Moreover, the error in the diagnosis of obesity generates important effects on health care costs.
BMI formula is only an arithmetic approximation for the relative quantity of adiposity and is used to predict and evaluate disease risk in epidemiological studies, thereby acting only as a population-level indicator of obesity.
Because BMI does not measure PBF directly and poorly distinguishes between total body fat and total body lean, or bone mass, the use of BMI as an index of PBF for a person may be inaccurate and not useful as a cardiovascular risk factor[15-17].
However, according to a WHO expert committee, “there is no agreement about cut-off points for the PBF that constitutes obesity”[10].
Current research suggests that the obesity cut-off points of PBF are in the 23%-25% range in men and 30%-35% range in women[18].
The clinical use of WHO BMI cut-off values when Laparoscopic gastric banding; Fat mass
© The Author(s) 2016. Published by Baishideng Publishing Group Inc. All rights reserved.
Core tip: Obesity is a global public health problem
due to its association with several diseases and reduced lifespan, as result of complex interaction of genetic, nutritional, and metabolic factors. The term of adiposopathy clearly defines the pathogenic role of adipose tissue. Four phenotypes of obesity have been described, based on body fat composition and distribution: (1) normal weight obese; (2) metabolically obese normal weight; (3) metabolically healthy obese; and (4) metabolically unhealthy obese. Sarcopenic obesity has been characterized, related to all the described phenotypes. Body fat percentage and genetic polymorphism have to be evaluated to personalize the best bariatric surgery intervention.
De Lorenzo A, Soldati L, Sarlo F, Calvani M, Di Lorenzo N, Di Renzo L. New obesity classification criteria as a tool for bariatric surgery indication. World J Gastroenterol 2016; 22(2): 681-703 Available from: URL: http://www.wjgnet.com/1007-9327/full/ v22/i2/681.htm DOI: http://dx.doi.org/10.3748/wjg.v22.i2.681
BODY COMPOSITION STUDY AS A NEW
WAY TO CLASSIFY SUBJECT
The American Medical Association’s Council on Science and Public Health Report 4, has identified the following common criteria to define a disease as: (1) an impair ment of the normal functioning of some aspect of the body; (2) characteristic signs or symptoms; and (3) harm or morbidity[1].
The World Health Organization (WHO) defines obesity as “a condition in which percentage body fat (PBF) is increased to an extent in which health and well-being are impaired, and, due to the alarming pre-valence increase, declared it as a “global epidemic”[2].
The high prevalence of obesity is a global public health problem due to its association with several diseases[3,4], and reduced lifespan[5]. It arise as a result
of complex interaction of genetic, life style, dietary habitus, energy expenditure, nutritional and metabolic factors, as the adipocyte metabolism[6,7].
The shared definition that the adipose tissue and skeletal muscle are an energy storage has been replaced by the notion that these tissues have a role in lipid and glucose metabolism due to the large number of bioactive proteins, termed adipokines and myokines produced[8], that are related to some cardiovascular
risk factors influences of obesity[9].
Moreover, obesity and glucose metabolism are intimately related to low grade systemic inflammation, involving a number of pro-inflammatory cytokines produced by many cell types that also appear to be
applied to the Italian population cause misclassi-fications, and a considerable number of subjects, both males and females, will not be classified as obese based on their BMI alone[19].
The disagreement became impressive in the classification of obese women: in the class of age 30-40 the proportion of obese women according to BMI is 30% reaching about 82% if the classification is based on PBF. Notably, among women that were classified as normal according to their observed PBF, the median BMI was 20.1, ranging from 15.6 to 26.7.
For the Italian population, the percentage of obese women according to PBF classification increases as age increases, ranging from 63.17% in women younger than 20 years to 87.39% in women older than 60[20].
Moreover, values corresponding to normal weight, overweight, and various subgroups of obesity are confounded by body frame and muscularity, fluid retention, sarcopenia in aging or disease, spinal deformities, physical disabilities, and transcultural differences. A person with the same BMI, may have a large proportion of total body fat mass and be obese, or may have a considerable muscle mass and be a weight-lifter. Moreover, PBF at a given BMI will tend to vary across gender, age, and race-ethnicity[21-23].
Moreover, it is recommended to measure waist circumference (WC) in adults with BMIs below 35 kg/m2, to further assess disease risk[24].
Anyway, obese individuals differ not only in the amount of excess fat mass, but also in the regional distribution of the fat within the body. The fat distri-bution affects the risk associated with obesity. It is useful therefore, to be able to distinguish between those at increased risk as a result of abnormal fat distribution or android obesity from those with the less serious gynoid fat distribution, in which fat is more
evenly and peripherally distributed around the body[2].
On the hand even if there are some obese people are prone to develop alterations in fat distribution and metabolic disease, others are protected from the adverse metabolic effects of weight gain and increased adiposity[25].
Some studies suggested that the main issue to explain the metabolic abnormalities in normal weight individuals was fat distribution.
Certain attributes of visceral fat, the adipose tissue surrounding abdominal organs, make its accu-mulation more worrisome than the accuaccu-mulation of subcutaneous fat, which resides below the skin[26-28].
Other markers for excess body fat evaluation have to be used in clinical practice and investigation (e.g., WC, skin fold thickness, hip ratio, waist-to-height ratio).
WC or waist-to-hip ratio has been used as a proxy measure for body fat distribution when investigating the health risk increased with an increasing ratio. Some studies have suggested that WC, either singly or in combination with BMI, may have a stronger relation to some health outcomes than BMI alone[29].
Moreover, progressively higher values of BMI and WC are associated with a progressive elevation in metabolic markers of cardiovascular disease (CVD) risk such as total serum cholesterol, triglycerides, blood glucose and a progressive reduction of HDL-cholesterol, with a clear-cut increase in the incidence of all-cause and cardiovascular deaths as well as of cardiovascular morbid and fatal events[30]. In post-menopausal women,
it was reported that both BMI and WC were associated with mortality, but WC may be more important than BMI[31], as it reflects abdominal fat levels. In the
Nurses’ Health Study, waist-to-hip ratio and WC were also independently strongly associated with increased Surrogate measures of relative fatness
and muscle mass. Used to predict and evaluate disease
risk in epidemiological studies
Body fluid distribution Body cell mass
Fat mass Fat free mass
Bone Weight and body mass index Circumferences Skinfold thicknesses Total body water or hydrometry
Bioimpedance analysis Whole-body counting Dual-energy x-ray absorptiometry
Computerized tomography Magnetic resonance imaging
Accur acy and pr
ecision Limits
as “fat mass disease”[38]. Different adverse physical
and metabolic health consequences could occur as directed or undirected consequences of adipose tissue mass spread and dysfunction[39], such as metabolic
syndrome (MS), respiratory disorders, joint pain, diabetic retinopathy, low self-esteem, cardiovascular, neurologic, pulmonary, musculoskeletal, dermatologic, gastrointestinal, genitourinary, renal and psychological diseases and cancer[3,4,40-42]. Moreover, also a slight
rise of body weight may represent a risk factor for the onset of metabolic abnormalities that lead to development metabolic disease[43].
According to Patel and Abate[44], the subcutaneous
adipose tissue (SAT) can be a major contributor of systemic free fatty acid flux, more than visceral or retroperitoneal fat, able to determine the insulin resi-stance development.
Apovian et al[45] explained the insulin resistance and
vascular endothelial dysfunction in obese subjects with the phenomenon of adipose tissue macrophage (ATM) infiltration, in the form of crown-like structures, asso-ciated with and elevated plasma high sensitivity C-reactive protein (hs-CRP) levels.
Because of the complexity of the obesity condition, it is clear that we need a new and more adequate model, possibly based on findings at the physiopa-thological level and a new method to correctly identify all the affected subjects for an efficient and successful treatment.
If Bays et al[39] affirmed that to deny the
adipo-sopathy, also in mildly overweight patients, represents denying the opportunity of cure to this individuals, and perhaps to entire populations,we added the importance to evaluate PBF in normal weight individuals to predict in advance the risk of adiposopathy, and to verify the real state of health.
ECTOPIC FAT DISTRIBUTION AND
ORGAN FUNCTION
The association between visceral fat and metabolic and cardiovascular disorders is also related to accumulation of ectopic fat that accompanies visceral adiposity[46].
Moreover, the hepatic fat observed in patients with insulin resistance could be independent from the visceral fat content[47].
Healthy expansion of subcutaneous fat in response to obesity is accompanied by enlargement of fat mass through enhanced recruitment of preadipocytes along with adequate vascularization of expanding adipose tissue and minimal fibrosis and minimal infiltration of inflammatory ATMs. In contrast, pathologic expansion is associated with rapid growth of fat tissue through the enlargement of existing adipocytes and inadequate vascularization leading to fibrosis and inflammatory ATM infiltration that secrete high levels of inflammatory cytokines[48].
This pathologic expansion is associated with adipose risk of coronary heart disease among women with
a BMI of < 25 kg/m2[32]. WC reflects abdominal or
intra-abdominal fat, and hip circumference reflects different aspects of body composition in the gluteo-femoral region, i.e., muscle mass, bone, and fat mass. The importance of waist and hip measurements, and the waist to hip ratio, lies in the apparently different physical and metabolic characteristics of these two regions, and therefore the diverse clinical outcomes in subjects with a gynoid (low waist to hip ratio, lower body obesity) or android (high waist to hip ratio, upper body obesity) body conformation. This may be due to the tendency for abdominal adipocytes to enlarge (hypertrophy) whereas subcutaneous femoral adipocytes increase in number (hyperplasia), perhaps due to increased levels of the adipogenic transcription factors CCAAT/ enhancer-binding protein α (C/EBPα; GeneBank accession No: NC_000019) and peroxisome proliferator-activated receptor-γ2 (PPARγ2; GeneBank accession No: NC_000003) in hypertrophic adipocytes[33]. Hypertrophic adipocytes tend to be
associated with dyslipidemia and insulin resistance[34].
It has been suggested that the composition of gluteal fat deposits correspond more closely with that of visceral deposits rather than femoral deposits[35].
In conclusion, diagnosis, therapy and follow up of all subtypes of obesity must not be based on “body weight” parameter, but body composition parameters and energetic expenditure are required.
To overcome misclassifications, direct measure-ments of PBF, by magnetic resonance imaging (MRI), computerized tomography (CT), dual energy X-ray absorptiometry (DXA), bioimpedence analysis, total body water or hydrometry, and skinfold thickness would be a better tool for diagnosing the obese phenotypes (Figure 1).
OBESITY AS DISEASE: SICk FAT OR FAT
MASS DISEASE
Bays et al[36] have coined a new term that well defines
the concept of “sick fat”, the adiposopathy, in order to highlight the pathogenic role of adipose tissue. The adiposopathy is caused by positive caloric balance, that occurred in hypercaloric diet and sedentary lifestyle in genetically predisposed and environmentally sensitive individual[36]. Impaired adipocyte proliferation
or differentiation (adipogenesis), visceral adiposity, growth of adipose tissue beyond adequate vascular supply and ectopic fat deposition are anatomical manifestations of adiposopathy that are associated with adverse endocrine and immune responses leading to metabolic disease[37,38].
In order to understand the importance of the role of adipose tissue in the onset of a pathological condition and distinguish the degree and type of disease, we agree with the definition proposed by Bays of adiposopathy, as “sick fat disease”, and obesity
tissue accumulation in ectopic locations such as liver, skeletal muscle, and pancreas as well as visceral adiposity[49].
The existence of “metabolically healthy obese (MHO)”[50,51] further supports this concept as these
individuals have less ectopic fat despite high amount of subcutaneous fat in gluteal depot and are insulin sensitive[51].
Therefore, adipose tissue distribution is a more significant predictor of metabolic and cardiovascular risk than overall adiposity. Inability to expand subcutaneous depots in response to positive energy balance[52] results
in metabolic and cardiovascular complications.
IMPACT OF CROSS TALk
Adipose tissue, found in several locations throughout the body and long thought to be primarily a repository for triglycerides, is also important for regulating metabolism and body’s physiologic. Fat is an endocrine tissue and, indeed, may constitute the largest endocrine organ in the body[53,54].
If in the past, adipose tissue was considered to be a metabolically inactive fat depot, the current view of adipose tissue is that of an active secretory organ, sending out and responding to signals that modulate appetite, energy expenditure, insulin sensitivity, endocrine and reproductive systems, bone metabolism, and inflammation and immunity[55].
Expansion of the adipose tissue is accompanied by an increased infiltration of immune cells, in particular macrophages and T-cells[56], with a pro-inflammatory
phenotype. The “cross-talk” between the infiltrating cells and the tissue-resident adipocytes leads to secretion of adipokines, cytokines, chemokines, and lipids with a predominant proinflammatory character[57].
Several indirect lines of evidence suggest that fatty acids can modulate the immune response. One of these is that levels of several fatty acids are associated with levels of inflammatory markers in healthy individuals[58].
More directly, the type of fatty acids contained in the diet has been suggested to influence the risk of development of inflammatory diseases in which the immune system plays an important role.
This cross-talk has an also been shown to affect the function of adipocytes, such as lipolysis, which will most likely result in altered concentration of circulating free fatty acids.
Some of obesity phenotypes are associated with a high risk of developing diabetes type 2 (T2DM) however for a given adiposity, there is a large hetero-geneity in the metabolic risk mainly linked to the location of excessive adipose tissue.
The cause of glucose, lipid, or atherogenic disorders can be found in the visceral adipose tissue (VAT), representing a predictive factor for those disorders[59].
The role of visceral fat in the development of peripheral insulin resistance in T2DM is related to the insulin-mediated glucose uptake[60], that can be
directly affected by inflammatory cytokines, like tumor necrosis factor alpha (TNF-α), transforming growth factor beta (TGF-β), and interleukin 6 (IL-6) secreted by visceral fat depot.
Moreover, it has been demonstrated that both hepatic fat accumulation than hepatic insulin resistance are related to visceral fat depots, representing approximately 20% of total body fat mass in men and 6% in women[61], as approximately 80% of hepatic
blood supply is derived from the portal vein[62].
Due to the interactions within adipose tissue and muscle, involved in the endocrine bi-directional “cross-talk” between these tissues[63], it was observed a loss
of muscle strength, that depends on both decrease in muscle mass and accumulation of inter-muscular adipose tissue, contributing to the decline of muscle quality[64]. Therefore, the evaluation of body lean mass,
together with body fat mass analysis and body force assessment, could contribute to predict sarcopenic obesity risk.
INFLAMMATION AND THE ROLE
OF GENETIC vARIATIONS OF
INFLAMMATORY TRIAD CYTOkINES
IN OBESITY RELATED
CHRONIC-DEGENERATIvE DISEASES
The obese state is a lowgrade systemic inflammation, characterized by abnormal adipokine production, and activation of some pro-inflammatory signalling pathways, resulting in the induction of several biological markers of inflammation. In fact, inflam-matory markers, such as C-reactive protein (CRP), IL-6, IL-1 family [IL-1α, IL-1β and IL-1 receptor antagonist (IL-1Ra)] and TNF-α are increased in obese individuals compared with lean subjects, although not to the same extent observed in classic inflammatory conditions[65].
Though all the functional consequences of the increase in inflammatory processes in obese are not yet known, is an established fact that cytokines have metabolic activities, as many “adipokines” can modulate of both the metabolic and vascular homeostasis[66], acting not only as autocrine/paracrine
regulators, but also reaching, from the perivascular fat depot, the surrounding target organs, through the systemic circulation (“outside-to-inside” cellular cross-talk)[67-69].
This inflammatory mechanism is the basis of the increased risk of development of T2DM, acute heart attacks and Alzheimer’s disease[70,71] in obesity.
Polymorphisms and allele variants of cytokines genes are presumed to be involved in obesity and related chronic-degenerative diseases, therefore an understanding of their food association could be useful for nutritional pre-emption.
medicine requires early identification of the individuals who are on a path toward earlier development of disease, followed by the introduction of a targeted intervention. Ideally, one could use the identification of specific polymorphisms, an early marker of disease susceptibility, to prevent complications of disease by the use of nutritional agents that modulate the biology resulting from the genetic variation.
A high degree of sequence variation recently has been shown to exist in cytokine genes. These gene polymorphisms are relatively common in regulatory regions of the cytokine genes and therefore may be functionally significant in defining inter-individual differences in transcription or post-transcriptional processes. These genetic variations therefore provide a potential mechanism by which individuals may have different degrees of response to the same stimulus.
Among the first genes activated with any injurious challenge are the genes for IL-6, IL-1 and TNF-α. These molecules activate each other and both are critical components of the inflammatory process.
IL-6
Besides regulating the immune system, IL-6 also plays a role in the regulation of body fat and energy expenditure. Recent studies have shown that IL-6 deficient mice develop mature onset obesity with high leptin levels in the circulation[28].
Moreover, intracerebroventricular IL-6 treatment decreases body fat and increases energy expenditure in rodents[72].
In humans, high cytokine levels (including IL-6) and cytokine brain synthesis were found to increase resting energy expenditure and induce cachexia. Additionally, a subcutaneous injection of IL-6 increased resting metabolic rate and hypothalamic-pituitary-adrenal axis activity in a dose-dependent fashion, suggesting that hypothalamic corticotrophin-releasing hormone may mediate both of these actions in humans. A second possibility by which IL-6 may affect energy expenditure is enhanced adrenergic stimulation. In the other hand, high circulating IL-6 concentrations have been found to predict the development of type 2 diabetes[73,74].
IL-6 has a central role in the mechanism of pro-inflammation pathway and there are some evidences suggesting the implication of a network of cytokines for the development of metabolic disorders, as type 2 diabetes, CVD, and sarcopenia.
Polymorphisms that affect the gene transcription and production of IL-6, like the gene promoter -174 G/C polymorphism, are examples of genetically deter-mined-changes in metabolism and energy homeostasis. In fact, IL-6 gene promoter polymorphism -174 G/C is shown to influence IL-6 transcription as well as overweight and insulin sensitivity.
Data suggest that endogenous IL-6 has effects on energy expenditure but upper endogenous IL-6 production, e.g., due to the presence of allele C of
-174G/C polymorphism, contributes to obesity in humans and related pathologies and is a disadvantage for longevity.
TNF-α
Macrophages, whose adipose tissue is composed, are the major source of TNF-α produced by the white adipose tissue and contribute approximately 50% of white adipose tissue-derived IL-6[75].
TNF-α participates to inflammatory events but it’s also an important autocrine/paracrine of fat cell function which limits adipose tissue and skeletal muscle expansion, by inducing lipolysis[76], insulin resistance[77],
and muscle apoptosis[78]. Its presence also results in
an increase in circulating leptin concentrations[79] and,
finally, its overexpression, by exceeding fat, aimed at stopping the growth of tissues[80].
Several population-based studies have suggested an association between TNF-α polymorphisms and obesity-related phenotypes[81].
TNF-α has a direct (possibly paracrine) function in adipose tissue where it limits its mass by stimulating lipolysis and decreasing lipoprotein lipase expression and activity, that means it’s involved in the adipostatic function[76].
TNF-α can induce hyperlipidemia and insulin resistance, especially in presence of single nucleotide polymorphisms (SNPs) on the promoter (-308 G/A and -238 G/A)[82].
In fact, TNF-α is an antagonist of insulin receptor and an overproduction could impair insulin signalling as well as down-regulate adipose lipase producing hyperlipidemia. Levels of TNF-α are high in an obese population and moreover experiments in vitro show that allele A alters binding of nuclear factors to the -308 region causing a general increase in transcriptional[83].
Interestingly, cases with the -308 A allele of the TNF-α gene have significantly higher hip and WC, BMI and body fat mass values than obese individuals carrying the -308 G allele, but not the waist-to-hip ratio[84].
An higher fasting insulin levels, higher Homeostasis Model Assessment of Insulin Resistance (HOMA-IR), higher systolic blood pressure and lower HDL cholesterol were highlighted among -308 A allele TNF-α obese carriers than -308 G obese carriers, and overweight subjects with impaired glucose tolerance showing a genotype have higher risk of developing T2DM than subjects without this genotype[85].
This observation is consistent with previous findings, suggesting that leptin secretion and insulin resistance are affected by TNF-α expression. Disturbances in circulating levels of leptin may be accompanied by a lower control of appetite and thermogenesis or may occur as a consequence of leptin resistance.
IL-1
Other intriguing molecules produced by adipose tissue and involved in metabolism are that belonging to
the class of IL-1. IL-1 biological activity involves two agonists, IL-1α and IL-1β, specific receptors, and a naturally occurring antagonist, IL-1Ra. Some of the most relevant properties of IL-1 biological activity are the ability to initiate cyclooxygenase type 2 and inducible nitric oxide, leading to substantial expression of prostaglandin E2 and nitric oxide by cells exposed to IL-1β.
Moreover, IL-1β is able to determine lipolysis, glucose transport, and adipocyte maturation in adipose tissue, to inhibit lipogenesis, via the IL-1 receptor type 1 and the IL-1 receptor accessory protein, like TNF-α.
In obese individuals the serum level of IL-1Ra is up-regulated for a feedback down-regulation, resulting in an acquired resistance to leptin, rising the high values as in inflammatory autoimmune diseases and sepsis[86,87].
Polymorphisms affecting IL-1 production, like the SNP at IL-1β (+3954), the SNP at IL-1α (-889) and the SNP at IL-1α (+4845) are associated with increased levels of inflammatory mediators, and also with increased severity of several chronic diseases, including Alzheimer’s disease[88], periodontal disease and
others. This proinflammatory IL-1 genotype pattern recently has been associated with cardiovascular acute coronary events. For example, despite having total cholesterol levels below 200 mg/dL, individuals who carried two copies of IL-1α (+4845) allele 2 were four times (P < 0.01) more likely to have a coronary heart disease event during an 11-y monitoring period than were individuals with the same level of cholesterol but who did not carry this IL-1 genotype (unpublished data, Interleukin Genetics, Waltham, MA, United States). The IL-1Ra antagonizes the effects of IL-1α and -1β[89], and the antiinflammatory cytokine interferon
beta and leptin can induce IL-1Ra production without increasing IL-1[86,90]. In subjects with hyperleptinemic
obese individuals the serum sIL-1Ra levels are higher as compared to non obese subjects[91].
Furthermore, in subjects that underwent to in-testinal bypass surgery, sIL-1Ra levels dropped after weight loss, correlating with BMI and the degree of insulin resistance better than with serum leptin levels, according to metabolic control unmediated by leptin.
GLUCOTOXICITY
The ability of the pancreatic alpha and beta cells to increase the uptake of glucose can be compromised by constant hyperglycemia, even mild. This mechanism, compromising the glucose transport mediated by insulin, prevents the possibility of self correction, and start a vicious cycle mechanism that leads to dete-rioration of the metabolic process[92].
Continuous overstimulation of the beta-cell by glucose could eventually lead to depletion of insulin stores, worsening of hyperglycemia, and finally dete rioration of beta-cell function.
The mechanisms responsible for changes of insulin sensitivity vs insulin resistance clearly vary and involve changes in both beta -cell function and beta -cell mass, although in most instances it appears that functional changes predominate. Moreover, the beta-cell must also alter its activity when this critical modulator changes for more prolonged periods[60].
Several mechanisms might explain the glucotoxicity due to prolonged hyperglycemia[93,94], such as beta -cell
exhaustion, oxidative stress induced by free radical oxygen species, endoplasmic reticulum (ER) stress, inflammation caused by proinflammatory cytokines and chemokines, loss of neogenesis, proliferation of beta -cells, gradual loss of insulin gene expression and other betacell specific genes, changes in mitochondrial number, morphology and function, disruption in calcium homeostasis[95].
In the presence of hyperglycemia, prolonged exposure to increased free fatty acids result in accu-mulation of toxic metabolites in the cells (“lipotoxicity”), finally causing decreased insulin gene expression and impairment of insulin secretion.
Chronic exposure to abnormally high blood glucose has detrimental effects on insulin synthesis/secretion, cell survival and insulin sensitivity through multiple mechanisms (“glucotoxicity”), which in turn lead to hyper-glycemia and finally to the vicious circle of continuous deterioration of beta cell function[96].
Beta cells exposed to an increased insulin secretory request place a high demand on ER for the synthesis of proinsulin, leading to cellular stress[97].
Due to chronic ER stress and strong unfolded protein response, beta cell death through apoptosis (mediated by stress kinases and transcription factors) may be initiated. In addition to glucose, free fatty acids (FFA) and islet amyloid polypeptide are triggers of beta cell ER stress[98].Moreover, reactive oxygen species (ROS),
free radicals that are intermediate metabolites derived from oxygen metabolism in mitochondria, primarily due to hyperglycemia, causes oxidative stress in various tissues, playing an important role in both physiology and pathology in beta-cells. ROS are continuously produced by the mitochondrial electron transport system as a byproduct of the oxidative phosphorylation pathway; however, normal cells have antioxidant defenses to rapidly neutralize ROS and maintain an optimal redox potential for appropriate biological cell function[99]. This
optimal redox balance is impaired because of increased ROS production and insufficient endogenous antioxidant defenses of the β-cells.
Chronic hyperglycemia leads to decreased number of mitochondria and changes of their morphology[99] in
the β-cells. This is associated with impaired oxidative phosphorylation, decreased mitochondrial Ca2+
capacity and decline in ATP generation[100]. In addition,
disruption in Ca2+ homeostasis (e.g., changes in
glucose-induced Ca2+ influx, ER Ca2+ depletion)
the insulin secretion pathway[101].
LIPOTOXICITY
When adipose tissue cannot meet the demand of storing excessive energy, triglyceride is accumulated in non-adipose tissues as ectopic fat, which may lead to insulin resistance in the liver and skeletal muscle and insufficient insulin secretion in the pancreas[48,102,103].
High plasma FFA and triglyceride levels lead to increased import of FFAs into non-adipose tissues (i.e., liver, muscle, pancreas), contributing to intracellular lipid accumulation. This phenomenon, known as lipotoxicity, may play an important role in the pathogenesis of diabetes and heart failure in humans[104].
Adverse consequences of lipid overload have been observed in many organ systems, mainly in the heart, skeletal muscle, pancreas, liver, and kidney[104].
In addition to primary hyperlipidemias, serum trigly-cerides[105,106] and FFAs[107] are elevated in type 1 and
type 2 diabetics and plasma FFA levels are elevated in obese individuals[108].
The cross-talk has been shown to affect the function of adipocytes, such as lipolysis, which will most likely result in an altered concentration of circulating free fatty acids. Indeed, obese persons have higher levels of free fatty acids in plasma compared to lean subjects[109-111].
Several indirect lines of evidence suggest that fatty acids, contained in the diet, can modulate the immune response. One of these is that levels of several fatty acids are associated with levels of inflammatory markers in healthy individuals[58].
The overall data suggest that low concentrations of fatty acids can influence the proliferation of Tcells, whereas higher concentrations induce apoptosis in a dose- dependent manner, through the induction of several pathways[112-117].
In addition, the concentration at which apoptosis occurs is also determined by the degree of saturation and the length of the fatty acid. While short-chain fatty acids are not toxic even at a concentration of 800 mmol/L or higher[113], longer, and more unsaturated
fatty acids can already be toxic in low concentrations (e.g., linoleic acids) is toxic at 100 mmol/L[114,115].
In contrast to the apoptotic effects, the modulatory effects of low, non-toxic concentrations of fatty acids on proliferation do not seem to correlate with length of the fatty acids tested.
de Jong et al[59] conclude that, free fatty acids induce
proliferation of resting T-cells in low concentrations, while higher concentrations induce apoptosis.
BODY FAT DISTRIBUTION ACROSS
GENDER AND ETNICITY
Etiological contributing factors to VAT depot and distribution are represented by age, gender, genetics,
and ethnicity[118].
Substantial anatomical differences between males, that accumulate adipose tissue in the upper body (trunk, abdomen), and females, with a usual accumulation of adipose tissue in the lower body (hips, thighs), are practically unique in human[119-121].
Vague[122] identified two different body shapes,
proposing the two terms “android obesity”, to refer to adipose tissue accumulated preferentially in the trunk/ upper body area closely related to hypertension, CVD, gout, and diabetes, and the term “gynoid obesity” to refer to adipose tissue accumulation in the hips and thighs, with less associated complications[123,124].
Visceral fat depot, evaluated by MRI and computed tomography (CT), was found to be specifically asso-ciated with the metabolic alterations related to obesity, both in men and women[125-127]; subcutaneous fat in
general define a positive effect on insulin sensitivity[128].
Genetic predisposition could explain the fact that females, although high BMI, are protected against insulin resistance more than males[118]. Furthermore,
the capacity to increase the fat depots depends on the ease with which local preadipocytes can be readily activated toward differentiation process[129].
Although ethnicity is a factor that determines the different adipose tissue distribution and responses to the cardiometabolic risks[118,130,131], as highlighted by
Deurenberg et al[132], that observed ethnic differences
in BMI at similar levels of PBF, in Chinese, Indonesian, and Thai populations respect to Caucasians (American, Australian, and European Whites analyzed as one group). Moreover, Asian Indians have more abdominal fat than Caucasians[133,134], and Caucasians have more
VAT than African Americans[135-137]. On the other hand,
in Asians and Indian Asians the accumulation of fat is mainly in the visceral area[131,138,139].
Genetic and epigenetic programming is one of the most credible explanations for the observed differences in the storage of lipid depot[118,139,140].
OBESITY: BODY COMPOSITION
PHENOTYPES
Nowadays four phenotypes of obese individuals have been widely described (Table 1): (1) normal weight obese (NWO)[141]; (2) metabolically obese normal
weight (MONW)[142,143]; (3) MHO; and (4) metabolically
unhealthy obese (MUO) or “at risk” obese with MS[144].
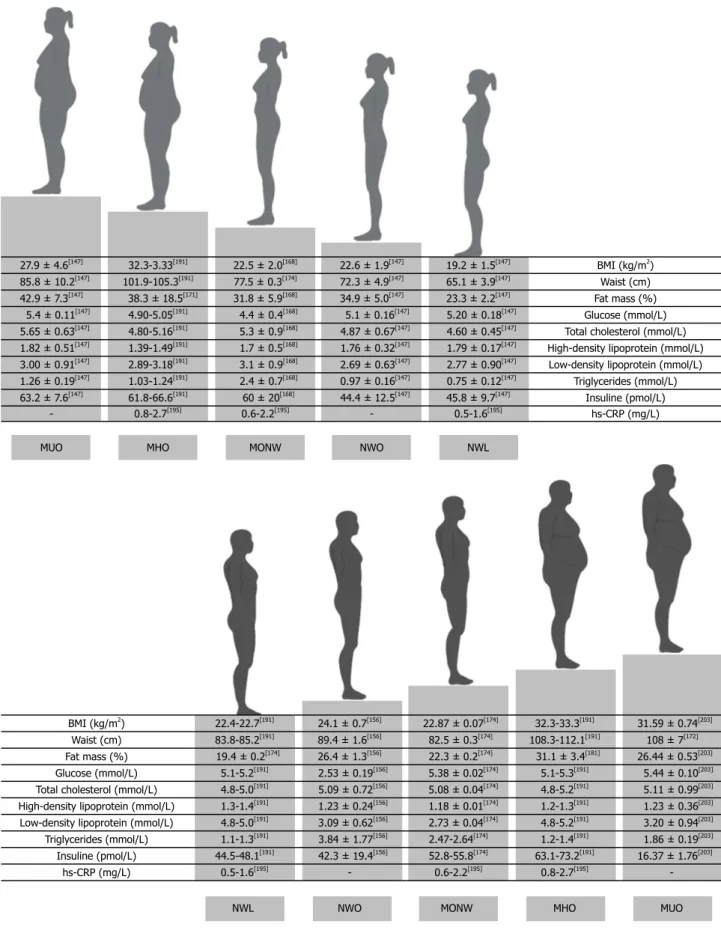
The characteristic of the four obese phenotypes are depicted in Figure 2.
Moreover, the sarcopenic obesity has been charac-terized, and related to all the described phenotypes[145].
Moreover the category of normal weight lean (NWL), represented by metabolically healthy normal weight (MHNW) has been classified to distinguish from NWO.
According to the causality and anatomic, patho-physiologic, and clinical manifestations of obese phenotypes, we can define NWO and MHO belonging
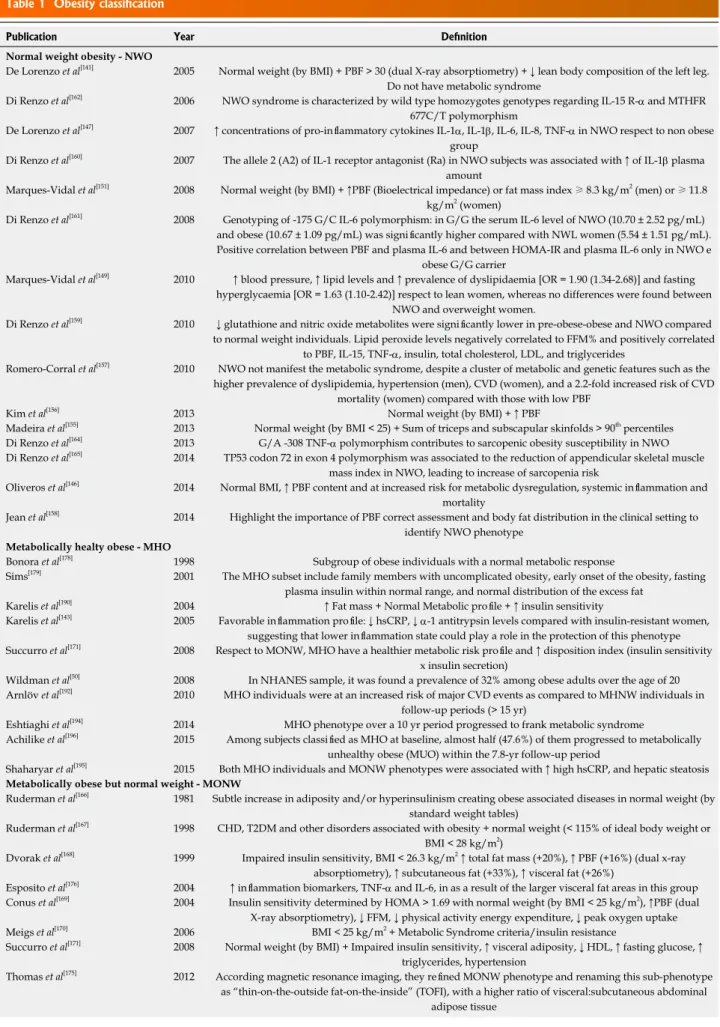
Table 1 Obesity classification
Publication Year Definition
Normal weight obesity - NWO
De Lorenzo et al[141] 2005 Normal weight (by BMI) + PBF > 30 (dual X-ray absorptiometry) + ↓ lean body composition of the left leg.
Do not have metabolic syndrome
Di Renzo et al[162] 2006 NWO syndrome is characterized by wild type homozygotes genotypes regarding IL-15 R-α and MTHFR
677C/T polymorphism
De Lorenzo et al[147] 2007 ↑ concentrations of pro-inflammatory cytokines IL-1α, IL-1β, IL-6, IL-8, TNF-α in NWO respect to non obese
group
Di Renzo et al[160] 2007 The allele 2 (A2) of IL-1 receptor antagonist (Ra) in NWO subjects was associated with ↑ of IL-1β plasma
amount
Marques-Vidal et al[151] 2008 Normal weight (by BMI) + ↑PBF (Bioelectrical impedance) or fat mass index ≥ 8.3 kg/m2 (men) or ≥ 11.8
kg/m2 (women)
Di Renzo et al[161] 2008 Genotyping of -175 G/C IL-6 polymorphism: in G/G the serum IL-6 level of NWO (10.70 ± 2.52 pg/mL)
and obese (10.67 ± 1.09 pg/mL) was significantly higher compared with NWL women (5.54 ± 1.51 pg/mL). Positive correlation between PBF and plasma IL-6 and between HOMA-IR and plasma IL-6 only in NWO e
obese G/G carrier
Marques-Vidal et al[149] 2010 ↑ blood pressure, ↑ lipid levels and ↑ prevalence of dyslipidaemia [OR = 1.90 (1.34-2.68)] and fasting
hyperglycaemia [OR = 1.63 (1.10-2.42)] respect to lean women, whereas no differences were found between NWO and overweight women.
Di Renzo et al[159] 2010 ↓ glutathione and nitric oxide metabolites were significantly lower in pre-obese-obese and NWO compared
to normal weight individuals. Lipid peroxide levels negatively correlated to FFM% and positively correlated to PBF, IL-15, TNF-α, insulin, total cholesterol, LDL, and triglycerides
Romero-Corral et al[157] 2010 NWO not manifest the metabolic syndrome, despite a cluster of metabolic and genetic features such as the
higher prevalence of dyslipidemia, hypertension (men), CVD (women), and a 2.2-fold increased risk of CVD mortality (women) compared with those with low PBF
Kim et al[156] 2013 Normal weight (by BMI) + ↑ PBF
Madeira et al[155] 2013 Normal weight (by BMI < 25) + Sum of triceps and subscapular skinfolds > 90th percentiles
Di Renzo et al[164] 2013 G/A -308 TNF-α polymorphism contributes to sarcopenic obesity susceptibility in NWO
Di Renzo et al[165] 2014 TP53 codon 72 in exon 4 polymorphism was associated to the reduction of appendicular skeletal muscle
mass index in NWO, leading to increase of sarcopenia risk
Oliveros et al[146] 2014 Normal BMI, ↑ PBF content and at increased risk for metabolic dysregulation, systemic inflammation and
mortality
Jean et al[158] 2014 Highlight the importance of PBF correct assessment and body fat distribution in the clinical setting to
identify NWO phenotype
Metabolically healty obese - MHO
Bonora et al[178] 1998 Subgroup of obese individuals with a normal metabolic response
Sims[179] 2001 The MHO subset include family members with uncomplicated obesity, early onset of the obesity, fasting
plasma insulin within normal range, and normal distribution of the excess fat Karelis et al[190] 2004 ↑ Fat mass + Normal Metabolic profile + ↑ insulin sensitivity
Karelis et al[143] 2005 Favorable inflammation profile: ↓ hsCRP, ↓ α-1 antitrypsin levels compared with insulin-resistant women,
suggesting that lower inflammation state could play a role in the protection of this phenotype Succurro et al[171] 2008 Respect to MONW, MHO have a healthier metabolic risk profile and ↑ disposition index (insulin sensitivity
x insulin secretion)
Wildman et al[50] 2008 In NHANES sample, it was found a prevalence of 32% among obese adults over the age of 20
Arnlöv et al[192] 2010 MHO individuals were at an increased risk of major CVD events as compared to MHNW individuals in
follow-up periods (> 15 yr)
Eshtiaghi et al[194] 2014 MHO phenotype over a 10 yr period progressed to frank metabolic syndrome
Achilike et al[196] 2015 Among subjects classified as MHO at baseline, almost half (47.6%) of them progressed to metabolically
unhealthy obese (MUO) within the 7.8-yr follow-up period
Shaharyar et al[195] 2015 Both MHO individuals and MONW phenotypes were associated with ↑ high hsCRP, and hepatic steatosis Metabolically obese but normal weight - MONW
Ruderman et al[166] 1981 Subtle increase in adiposity and/or hyperinsulinism creating obese associated diseases in normal weight (by
standard weight tables)
Ruderman et al[167] 1998 CHD, T2DM and other disorders associated with obesity + normal weight (< 115% of ideal body weight or
BMI < 28 kg/m2)
Dvorak et al[168] 1999 Impaired insulin sensitivity, BMI < 26.3 kg/m2 ↑ total fat mass (+20%), ↑ PBF (+16%) (dual x-ray
absorptiometry), ↑ subcutaneous fat (+33%), ↑ visceral fat (+26%)
Esposito et al[176] 2004 ↑ inflammation biomarkers, TNF-α and IL-6, in as a result of the larger visceral fat areas in this group
Conus et al[169] 2004 Insulin sensitivity determined by HOMA > 1.69 with normal weight (by BMI < 25 kg/m2), ↑PBF (dual
X-ray absorptiometry), ↓ FFM, ↓ physical activity energy expenditure, ↓ peak oxygen uptake Meigs et al[170] 2006 BMI < 25 kg/m2 + Metabolic Syndrome criteria/insulin resistance
Succurro et al[171] 2008 Normal weight (by BMI) + Impaired insulin sensitivity, ↑ visceral adiposity, ↓ HDL, ↑ fasting glucose, ↑
triglycerides, hypertension
Thomas et al[175] 2012 According magnetic resonance imaging, they refined MONW phenotype and renaming this sub-phenotype
as “thin-on-the-outside fat-on-the-inside” (TOFI), with a higher ratio of visceral:subcutaneous abdominal adipose tissue
to the category of “fat mass disease”, and MONW and at risk obesity to “sick fat disease”. Moreover, NWO women are quite different from MHO women and may also be distinguished from MONW women, according to fat distribution, inflammatory and metabolic para meters, and genetic variants.
NWO
The new concept of NWO had been proposed[141,146].
NWO subjects have normal BMI (18.5-24.9 kg/m2),
and highest body fat percentage (BF%) (men, ≥ 23.5%, women, ≥ 29.2%), associated at a higher degree of subclinical vascular inflammation and risk for cardiometabolic disease, of which body fat is a major contributing factor[147-149].
Worldwide prevalence of NWO is near to 10%, and the prevalence is higher in women than in men[150-152].
In women, prevalence of NWO increased considerably with age, and virtually all women aged over 55 with a BMI < 25 kg/m2 were actually considered as NWO.
Even if the proportion of PBF changes with age and sex[23,153], using sex and agespecific thresholds for PBF
led to a much lower prevalence of NWO in women, whereas little differences were found for men[15,20].
As demonstrated by Kang et al[154], NWO subjects
highlighted a significantly higher blood pressure, fasting glucose level, and worse lipid profile compared to normal weight subjects, independently associated with elevated TBRmax values, that may determine and justify the metabolic and CVD occurring risks.
Due to the peculiarity of the relationship between lean mass distribution (lean of the right part of the body trunk and of the left leg), and CVD risk indexes, NWO could be considered an additional metabolic subset of obesity[141,155,156].
They also do not manifest the MS, despite a cluster of metabolic and genetic features such as the higher prevalence of dyslipidemia, hypertension (men), CVD (women), and a 2.2-fold increased risk of CVD mortality (women) compared with those with low total body fat mass[157].
Jean et al[158] have provided three potential
expla-nations for why normal-weight central obesity is linked to increased mortality include the following: (1) the accumulation of abdominal visceral fat as manifested by an increased girth: there is a very strong association between WC and visceral adiposity and the excess adipose tissue in the abdominal cavity organs, which are a source of inflammation and insulin resistance; (2) the reduced amounts of subcutaneous fat in the legs, hips, and buttocks, known to be protective for CVD and with a favorable metabolic function; and (3) the limited muscle mass, because like in NWO, people with normal-weight central obesity may also have sarcopenic obesity since, in order to have normal weight in the setting of large amounts of visceral fat, they likely have limited amounts of muscle mass.
De Lorenzo et al[141] firstly described the NWO
syndrome characterized by higher oxidative stress level[159]
, early inflammatory status[147]
and few metabolic abnormalities.
The presence of SNPs of triad inflammatory genes, characterizes the NWO syndrome.
In NWO syndrome, the IL-1Ra allele 2 increases the risk of ovarian, pancreatic, cervical and gastric cancer, probably due to increased IL-1 production and inhibition of gastric acid secretion[160].
According to the -174G/C promoter polymorphism of the IL-6 gene, G/G NWO showed a strong corre-lation between HOMA-IR and PBF[161].
Eckel et al[172] 2015 ↑ waist circumference (women: 75.5 cm vs 73.1 cm; men: 88.0 cm vs 85.1 cm), ↑ HbA1c (6.1% vs 5.3%), ↑
triglycerides (1.47 mmol/L vs 1.11 mmol/L), and ↑ hsCRP (0.81 mg/L vs 0.51 mg/L) , ↓ HDL (1.28 mmol/L
vs 1.49 mmol/L) and ↓ adiponectin (6.32 μg/L vs 8.25 μg/mL)
Du et al[173] 2015 Lipid accumulation product and visceral adiposity index, two markers of visceral obesity, identify the
MONW phenotype
Metabolically unhealthy obese - MUO
Alberti et al[201] 2005 MUO subjects are characterized by a BMI ≥ 30 kg/m2, a PBF > 30% and high visceral fat mass, closely linked
to the development of the metabolic syndrome, T2DM, and atherosclerotic cardiovascular disease Fabbrini et al[47] 2009 In MAO subjects, but not MNO subjects, moderate weight exacerbated several metabolic risk factors for
CVD: ↑ blood pressure, ↑ plasma triglyceride,↑ in intra hepatic triglyceride, ↑ VLDL apoB100 and ↓ plasma adiponectin concentrations and insulin sensitivity in the liver, skeletal muscle, and adipose tissues, ↓ adipose
tissue expression of genes involved in glucose uptake and lipogenesis
O'Connell et al[210] 2010 MUO and obese with T2DM subjects had a omental adipocyte size greater than MHO, moreover MUO
group had an intermediate degree of steatosis (43%) respect to MHO (3%) and obese with T2DM (74%). Di Daniele et al[202] 2013 6 mo of dietary intervention based on Italian Mediterranean Diet in “at risk” obese subjects, determined
a reduction (-52%) in the prevalence of the metabolic syndrome and a reduction in terms of waist circumference, BMI and total body weight.
Calanna et al[211] 2013 At-risk obese individuals showed ↑ plasma glucose dependent insulinotropic polypeptide, ↓ post-glucose
load glucagone-like-peptide-1, and ↑ levels at baseline and after glucose load, indicating inappropriate glucagone suppression
BMI: Body mass index; PBF: Percentage of total body fat; NWO: Normal weight obesity; NWL: Normal weight lean; FFM: Fat free mass; HOMA: Homeostatic model assessment; LDL: Low density lipoprotein; HDL: High density lipoprotein; CVD: Cardiovascular disease; MHO: Metabolically healthy obese; HbA1c: Glycated haemoglobin; hsCRP: High sensitive C-reactive protein; MHNW: Metabolically healthy normal weight; MONW: Metabolically obese normal weight; MUO: Metabolically unhealthy obese; CHD: Chronic heart disease; T2DM: Type 2 diabetes mellitus; MAO: Metabolic abnormal obese; MNO: Metabolically normal obese.
Moreover, NWO are characterized by a wild type homozygotes genotypes regarding IL-15 receptor-alpha and methylenetetrahydrofolate reductase (MTHFR)
enzyme[162], suggesting a “conversation” between
adipose tissue and skeletal muscle[163].
The importance of the TNF-α gene polymorphism 27.9 ± 4.6[147] 32.3-3.33[191] 22.5 ± 2.0[168] 22.6 ± 1.9[147] 19.2 ± 1.5[147] BMI (kg/m2)
85.8 ± 10.2[147] 101.9-105.3[191] 77.5 ± 0.3[174] 72.3 ± 4.9[147] 65.1 ± 3.9[147] Waist (cm)
42.9 ± 7.3[147] 38.3 ± 18.5[171] 31.8 ± 5.9[168] 34.9 ± 5.0[147] 23.3 ± 2.2[147] Fat mass (%)
5.4 ± 0.11[147] 4.90-5.05[191] 4.4 ± 0.4[168] 5.1 ± 0.16[147] 5.20 ± 0.18[147] Glucose (mmol/L)
5.65 ± 0.63[147] 4.80-5.16[191] 5.3 ± 0.9[168] 4.87 ± 0.67[147] 4.60 ± 0.45[147] Total cholesterol (mmol/L)
1.82 ± 0.51[147] 1.39-1.49[191] 1.7 ± 0.5[168] 1.76 ± 0.32[147] 1.79 ± 0.17[147] High-density lipoprotein (mmol/L)
3.00 ± 0.91[147] 2.89-3.18[191] 3.1 ± 0.9[168] 2.69 ± 0.63[147] 2.77 ± 0.90[147] Low-density lipoprotein (mmol/L)
1.26 ± 0.19[147] 1.03-1.24[191] 2.4 ± 0.7[168] 0.97 ± 0.16[147] 0.75 ± 0.12[147] Triglycerides (mmol/L)
63.2 ± 7.6[147] 61.8-66.6[191] 60 ± 20[168] 44.4 ± 12.5[147] 45.8 ± 9.7[147] Insuline (pmol/L)
- 0.8-2.7[195] 0.6-2.2[195] - 0.5-1.6[195] hs-CRP (mg/L)
MUO MHO MONW NWO NWL
BMI (kg/m2) 22.4-22.7[191] 24.1 ± 0.7[156] 22.87 ± 0.07[174] 32.3-33.3[191] 31.59 ± 0.74[203]
Waist (cm) 83.8-85.2[191] 89.4 ± 1.6[156] 82.5 ± 0.3[174] 108.3-112.1[191] 108 ± 7[172]
Fat mass (%) 19.4 ± 0.2[174] 26.4 ± 1.3[156] 22.3 ± 0.2[174] 31.1 ± 3.4[181] 26.44 ± 0.53[203]
Glucose (mmol/L) 5.1-5.2[191] 2.53 ± 0.19[156] 5.38 ± 0.02[174] 5.1-5.3[191] 5.44 ± 0.10[203]
Total cholesterol (mmol/L) 4.8-5.0[191] 5.09 ± 0.72[156] 5.08 ± 0.04[174] 4.8-5.2[191] 5.11 ± 0.99[203]
High-density lipoprotein (mmol/L) 1.3-1.4[191] 1.23 ± 0.24[156] 1.18 ± 0.01[174] 1.2-1.3[191] 1.23 ± 0.36[203]
Low-density lipoprotein (mmol/L) 4.8-5.0[191] 3.09 ± 0.62[156] 2.73 ± 0.04[174] 4.8-5.2[191] 3.20 ± 0.94[203]
Triglycerides (mmol/L) 1.1-1.3[191] 3.84 ± 1.77[156] 2.47-2.64[174] 1.2-1.4[191] 1.86 ± 0.19[203]
Insuline (pmol/L) 44.5-48.1[191] 42.3 ± 19.4[156] 52.8-55.8[174] 63.1-73.2[191] 16.37 ± 1.76[203]
hs-CRP (mg/L) 0.5-1.6[195] - 0.6-2.2[195] 0.8-2.7[195]
-NWL NWO MONW MHO MUO
Figure 2 Characteristic of the four obese phenotypes. A: Women; B: Men. NWO: Normal weight obese; MONW: metabolically obese normal weight; MHO: metabolically healthy obese; MUO: metabolically unhealthy obese; BMI: body mass index; hsP: High-sensitive C-reactive protein. Data are expressed as average ± SD (a ± b), or as minimum-maximum (a-b), according to the references.
to total body lean mass variation in NWO syndrome, demonstrating that G/A -308 TNF-α polymorphism contributes to sarcopenic obesity susceptibility[164].
TP53 codon 72 in exon 4 polymorphism was associated to the reduction of appendicular skeletal muscle mass index (ASMMI) in NWO, leading to increase of sarcopenia risk[165].
This finding gives much more support to the idea that a genetic approach could be predictive for finding a vulnerable category of people[160-162,164].
MONW
MONW subjects, first described and revisited by Ruderman et al[166,167], represents a subset of persons
who have a normal weight and normal BMI but have a cluster of metabolic characteristics that may increase the possibility of developing the MS.
MONW women, also defined as “metabolically unhealthy normal weight” (MUNW) have metabolic distur-bances typical of obese persons and are characterized by having a high amount of visceral fat, a low BMI, a high fat mass, a low lean body mass, low insulin sensitivity, and high triacylglycerol concentrations, premature chronic degenerative disease and liver fat[168-171].
In a recent paper Eckel et al[172] found that, MUNW
individuals were characterized by known diabetes risk factors, e.g., they were significantly more likely to be male, former smokers, hypertensive, and less physically active compared to normal weight individuals without incident diabetes. Higher WC (women: 75.5 cm vs 73.1 cm; men: 88.0 cm vs 85.1 cm), higher HbA1c (6.1% vs 5.3%), higher triglycerides
(1.47 mmol/L vs 1.11 mmol/L), and higher levels of high sensitive C-reactive protein (0.81 mg/L vs 0.51 mg/L) as well as lower levels of HDL-cholesterol (1.28 mmol/L vs 1.49 mmol/L) and adiponectin (6.32 μg/mL
vs 8.25 μg/mL) characterized this phenotype.
Moreover, lipid accumulation product (LAP) and visceral adiposity index, two markers of visceral obesity, identify the MONW phenotype[173].
Lee et al[174] recently found that in MONW
indivi-duals, the triglycerides index [(fasting triglycerides (mg/dL) × fasting glucose (mg/dL)/2)] was higher respect to normal weight population, managing to clearly discriminate individuals at metabolic risk from NWL subjects.
Thomas et al[175] refined MONW phenotype using
MRI, showing a disproportionate deposition of VAT respect to overweight or obese subjects; they called this sub-phenotype, “thin-on-the-outside fat-on-the-inside” (TOFI).
TOFI subjects showed a higher ratio of visceral: subcutaneous abdominal adipose tissue, and it was been observed in both male and female subjects and it was accompanied by increased levels of both liver and muscle fat[175].
Higher concentrations of inflammation biomarkers, TNF-α and IL-6, in the MONW group could be the result
of the larger visceral fat areas in this group, supporting the correlation between visceral fat and both insulin resistance and CVD[176].
However, in different population, CRP levels were significantly higher in MONW women than in the control group, and serum IL-6, IL-18 levels in males and females did not differ in both groups[177].
MHO
MHO is a new concept in which an individual may exhibit an obese phenotype in the absence of any metabolic abnormalities[178,179].
MHO persons, despite having excess of body fat, have a metabolic profile characterized by high insulin sensitivity, a favorable lipid profile, and no sign of hypertension[144].
However, there is no consensus as to how metabolic normality should be defined, so the reported prevalence of MHO ranges from 2% to 50%, depending on the specific criteria used and the population studied[50,180-189].
MHO subjects when compared with obese insulin resistant adults have a healthier metabolic risk profile and higher disposition index (insulin sensitivity X insulin secretion)[171].
According to Karelis et al[190], the selection criteria
for MHO individuals were partially based on the National Cholesterol Education Program’s Adult Treatment Panel Ⅲ report for lipid profiles [triglycerides: < 1.7 mmol/L, total cholesterol: < 5.2 mmol/L, HDL-cholesterol: > 1.3 mmol/L and low-density lipoprotein (LDL)-cholesterol: < 2.6 mmol/L] and from the study of Brochu et al[187]
for insulin sensitivity (HOMA < 1.95); when 4 out of 5 criteria are met, the diagnosis of the MHO individual could be made. Intrahepatic triglyceride (IHTG) content and VAT volume were much higher in metabolically abnormal obese subjects than in MHO subjects.
In 2005 Karelis et al[143] indicated that
postmeno-pausal women displaying the MHO phenotype also have a favorable inflammation profile, as shown by lower CRP and α-1 antitrypsin levels compared with insulinresistant women, suggesting that lower inflam mation state could play a role in the protection of this phenotype.
Manu et al[191] found that MHO was similar to NWL
group regarding terms of age, fasting glucose and triglyceride levels, but with higher insulin resistance, C-reactive protein levels, LDL cholesterol levels levels and systolic blood pressure, and lower intake of dietary fiber and levels of physical activity.
However, studies with longer follow-up periods (> 15 years) have demonstrated that MHO individuals were at an increased risk of major CVD events as compared to MHNW individuals[192,193].
Examining the natural history of the MHO phe-notype it has been showed that over half of subjects progressed to frank MS over a 10 years period[194].
Moreover, Shaharyar et al[195] demonstrated that
associated with elevated hs-CRP, and hepatic steatosis. In a recent paper, Achilike et al[196] showed that
among subjects classified as MHO at baseline, almost half (47.6%) of them progressed to MUO within the 7.8-year follow-up period. MHO individuals who developed MUO were older and had more adiposity, higher 10-year CHD risk and lower HDL cholesterol than those who remained as MHO or become non-obese. They conclude that, MHO may not be a stable condition, because it confers markedly increased risk of developing multiple metabolic abnormalities in the future.
According to the editorial comment of Puri[197], it
must be simply accepted that obesity is a disease, and no level of obesity can be considered healthy. In fact, the studies by Chang et al[198], demonstrated that, on
the basis of the coronary artery calcium scores, MHO had a significantly greater prevalence of coronary atherosclerosis than the metabolically-healthy but normal weight subjects. Moreover, Kramer et al[199]
observed that compared with NWL subjects, MHO were at significantly greater risk for death and cardiovascular events.
All these data raised serious doubts on the concept of obese people maintaining a benign prognosis and highlight the fact that obesity per se is a genuine disease[197].
Therefore, both MHO and MONW phenotypes, in the same manner of “at risk obese” phenotype, may not be benign and physicians should strive to treat individuals in these subgroups to reverse these conditions.
MUO
The MUO, also defined as “at risk” obese subjects are characterized by a BMI ≥ 30 kg/m2, a PBF >
30% and high visceral fat mass, closely linked to the development of the MS, T2DM, and atherosclerotic CVD[200-203].
Although a unifying definition of the MS does not exist[204-206], there is a worldwide agreement about
the role of insulin resistance and abdominal obesity as the main pathophysiological mechanisms for the development of metabolic disorders characterizing the MS[207,208].
Hormonal differences after an oral glucose tolerance test may explain the propensity for impaired glucose homeostasis in then “at-risk” obese phenotype[209].
O’Connell et al[210] divided the obese subjects in
three class: MHO, MUO and obese with DM. They found that MUO and T2DM obese subjects had an omental adipocyte size greater than MHO, while subcutaneous adipocyte size, was related to metabolic health, and possibly progression from hepatic steatosis to fibrosis. Moreover, they showed that MUO group had an intermediate degree of steatosis (43%) respect to MHO (3%) and obese with T2DM (74%). Finally, they suggested that the size of the individual’s adipocytes is more important than the size of the individual.
MUO individuals showed higher plasma glucose dependent insulinotropic polypeptide, lower post-glucose load glucagone-like-peptide-1, and higher levels at baseline and after glucose load, indicating inappropriate glucagone suppression[211].
Many studies have demonstrated that increased IHTG content (i.e., NAFLD) is a robust marker of metabolic dysfunction in obese people[47,212,213], and the
amount of IHTG is directly correlated with the degree of insulin resistance in the liver, skeletal muscle, and adipose tissue[214]
.
However, not all obese persons develop NAFLD, insulin resistance, and cardiometabolic disease. A sub-group of obese people are those have increased IHTG content are the “Metabolic Abnormal Obese” (MAO)[47]
. Roberts et al[215] and others[216-219] have found that,
compared with Metabolic Normal Obese (MNO) subjects, MAO have decreased adipose tissue expression of genes involved in glucose uptake and lipogenesis[47].
Moreover, Fabbrini et al[47] demonstrated distinct
differences in the response to weight gain in MNO and MAO subjects. In MAO subjects, but not MNO subjects, moderate weight gain exacerbated several metabolic risk factors for CVD, including increased blood pressure, plasma triglyceride levels, VLDL apoB100 concentrations, and VLDL apoB100 secretion rates, and decreased plasma adiponectin concentrations and insulin sensitivity in the liver, skeletal muscle, and adipose tissues. Weight gain also caused a greater absolute, but not relative, increase in intra hepatic triglyceride content in MAO subjects compared with that seen in MNO subjects. Together, these data suggest that increased adipose tissue capacity for lipogenesis helps protect against the adverse metabolic effects of weight gain.
In general, metabolic disorders are associated more strongly with visceral adiposity, rather than with subcutaneous adiposity; also, the anatomic location of VAT means that fatty acids are released directly into the portal circulation and fat accumulation in the liver has been shown to be an important feature of the MS[220,221].
SARCOPENIC OBESITY
Sarcopenia is defined as a loss of muscle mass leading to muscle weakness, limited mobility, and increased susceptibility to injury; an understanding of the underlying causes of muscle loss is critical for the development of strategies and therapies to preserve muscle mass and function[222].
It is well known that muscle is a type of endocrine organ, and excess fat mass exerts harmful effects on vascular inflammation BMI can miscategorize a significant proportion of subjects who have lower muscle mass content and higher body fat levels as those having a same cardiovascular risk as healthy, non-obese subjects[17].