I
UNIVERSITÀ DEGLI STUDI DI CATANIA
Ph.D. in Materials Science XXVI Cycle
Ph.D. Thesis
Metal organic chemical vapor deposition of
multifuctionalperovskitic oxides: from giant K to
colossal magnetoresistance materials, from ionic
conductors to multiferroics.
Ph.D. Student: MARIA RITA CATALANO
Advisor:
Coordinator:
Prof. Graziella Malandrino
Prof. Maria Grazia Grimaldi
II
Contents
Introduction
1
Chapter 1 : Perovskites
4
1.1 The crystal structure of perovskite
4
1.2 Properties of perovskites
6
References
8
Chapter 2: Giant dielectric constant CaCu
3Ti
4O
12perovskite films
9
2.1 Growth of CCTO thin films on STO (100) substrates
11
2.1.1Thermal characterization of precursors and MOCVD growth
process
11
2.1.2 Structural and morphological characterization of CCTO thin
Films on SrTiO
3substrate
14
2.2 Deposition of CCTO thin films on LSNO(100) electrode
20
References
26
Chapter 3: Pr
1-xCa
xMnO
3perovskite thin films
28
3.1Pr
0.7Ca
0.3MnO
3thin films on STO(001) and
STO:Nb (001) substrates
33
3.1.1 Thermal properties of the precursors and MOCVD growth 33
3.1.2 Structural and morphological characterization
37
3.1.3 Magnetic characterization of PCMO thin film
42
References
43
Chapter 4: Ionic conductor perovskite oxides
45
4.1 Perovskite LaCoO
3thin films on single crystal substrates
46
III
4.1.2 Structural, compositional and morphological characterization 49
4.2 Perovskite BaCeO
3thin films
54
4.2.1 Thermal properties of the precursors and MOCVD growth
55
4.2.2 Structural and morphological characterization of BaCeO
3thin film
56
References
58
Chapter 5: Multiferroic perovskite BiFeO
3film
60
5.1 Undoped multiferroic BiFeO
3films
61
5.1.1 Thermal properties of the precursors and MOCVD growth 61
5.1.2 Piezoelectric and ferroelectric properties of the BiFeO
3films 65
5.2 BiFeO
3Films Doped in the A or B Sites
67
5.2.1 Thermal properties of precursors and MOCVD growth 67
References
76
Conclusion
72
Appendix: Experimental details
75
List of international publication
76
1
Introduction
Oxide materials have several applicative properties such as ionic and electronic conductors for solid oxide fuel cells, high temperature superconductivity, giant dielectric constant, colossal magneto-resistance, ferroelectricity, multiferroicity, and so on.
Among the oxide material, the perovskite structure class is one of the most commonly occurring and important in all fields of materials science. The interest in these compounds is due to its structure that offers an high degree of chemical flexibility which determines its electronic and magnetic properties. In fact, perovskite compounds exhibit a large and surprising variety of properties, including superconductivity, colossal magnetoresistance, ionic conductivity, piezoelectricity and ferroelectricity, and find several applications for electronic and photonic devices. The ideal perovskite ABX3have a cubic crystal structure
which consists of corner sharing [BX6] octahedral with the A cation occupying the 12-fold
coordination site formed in the middle of the cube formed by the eight such octahedra. The ideal cubic perovskite structure is not very common but, there are many different types of distortions which can occur from the ideal structure. These include tilting of the octahedra, displacements of the cations out of the centers of their coordination polyhedra, and distortions of the octahedra driven by electronic factors (i.e. Jahn-Teller distortions). Many of the physical properties of perovskites depend crucially on the details of these distortions, particularly the electronic, magnetic and dielectric properties which are so important for many of the applications of perovskite materials.
In this context, the following work discuss about some different perovskite materials such as calcium copper titanate CaCu3Ti4O12, bismuth ferrite BiFeO3, lanthanum cobaltite (LaCoO3),
barium ceriate (BaCeO3) and Ca-doped praseodymium manganites (Pr1-xCaxMnO3), which
possess interesting physical properties of scientific and technological interest.
CaCu3Ti4O12 has an impressive dielectric constant value of 105working at 1 MHz which
remains constant in the 100–600 K temperature range and slightly depends upon work frequency in the 102–105Hz range. In addition, CCTO does not show ferroelectric transition or relaxor behavior. The giant-k dielectric materials as CCTO can be used in high capacity density planar condensers used in integrated circuits for wireless communication.
The bismuth ferrite (BiFeO3) is a multiferroic material; it is probably the only material that is
both magnetic and ferroelectric at room temperature. It has many application from sensor electronics, spintronics, next-generation non-volatile memories and photovoltaic.
2
Lanthanum cobaltites (LaCoO3) have a large variety of magnetic, ferroelastic and electrical
properties, and are promising candidates as ionic conductors and surface catalysts.
Barium cerate BaCeO3 exhibits high proton conductivities and are attractive candidates for
application in electro catalysis and fuel cells. Nevertheless, BaCeO3 shows poor chemical
stability and tends to react with water vapor or CO2, generating insulating BaCO3 and hence
inducing breakage of devices and performance degradation. Chemical stability of BaCeO3 can
be improved by partial substitution of Ce with Yttrium, Samarium, Niobium and so on . Calcium-doped praseodymium manganites (Pr1-xCaxMnO3)have attracted great attention due
to their technologically important electrical, magnetic, and magnetoresistance properties. In particular, very attractive for future developments are the colossal magnetoresistance phenomenon around the ferromagnetic transition temperature (Tc), and the electric pulsed induced resistance (EPIR) effect. For this reason the manganite films have been proposed as active components in non-volatile magnetic random access memory, magnetoresistive read-head, semiconductor field effect transistors.
It is well known, that for many application, it is desirable to synthesize the above mentioned functional materials in the form of nanostructure thick and thin film. Furthermore, the magnetic and electronic properties of perovskite thin films closely depend upon the fabrication method, the growth conditions, and substrate lattice parameters. At the same time developing a “user friendly” and low cost route to this material in form of thin films represents a challenging goal. In fact, perovskite thin films deposited through an industrially transferable and scalable methodology, are necessary for introducing functional materials into electronic and magnetic devices.
In this work, suitable Metal Organic Chemical Vapor Deposition (MOCVD) approaches have been used to fabricate the above mentioned complex oxide thin films. Thin film deposition by MOCVD is of great and increasing interest of a wide number of materials ranging from metals to insulators, because of advantages such as composition control, high film densities, film uniformity, and potential matching to large wafer sizes. In all cases the appropriate conditions for the epitaxial growth have been found in order to improve the quality of the interface and special emphasis has been placed upon the importance of suitable precursors, deposition parameters and interfacial characterization. It is important to underline thatthe success of a process based on a chemical reaction depends critically on the availability of volatile, thermally stable precursors that exhibit high and constant vapour pressures, since poor performances affect the film properties. Therefore, an accurate knowledge of the physical properties and thermal behaviour of precursors is of fundamental relevance for the optimization of processes in the perspective of achieving uniform and reproducible film
3
growth. In regard to the thermal analysis of the compounds the characterization has been carried out through thermogravimetric experiments both under atmospheric and low pressures and differential scanning calorimetry (DSC). The physical-chemical behaviour of the films depends on the film structural characteristics, such as crystalline structure of the deposited phases, chemical composition, uniformity and eventual interactions among substrate and overlayer. Deposited films have been studied by X-ray diffraction (XRD) to determine the structural nature. Additional information regarding the epitaxial growth of thin film has been obtained using TEM (Transmission Electron Microscopy) and pole figure analysis. The film composition and purity have been assessed by energy dispersive x-ray analyses EDX and X ray photoelectron spectroscopy (XPS). XPS depth profiling has been used to determine the vertical homogeneity of the sample. Morphological properties of thin films have been investigated through field emission scanning electron microscopy (FESEM).In all cases the MOCVD routes have shown great flexibility and proven to be a really intriguing challenge for implementation on large scale processes that could be superior or, at least, complementary to other methodologies. The functional properties have been assessed using consolidated national and international.
In conclusion , the research activity has been carried out as follow:
- Synthesis of chemical precursors suitable for the MOCVD growth of the films; - Optimization of the MOCVD processes in order to determine the most critical
factors for a reproducible deposition of the functional perovskite of interest:CaCu3Ti4O12, BiFeO3, LaCoO3, BaCeO3, Pr1-xCaxMnO3;
- Accurate control of the composition and structural/morphological properties of deposited films;
- Rationalization of the relationship processing parameters/film properties; - Study of the functional properties of materials
4
Chapter 1 : Perovskites
The term perovskite indicates the class of compounds which have the same type of crystal structure as CaTiO3.It was used for the first time for CaTiO3in honour of its discoverer
Perovskii.
The perovskite crystal structure was first described by V.M. Goldschmidt in 1926,1 in his work on tolerance factors that represents a milestone on the exploration of the perovskite family of materials.2
Despite the simplicity of perovskite crystal structure, this family of materials shows an enormous variety of structural modifications and variants, that in turn infer several and important technological properties. Thus, they can be employed in several micro-electronics applications3,4such as memory elements or in microwave devices, in solid oxide fuel cells, such as electrolytes5 or cathodes6, in resistive and magnetic data storage7, in sensor electronics and spintronic devices.8,9These characteristicsmake the perovskite oxide probably the most studied family of oxides in the materials science.
1.1:The crystal structure of perovskite
The ideal perovskite-type structure ABO3(Fig.1.1.1),where A is the larger cation and B is the
smaller cation, is cubic with space groupPm3m. This structure consists of a three-dimensional
framework of corner-sharing BO6octahedra in which the A cations reside in the dodecahedral
sites surrounded by twelve oxygen anions. Only very few perovskites have this ideal symmetric cubic structure at room temperature, but many of them acquire this ideal structure at higher temperatures.
a) b)
FIG.1.1.1 Ideal cubic perovskite structure ABO3: (a) three dimensional net of corner sharing
5
Most perovskites are distorted and do not have the ideal cubic structure. Goldschimdt introduced the so-called “tolerance factor” (t)to indicate the “stability” of perovskite structures. The tolerance factor has been calculated [eq. (1)] taking into account the crystal ionic radii from Shannon10 with a six coordination
t = (RA + RO)/√2(RB + RO) eq. (1)
where RA, RB, and RO are the ionic radii of A ion , Bion and O2- ion in the crystal. Note that
to fit the structure correctly in the Goldschimdt perovskite classification, ionic radii values of ions six-coordinated have to be considered, even though this may not represent the correct coordination number in perovskite. In the ideal cubic crystal structure t = 1.If the A ion is smaller than the ideal value then t becomes smaller than 1. As a result the[BO6] octahedra will
tilt in order to fill the space. However, the cubic structure occurs if0.89 < t < 1.11,12Lower values of t will lower the symmetry of the system and hexagonal variants of the structure are stable. On the other hand, if t is larger than 1 due to a large A or a small B ion, a different structure is observed.
Goldschmidt underlined that the perovskite structure is stable only if the t parameter lies between 0.8 and 1. A deviation of t value from 1 indicates the likely formation of a distorted perovskite structure. The distortion is due to a rotation (tilt) of the oxygen octahedral (Fig.1.2). The various structures that are formed depend on both the magnitude and the relative rotation of the octahedra around the crystallographic axes.
FIG.1.1.2 Rotation (tilt) of the oxygen octahedral [BO6]
Further importantfactors, that are responsible for the distortion, is the changing in the composition from the ideal ABO3. The perovskite structure is known to be very flexible
6
A and B positions, leading to the large number of known compounds with perovskite or related structures.
These complex perovskites have A1-A′xBO3, AB1-yB′yO3or A1-A′xB1-yB′yO3formulas. The A′
and B′ are termed dopant species. The insertion of a dopant specie may modify some properties depending on the doping fraction x or y.
In some perovskites, the distortion of the structure can be assigned to Jahn–Teller effect active ions at the B position. For example in the perovskite manganites, with the general formula AMnO3, where the nominal electronic configurations of Mn3+ ion is 3d4 and it contains four d
electrons, the 3d4 electrons divide up into 3 t2g and 1 eg electron. The odd number of electrons
in the eg orbital causes an elongation of the [MnO6] octahedron. Therefore, according to the
Jahn-Teller theorem the Mn3+O6 groups are energetically unstable towards distortions aiming
to reduce the total energy of the system, as a consequence of a lifting of degeneracy of the eg
levels.
1.2 Properties of perovskites
The functional properties of perovskites, discovered over 50 years ago, have been widely discussed in several review.13-15As already mentioned, the structural properties of perovskite materials lead to a huge range of innovative properties, such as ferromagnetism, colossal magnetoresistance, piezoelectricity, ferroelectricity, multiferroicity, metal-insulator transitions, superconductivity, ionic and electronic conductivity. One reason for this is that nearly all cubic perovskites are unstable to energy-lowering structural distortions16 and hence typically have rich structural phase diagrams.
This variety of electronic and magnetic properties is not only due to their chemical flexibility, but also to the complex character that transition metal ions play in certain oxygen coordination architectures.17The magnetic and electronic correlations are usually due to unfilled 3d electron shells of the transition metal, while dielectric properties are connected with filled 3d electron shells.
Exchange interactions are the main phenomenon at the base of magnetic properties. In the ideal cubic perovskite structure, each oxygen is shared by two B3+ions,forming a B-O-B angle of 180°. Such a configuration is favorable for superexchange interactions between magnetic B3+cations. This exchange usually results in antiparallel coupling of nearest-neighbor magnetic moments. When the B3+ ions are in two sublattices (A2BB'O6) other spin
7
If B' is a diamagnetic ion, the B3+ ions are aligned antiferromagnetically, and the most important exchange mechanism is believed to be a longer range superexchange interaction through two oxygens of the type B-O-B'-O-B.
In regards to the electrical properties, the perovskites can act as metals, semiconductor, superconductors, and dielectrics. The electrical behavior in perovskites depends on the outer most electrons, which may be localized at specific atomic sites or may be collective. For example in LnMnO3perovskitethe charge carriers, would be holes, hopping among localized
levels, and lead to an abrupt change in conductivity and in magnetic susceptibility as a function of temperature.
Another important aspect that influences the physical properties is the non-stoichiometry.18,19 In order to maintain the electroneutrality (the sum of charges of A and B equals the total charge of oxygen anions)an appropriate charge distribution of the form A1+B5+O3,A2+B4+O3,
or A3+B3+O3 occurs in perovskite. However, deficiencies of cations at the A- or B-sites or of
oxygen anions are frequent, which results in defective perovskites. Oxygen deficiency is more common than those involving cationic vacancies.
The former composition can be considered as an anion-deficient perovskite with one-sixth of the oxygen ions being vacant. Oxygen vacancies are ordered in alternate (001) BO2planes of
the cubic structure such that alternate [110] rows of oxide anions are missing.
Thereby, the properties and phase diagrams of a perovskite strongly depend on non-stoichiometries and even more on tilting or distortions of the [BO6] octahedra.
8
References
1V. M. Goldschimdt, Akad. Oslo. J. Mat. Natur. 2 (1926) 7. 2 A.S. Bhalla, R. Guo, R. Roy ,Mat. Res. Innovat. 4 (2000)3-26 3 R. Ramesh, D.G. Scholm, J. Solid State Chem. 33 (2008) 1006.
4C .K. Campell, J.D. Van Wyk, P. Wolmarans, IEEE Trans. Compon. Packag. Technol.27 (2004) 311
5E. Fabbri, D. Pergolesi, E.TraversaChem. Soc. Rev.,2010,39, 4355–4369
6 A. Yu Zuev, V. V. Sereda, D. S. Tsvetkov, J. Electrochem. Soc. 159 (2012) F594 7Murakami Y, Kasai H, Kim J J, Mamishin S, ShindoD,Mori S, Tonomura A , Nature Nanotechnol. 5(2010) 37Y
8 N. A. Spaldin, S.-W. Cheong, R. Ramesh, Physics Today 63 (2010) 38
9T. Choi, S. Lee, Y. J. Choi, V. Kiryukhin, S. W. Cheong, Science324 (2009)63-66 10R. D. Shannon, ActaCrystallogr. Sect. A 32 (1976) 751.
11 A.F. Wells, Structural Inorganic Chemsitry, Oxford Science publications.(1995) 12U. Müller, Inorganic Structural Chemistry, Wiley &SonsLtd.(1993).
13 M. A. Pena˜, J. L. G. Fierro Chem. Rev. 101 (2001) 1981−201 14 N.,Nurxat; S. KaiNanoscale5(19)(2013) 8752-8780.
15Benedek N. A.; Fennie C. J, Condensed Matter (2013) 1-12
16Rabe, K. M.; Ph: Ghosez, Physics of Ferroelectrics: A Modern Perspective; Springer-Verlag, (2007).
17P. Lemmens and P. Millet, Spin – Orbit – Topology, a triptych, in “Quantum Magnetism”, Springer, Heidelberg, (2004).
18Rao, C. N. R.; Gopalakrishnan, J.; Vidyasagar, K. Indian J.Chem. Sect. A 1984, 23A, 265. 19Smyth, D. M. Annu. Rev. Mater. Sci. 15(1985) 329.
9
Chapter 2: Giant dielectric constant CaCu
3Ti
4O
12perovskite films
In the last years, the technological development and the increasing request for new miniaturized electronic devices has focused the attention on the search of new innovative and more performant materials. In fact, the performance of these electronic devices should progress very rapidly and their technological improvement requires higher speed and lower power consuming. In order to have better performances, one of the most popular method is the downsizing of components. In this respect, the development of new techniques for the synthesis of thin films has allowed the application and integration of new multifunctional oxides in complex multilayer devices1.
Dielectric thin films are among the most required materials for this kind of devices and in particular for fabricating capacitors.
Dielectric materials are electrical insulator and their main characteristics are: i) high dielectric strength (must support high voltages without degrading or become electrical conductors) and ii) low dielectric loss (under alternating electric field there should be no loss of electrical energy).
Dielectric material can be polarized by an applied electric field. When a dielectric is placed in an electric field, electric charges do not flow through the material as they do in a conductor, but only slightly shift from their average equilibrium positions causing dielectric polarization. Because of dielectric polarization, positive charges are displaced toward the field and negative charges shift in the opposite direction. This creates an internal electric field that reduces the overall field within the dielectric itself. The dielectric constant is closely related to the polarization: electronic polarization, dipolar polarization, ionic polarization and space charge polarization. In the last years, materials with high dielectric constants (ε) have received ever-increasing attention for their wide use in technological applications, such as capacitors and memory devices. In particular, capacitor applications require highly insulating materials and the increasing of smaller and faster microelectronics devices is associated with similarly higher values. In an attempt to miniaturize device size, much attention has been devoted to discover materials with high relative permittivity, low dielectric loss and low-temperature coefficient of the permittivity. In particular, capacitor applications need high permittivity materials having also great structural stability. A large ε is based on collective polar displacements of the metal ions with respect to the oxygen sublattice and is a highly nonlinear and anisotropic phenomena.
10
Several studies on the perovskite related calcium copper titanate, CaCu3Ti4O12 (CCTO), have
demonstrated that this material presents the so-called giant dielectric permittivity, having an impressive dielectric constant value of 105 working at 1 MHz, which remains constant in the 100-600 K temperature range and depends slightly on work frequency in the 102-105Hz range.2-4In addition, CCTO does not show ferroelectric transition or relaxor behavior. These intriguing properties render the CCTO material a real attractive alternative to the currently used ferroelectrics which in turn possess lower dielectric constant values having a stronger temperature dependence. A number of theoretical studies and experimental observations have attempted to elucidate this remarkable dielectric property.5 - 7The most widely accepted mechanism for the giant dielectric constant in CCTO ceramics is the internal barrier layer capacitor (IBLC) model invoking semiconducting grains and insulating grain boundaries.8-12 These studies indicated that the huge dielectric constant is probably not an intrinsic property, but could be due to some extrinsic phenomenon. Some theories, on the other hand, correlate the CCTO high ε value to its peculiar crystal structure,13 in particular high permittivity may arise from the local dipole moments associated with off-center displacement of Ti ions. Until now, however, most of the experiments carried out have been on ceramic bulk materials, and only rarely have been reported data on the properties of CCTO thin films14. A decrease of the dielectric constant value is expected when moving from bulk to films, and some differences could be observed between epitaxial and polycrystalline thin films, which are characterized by the presence of many grain boundaries.
In order to choose substrates best suited for an epitaxial growth of the CCTO phase, the structural characteristics of this perovskite phase is reported in the following.
The CCTO compound belongs to the family of mixed oxides ACu3TiO12 synthesized for the
first time in the 1967.15 The crystal structure (Fig 2.1) of CCTO is a body-centered cubic system with four ATiO3 perovskite-type formula per primitive cell (where A is either
Ca or Cu).16The unit cell of CCTO has a lattice parameter of 7.405 Å at room temperature. The Ti atoms are octahedrally coordinated with the octahedra rotated the same amount around the [100], [010], and [001] axes. The tilt is fairly large causing 3/4 of the A atoms, i.e., the Cu atoms, to be four-coordinated with the four oxygen atoms forming a square with a Cu atom at its center. The distance from the Cu atom to each of the four surrounding oxygen atoms is 1.98 Å. The remaining A atoms, i.e., the Ca atoms have a bcc arrangement, and each is surrounded by 12 oxygen atoms at a distance of 2.61 Å.
11
FIG.2.1 Crystal structure of CCTO
CCTO thin films have been epitaxially grown on various substrates by Pulsed Laser Deposition (PLD)17-19and by Metal-Organic Chemical Vapor Deposition (MOCVD).20-22 MOCVD growth takes advantage of simpler, less costly equipment, ready scalability, and higher throughput as compared to conventional physical vapor deposition techniques.
Previously, CCTO thin films have been deposited by MOCVD approach, using an innovative, single, molten multimetal source on conventional LaAlO3 (001) substrate23 and on
and IrO2/Ir/TiO2/SiO2/S24technological substrates; the structural, the compositional and
optical investigations of these epitaxial film pointed out to the formation of high quality CCTO materials.
In the present work, CCTO thin films were obtained by MOCVD technique, on oriented SrTiO3 (STO) (001) substrates, in order to grow CCTO material in the form of epitaxial
films,25 and on conductive oxide electrodes, the La0.9Sr1.1NiO4/LaAlO3 (LSNO/LAO) stack.26
2.1 Growth of CCTO thin films on STO (100) substrates
2.1.1Thermal characterization of precursors and MOCVD growth process
The growth of epitaxial oxides is always a challenging aim, depending on the lattice mismatch and chemical complexity of the perovskites. The present MOCVD process for the fabrication of CCTO thin films relies upon a “unique” approach based on the use of a molten multi-component precursor source consisting of a 1:1:3 mixture of Ti(tmhd)2(O-iPr)2,
Ca(hfa)2·tetraglyme27 and Cu(tmhd)2precursors. The MOCVD apparatus is a horizontal
hot-wall reactor (Fig. 2.1.1). The volatile source mixture was loaded in a resistively heated alumina boat at 115°C and was transported through the reactor with an argon flow rate of 150 sccm in the presence of a 200 sccm oxygen reaction.
12
Fig. 2.1.1.1 MOCVD horizontal hot-wall reactor
The comparative study of the multi-component Ca:Cu:Ti mixture has been performed by TG and DSC measurements. The dynamic TG (Fig.2.1.1.2a), under reduced pressure (20 Torr) and atmospheric pressure, curves indicated that the sublimation/evaporation for the mixture occurs in a single step with low residues (≤1%) at 450 °C. Moreover, isothermal TG analyses in the 90–140 °C (Fig.2.1.1.2b) under reduced pressure (20 Torr), showed a linear behavior for each single precursor in the entire investigated temperature range, while the precursor mixture shows a non linear behavior at temperatures higher than 120 °C, thus suggesting that contributions of individual precursors may prevail giving rise to differential vaporization rates. However, at temperatures higher than 100 °C the precursor mixture possesses a high volatility and, therefore, it can be safely used up to 120 °C.
Fig.2.1.1.2 TG curves (a) and isothermal curves (b) of the multicomponent Ti(tmhd)2(O-iPr)2,
Ca(hfa)2•tetraglyme Cu(tmhd)2
0 10 20 30 40 50 60 70 0 50 100 Time (min) m ( % ) 90°C 100°C 110°C 120°C 130°C 140°C
b)
50 100 150 200 250 300 350 400 450 100 50 0 Mixture W eig h tlo ss (% ) Temperature (°C) 20 torr 760 torr a)13
Other useful information has been obtained from calorimetric data (Fig. 2.1.1.3). Calcium and copper precursors show two endothermic DSC peaks due to melting (94.0 °C and 198.6 °C, respectively) and two endothermic peaks due to evaporation from melts (200–280 °C and 220–250 °C). The DSC curve (Fig.2.1.1.3) for the Ti precursor shows two peaks associated with two crystal change structure at 60 °C and at 164 °C, while the higher temperature peaks at 205 °C and 244 °C are related to melting and evaporation, respectively.28 The molten Ca:Cu:Ti mixture shows a small temperature peak (60°C) associated with the first structure change of the Ti(tmhd)2(O-iPr)2 component and an higher temperature peak at 88.7°C
associated with the Ca(hfa)2·tetraglyme melting. Some small features in the 120–175 °C range
may be related to dissolution of Ti and Cu components. Finally a broad endothermic peak in the 180–240 °C temperature range is associated with the mixture vaporization from melt. Note that, the endothermic peaks expected for the Cu(tmhd)2 and Ti(tmhd)2(O-iPr)2 melting
are not observed. Therefore, the Ca(hfa)2·tetraglyme precursor acts, on melting, as a solvent
for the Ti and Cu sources and forms a homogenous mixture of the three precursors. These results show that the Ca:Cu:Ti mixture can be used as a single multi component precursor since it allows a stable evaporation from the melt with a vaporization rate that remains constant during the vaporization time up to 120 °C.
Fig.2.1.1.3 DSC curve (a) of the multi component Ti(tmhd)2(O-iPr)2, Ca(hfa)2•tetraglyme
Cu(tmhd)2
CCTO films have been deposited using the present mixture by two different MOCVD processes; a two-step, in situ process (Fig.2.1.4a ), and a single-step process (Fig2.1.4b).24, 29 , 30The two-step in-situ process consists of the deposition of an almost amorphous matrix and the subsequent in-situ annealing. In particular, the first deposition step
14
was carried out at 600° C, while the second, in-situ annealing step was performed at 900° C The single-step approach was based on the direct deposition of the CCTO film at 750 ° C.
Fig.2.1.1.4 MOCVD a two-step in situ process (a), and a single-step process(b)
2.1.2 Structural and morphological characterization of CCTO thin Films on SrTiO3
substrate.
First attempts on STO substrates were carried out using the two-step, in-situ process. The XRD pattern (Fig.2.1.2.1a) of the deposited films shows the formation of two different compounds, namely CCTO and CaTiO3 (CTO). In fact, the peaks at 23.30° and 47.62° can be
related to the 001 and 002 reflections of the CTO phase, while the peak visible at 49.52° corresponds to the 004 CCTO reflection. Thus, the principal peaks can be related to the formation of oriented (001) CTO films and only one peak of lower intensity corresponds to the CCTO phase. While the peaks at 22.78° and 46.48 ° are due to the STO substrate contribution with 001 and 002 reflections respectively.
The preferential formation of the CaTiO3 phase can be explained on the basis of the larger
lattice mismatch (≈6%) between CCTO and SrTiO3 than that between CaTiO3 and the SrTiO3
substrate (0.4%). The film is characterized by quite rounded grains, about 150 nm wide (Fig.2.1.2.1b), homogeneously distributed.
15 20 30 40 50 60 0 200 400 600 800 1000 C C T O (0 04 ) C aT iO 3 (0 02 ) C aT iO3 (0 01 ) S T O (0 02 ) S T O (0 01 ) In te ns it y (c ps ) 2 degrees a)
Fig .2.1.2.1a) XRD pattern and b) FE-SEM image of a film deposited on SrTiO3 substrate by the
two-step in-situ MOCVD process.
To understand what happens during the two step MOCVD process, the structure and the morphology of film, after the first deposition step at 600°C, was studied. The XRD characterization of CCTO films deposited at 600°C consist of a quite amorphous matrix; in fact the XRD pattern recorded using the Bragg-Brentano Ɵ-2Ɵ configuration shows only those peaks due to the substrate, while the XRD analysis in grazing incidence mode (Fig. 2.1.2.2) shows broad low-intensity peaks due to the formation of the CuO phase. Thus films deposited at 600 °C can be considered a roughly amorphous matrix of Ca-Cu-Ti oxide. The FE-SEM investigation (Fig. 2.2.2b) shows nanocrystalline and not well-defined aggregations of grains. Finally, to evaluate the composition of both the deposited (600°C) and annealed (900°C) films energy dispersive X-ray (EDX) analyses have been carried out on films deposited on Pt substrate simultaneously to those obtained on perovskite substrates. The use of platinum is required because of the overlap between Ti signals from the film and the substrates. EDX spectra indicated that the 1:1:3 Ca:Cu:Ti ratio in the precursor mixture results in a 1.1:2.7:3.9 Ca:Cu:Ti ratio in both the amorphous matrix and in the CCTO/CTO mixture thin films. Best results were obtained using one step process at 750°C .
The single step depositions have not been carried out at 900°C, because at this temperature CCTO films poor in copper are obtained, whatever the stoichiometric ratio of the precursor mixture. This is likely due to the decomposition at high deposition temperatures of the Cu(tmhd)2 precursor on the reactor walls before reaching the substrate surface. In the case of
single step deposition at 750°C to obtain the correct stoichiometry in the film it has been necessary to change the initial 1:1:3 Ca/Cu/Ti precursor mixture.
16
Fig.2.1.2.2 a) XRD pattern and b) FE-SEM image of the film deposited on SrTiO3
substrates at 600°C.
In fact, EDX analysis, carried out on films deposited at 750°C simultaneously on a Pt substrate, showed that Ca/Cu/Ti precursor mixture ratio of 1:1.3:3.2 provides a nearly correct stoichiometry (1.0:3.2:4.2 Ca/Cu/Ti) in the film. The new operative parameters, deposition temperature and stoichiometry of the precursors in the mixture, lead to pure epitaxial CCTO film. In fact, the XRD (fig. 2.1.2.3a) pattern of thin films shows the presence of the unique peak at 2Ɵ=49.54°, that indicates that only CCTO <001> oriented film has been formed. To study the epitaxial grow of the CCTO film on the STO substrate, ɸ-scans on a four-circle X-ray diffractometer have been carried out. The measurements on the (001)-oriented CCTO film and the STO substrate have been carried out consecutively in order to establish the in-plane relationship of the CCTO film with respect to the underlying STO substrate. In the ɸ-scans (from 0 to 180°) the CCTO (220) reflection (2Ɵ=16.90°) and STO (110) reflection (2Ɵ=32.38°), both at tilt angles of 45°, have been used as poles. The expected two peaks due to CCTO{110} planes are perfectly coincident with STO {110} ɸ positions (Fig2.1.2.3 b). This clearly demonstrates that the CCTO unit cell is not rotated in the plane with respect to the STO substrate, for example the [100] and [010] axis directions are aligned for both the film and the substrate. The mean full width at half maximum(FWHM) of the CCTO ɸ peaks is 3.78° indicating a good degree of epitaxy.
20 30 40 50 60 10 20 30 40 CuO (111) CuO (-111)
(a)
Inte nsi ty (cps ) 2 degrees17 20 30 40 50 60 0 2000 4000 6000 8000 10000 12000 14000 (a) CCT O (004) ST O (002) ST O (001) In te n si ty (c p s) 2degrees
Fig.2.1.2.3 a) XRD pattern and b) ɸ-scan measurements of a CCTO film and the SrTiO3 substrate.
The FE-SEM in plane (Fig.2.1.2.4a) and the cross section (Fig 2.1.2.4b) images show the formation of a continuous CCTO film consisting of quite square grains, well-ordered in the plane. The lateral size of each grain is about 200nm.
Fig.2.1.2.4 a) FE-SEM images of the surface morphology, and b) of the cross-section of the CCTO film deposited on SrTiO3 substrates at 750°C.
To confirm the epitaxial growth of the CCTO film transmission electron microscopy (TEM) analysis have been carried out. The bright-field cross-section TEM image (Fig.2.1.2.5a) shows a homogeneous film thickness of 220 nm. The calculated growth rate is 3.7 nm min
-1and it is comparable to that found for the two-step process (growth rate=3.3 nm min-1). The
high-resolution (HR)TEM image (Fig. 2.1.2.5b) shows a quite sharp film/substrate interface which indicates that no chemical interaction occurred. Figures 2.1.2.5 c and 2.12.5 d show the selected-area electron diffraction (SAED) patterns of the substrate and of the CCTO film observed with an incident electron beam perpendicular to the sample section. The cross-section SAED pattern, taken in an area covering both the substrate and the film, is a simple
18
superposition of the CCTO film and STO substrate spots. The obtained SAED pattern reveals a perfect c-axis alignment and confirms that the CCTO films grow epitaxially.
Fig.2.1.2.5 a) Low-magnitude, bright-field image of the cross-section CCTO film/SrTiO3 substrate.
b)HRTEM image of the CCTO/SrTiO3 interface. c) SAED patterns of the (001) SrTiO3 substrate
and d) of the CCTO/SrTiO3.
Insights into the composition of deposited films have been provided using EF-TEM chemical maps of the CCTO film obtained at 750°C. The zero loss-energy image (Fig.2.1.2.6) shows the presence of some crystalline and distorted grains embedded in the well-oriented CCTO film. The chemical nature of these distorted grains has been determined by the chemical maps of each CCTO component. By comparison of the Ca, Cu, and Ti signal intensities it can be concluded that the crystalline grains likely consist of copper oxide grains. In fact, the intensity of the copper signal increases in correspondence with crystalline grains. On the other hand, Ti and Ca signals are well-distributed all over the matrix. The presence of the CuO phase was not detected by XRD measurements, probably because of the quite low concentration.
19
Fig.2.1.2.6 Chemical maps of a CCTO film deposited at 750°C performed by EF-TEM.
In summary , the deposition conditions for the formation of pure CCTO on SrTiO3 (100)
substrates have been optimized: the two-step procedure provided no pure CCTO phase growth, while the single-step process at 750 °C produced pure and (001) oriented film. Kinetic and thermodynamic factors determine the obtainment of the pure CCTO films. In fact, in the two-step growth, a kinetic contribution further supported by the favorable lattice match determines the stability of the CTO phase. Both CCTO and CTO phases, as well as the SrTiO3 substrate material, are perovskite-type complex oxides. There is a competition
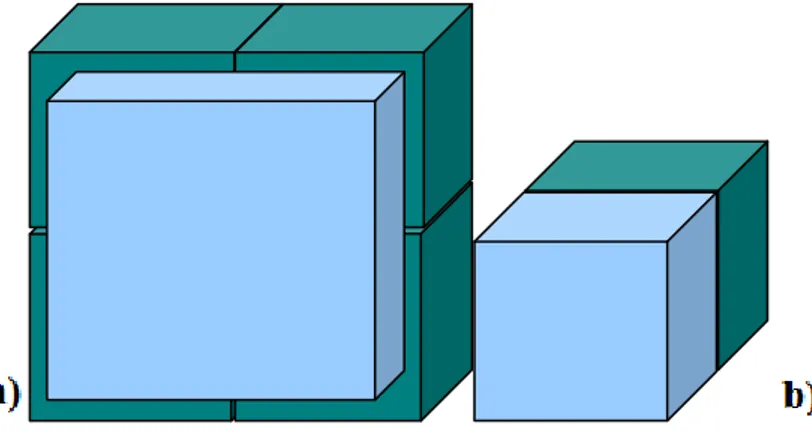
between CCTO and CTO based on lattice match between deposited phases and substrate. Considering a typical cube-on-cube growth of (00l)-textured CCTO films on a SrTiO3
substrate (a = 3.905 Å), one CCTO unit cell will match four SrTiO3 (001) unit cells
(fig.2.1.2.7 a, b). There is, therefore, indication of a 5.3% lattice mismatch, while the CTO phase has a lattice parameter of a=3.823 A˚ and a mismatch of 2.1% with respect to the SrTiO3 substrate. Thus, based only on the mismatch between CCTO and CTO with the STO
substrate, the growth of CTO should occur independently on the growth process, while in the one-step growth, thermodynamic factors prevail: CCTO is thermodynamically more stable than the CTO phase.31,32
20
To confirm these consideration, a new experiment has been performed by annealing, at 900°C, the CCTO film obtained at 750°C. The XRD pattern and FE-SEM images (Figs. 2.1.2.8 a, b), recorded after annealing, show that neither structural nor morphological modifications of the CCTO film occurred; this experiment confirmed that the CCTO film is very stable at 900°C.
Fig. 2.1.2.7 Growth model of a) CCTO and b) CTO on SrTiO3 substrate.
20 30 40 50 60 0 5000 10000 15000 20000 C C T O ( 00 4) S rT iO3( 00 1) S rT iO3( 00 2) in te ns it y (c ps ) 2 degrees a)
Figs. 2.1.2.8:a) XRD pattern and b) FE-SEM image of a CCTO film annealed at 900°C after deposition on SrTiO3 substrate by the single-step process (750°C).
2.2 Deposition of CCTO thin films on LSNO(100) electrode
In order to build capacitor devices, it is of course required to fabricate bottom and top electrodes. In particular, the growth of oriented CCTO thin films will need the availability of a bottom electrode, stable at high deposition temperature and able to promote its epitaxial growth. These requirements could be best met by oxide electrodes having structures similar to perovskites. The La0.9Sr1.1NiO4 (LSNO) has all the described requirements. LSNO structure
21
and cell parameters are compatible with LAO and CCTO, the lattice mismatches being 0.8% and 3% to LAO and CCTO, respectively. Furthermore, it has been shown that LSNO grows epitaxially on LAO.33Depositions of CCTO thin films on LSNO electrode have been also carried out by a single step MOCVD approach at 750°C. The diffraction pattern (Fig. 2.2.1) consists of peaks at 2Ɵ =23.46° and 47.95° which have been related to the (001) and (002) reflections from the oriented LAO substrate, the peak at 2 Ɵ = 49.52° has been associated with the (004) reflection of the CCTO phase, and finally peaks are visible at 2 Ɵ = 30.83° and 64.39°, that cannot be assigned either to CCTO or to LSNO phase. Assignment of these peaks is not an easy task , but the second peak (64.39°) certainly represents the higher order reflection (00nl) of the peak at 30.83° (00l). Moreover, note that all the peaks related to the (00l) reflections of the LSNO , previously observed, are not present.
FIG.2.2.1 XRD pattern of a film deposited on LSNO substrate
FE-SEM and TEM investigations have been performed to obtain morphological details of the deposited film. The FE-SEM image shows the formation of a uniform CCTO (Fig. 2.2.2a) film with grains about 100 nm wide. The bright-field cross-section TEM image of a CCTO film deposited on LSNO/LAO stack show ( Fig. 2.2.2b) the growth of a quite homogeneous film with a thickness value of about 200 nm. Moreover, an interesting detail is a ~50 nm thick layer, visible at the CCTO/LSNO interface, showing the same morphological aspect but a slightly darker contrast. The chemical composition of the CCTO film has been evaluated by EDX analysis, on a sample deposited on Pt electrode simultaneously to that deposited on LSNO/LAO(001) substrate. The use of Pt electrode is required because of the overlap between Ti K signals and La L signals from the substrate. EDX analysis indicated that a nearly perfect stoichiometry of CCTO films have been obtained using the present MOCVD process.
22
To evaluate if any interaction occurred in the CCTO/LSNO interface, the EF-TEM chemical maps (Fig.2.2.3) have been collected for all the components, Ca, Cu and Ti, of the deposited film and for La from the electrode and substrate. The Ni and Sr maps have not been recorded because of the overlap between the first window used for the Ni and Sr maps with the La M edge. This overlap causes an erroneous calculation of the background so that the Ni and Sr maps would not be correct. As evident in fig.2.2.3 elements, Ca, Cu and Ti of the CCTO film are well uniformly distributed, within the CCTO film; at the interface, Cu containing grains are visible, while the intensity of the titanium signal points out to the formation of a titanium containing layer reaching the CuO grains (as deducted by the Fast Fourier Transform (FFT) of their high resolution TEM image). By measurements the thicknesses in the Ca, Cu, Ti and La maps, it can be concluded that the stack is formed by: i) a 190 nm thick film containing Ca, Cu and Ti elements; ii) a 50 nm layer containing Ti plus CuO grains; iii) the LSNO electrode with a thickness, after the deposition, reduced to 75 nm.
FIG.2.2.2 a) FE-SEM and b) TEM images of a film deposited on LSNO substrate.
FIG.2.2.3 Chemical maps collected at the CCTO/LSNO interface by energy-filtered transmission electron microscopy
23
Detailed analyses of the LSNO electrode after the deposition, shown in Fig. 2.2.4, have been carried out through high resolution TEM (HR-TEM) investigation. The single crystal nature of the LAO substrate is evident, while many defects are present in the LNO electrode as pointed by the lighter and darker zones visible in the HRTEM image. The FFT of the HR-TEM image from both LAO substrate and the LSNO electrode demonstrated that the direction related to the 2.89 Å LSNO plane distance is parallel to the (001) LAO direction. The plane distance measured for the FFT of the LSNO corresponds to the unknown reflection (2θ= 30.83°) observed in the post deposition XRD pattern. Thus, also during the MOCVD process the crystalline quality of LSNO layer is degraded.
FIG. 2.2.4 High resolution TEM image and SAED patterns of the LSNO/LAO interface after the MOCVD process
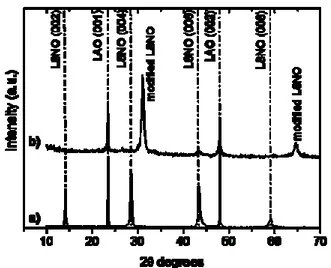
In order to confirm this hypothesis, a new experiment has been designed. An annealing of the plain LSNO/LAO stack has been carried out under identical MOCVD operating conditions used for the CCTO film deposition. In Fig. 2.2.5 the XRD pattern of the annealed sample is compared with the pattern of the LSNO electrode. The presence of the peaks at 2θ= 30.83° and 64.39° is a definitive confirmation that the structural change is due to the MOCVD deposition conditions and cannot be related to a chemical interaction with the CCTO films.
24
Fig. 2.2.5 XRD patterns of the LSNO/LAO stack before (a) and after (b) the annealing in the same conditions used during the MOCVD process.
The investigation of the structural modification of the LSNO electrode has been carried out by collecting several electron diffraction (Fig.2.2.6) along different zone axes. By comparison of the collected plane distance values and the expected ones, it might be concluded that the LSNO system did not change the tetragonal lattice cell in another lattice system. It is possible to hypothesize only the change in the orientation [110] of the LSNO electrode. However a simple variation of the LSNO parameter cell could be supported by the shift of all the LSNO (00l) diffraction peaks, and cannot justify the disappearance of most of them. Moreover, in each electron diffraction image, two patterns can be distinguished: the main one related to the LSNO and a second less intense pattern. The plane distances of the second pattern can be safely attributed to the NiO phase, which showed to possess the [100]NiO//[110]LSNO structural relation. Thus, the LSNO modification is not due to interaction with titanium, while it is likely due to a structural change. Some studies on the stability of the LSNO ceramic34,35 show that the main causes of the LSNO instability are temperature higher than 700°C and high oxygen partial pressure.
In this context, it should be noted that the deposition of complex perovskite oxide by MOCVD always requires the use of high deposition temperature and high oxygen partial pressures. Finally, electrical measurement on deposited films showed a partially conducting behaviour, probably because of the large degradation of the LSNO electrode, while indirect measurements carried out on films deposited using the same MOCVD experimental conditions on the bare LAO substrate showed good dielectrical properties.36
25
26
References
1 Lo Nigro R.; Fiorenza P.; Catalano M. R.; Fisichella G.; Roccaforte F.; Malandrino G. . Surface and Coatings Technology 230(2013) 152-162.
2 M. A. Subramanian; Li, D. Duan, N. Reisner, B. A. Sleight, A.W.J. Solid State 151Chem.(2000), 323.
3 A. P Ramirez; M. A. Subramanian; M. Gradel;, G Blumberg; T Vogt , S. M Shapiro,.Solid State Commun 115(2000) 217.
4 C. C. Homes,T Vogt,S. M.Shapiro, S.Wakimoto, A. P Ramirez,.Science, 293 (2001), 673. 5 S. Chung, I.D. Kim, S.J.L. Kang, Nature Mater. 3 (2004) 774.
6 L. He, J.B. Neaton, D. Wanderbilt, M.H. Cohen, Phys. Rev., B 67 (2003) 012103.
7 C.C. Homes, T. Vogt, S.M. Shapiro, S. Wakimoto, M.A. Subramanian, A.P. Ramirez, Phys. Rev., B 67 (2003) 092106.
8 T. B. Adams, D. C. Sinclair, A. R. West, Adv. Mater14(2002) 1321 9 T. B. Adams, D. C. Sinclair, A. R. West, Phys. Rev. B 73(2006) 094124.
10M. C. Ferrarelli, D. C. Sinclair, A. R. West, H. A. Dabkowska, A. Dabkowski, G. M. Luke,J. Mater. Chem19 (2009) 5916.
11P. Fiorenza, R. Lo Nigro, C. Bongiorno, V. Raineri, M. C. Ferarrelli, D. C. Sinclair, A. R. West,Appl. Phys. Lett.92 (2008) 182907
12 P. Fiorenza, V. Raineri, M. C. Ferarrelli, D. C. Sinclair, R. Lo Nigro,Nanoscale 3 (2011) 1171
13. J.B He, M.H. Neaton, D. Cohen, , C.C. Vanderbilt,Homes, Phys. Rev. B 65 (2002) 214112
14Felix, A. A.; Rupp, J. L. M.; Varela, J. A.; Orlandi, M. O. J. of Appl. Physi. 112(5), (2012) 054512/1-054512/7.
15A. Deschanvres, B.Raveau, F. Tollemer, Bull.Soc.Chim.Fr., (1967) 4077
16 B. Bochu, M.N. Deschizeaux, J.C. Joubert, A. Collomb, J. Chevanas, M. Marezio, J.Solid State Chem. 29 (1979) 291
17 Y. Lin, Y.B. Chen, T. Garret, S.W. Liu, C.L. Chen, L. Chen, R.P. Bontechev, A. Jacob-son, J.C. Jiang, E.I. Meletis, J. Horwits, H.D. Wu, Appl. Phys. Lett. 81 (2002) 631.
18 W. Si, E.M. Cruz, P.D. Johnson, P.W. Barnes, P. Woodward, A.P. Ramirez, Appl. Phys. Lett. 81 (2002) 2056
19 L. Chen, C.L. Chen, Y. Lin, Y.B. Chen, X.H. Chen, R.P. Bontchev, C.Y. Park, A. Jacobson, Appl. Phys. Lett. 82 (2003) 2317.
27
20 R. Lo Nigro, R. Toro, G. Malandrino, M. Bettinelli, A. Speghini, I.L. Fragalà, Adv.Mater. 16 (2004) 891
21R. Lo Nigro, G. Malandrino, R.G. Toro, M. Losurdo, G. Bruno, I.L. Fragalà, J. Am. Chem. Soc. 127 (2005) 13772
22 R. Lo Nigro, R.G. Toro, G. Malandrino, I.L. Fragalà, M. Losurdo, M.M. Giangregorio, G. Bruno, V. Raineri, P. Fiorenza, J. Phys. Chem. B 110 (2006) 17460 23 P. Fiorenza,R. Lo Nigro,A. Sciuto, P. Delugas, V. Raineri, R. G. Toro, M. R. Catalano,G. Malandrino J. OF APPL. PHYS, 05 (2009) 061634
24 Patrick Fiorenza, Raffaella Lo Nigro, Vito Raineri, Graziella Malandrino, Roberta G. Toro,Maria R. Catalano, J.ofAppl. Phys.108( 2010) 074103
25 M.R Catalano; G.Malandrino; R. G Toro,R.LoNigroChem. Vap. Depos (2012), 18(1-23), 76-82
26 Maria R.Catalano, G.Malandrino; C. Bongiorno; R. G Toro,P. Fiorenza, R.Bodeux,; J.Wolfman,; M.Gervai, C. A. Lambert, F.Gervais,; et al Mat. Chem. and Physics 133(2-3) (2012) 1108-1115.
27 G. Malandrino, F. Castelli, I.L. Fragalà, Inorg. Chim. Acta 224 (1994) 203 28 I.S. Chen, J.F. Roeder, T.E. Glassman, T.H. Baum, Chem. Mater. 11 (1999) 209.
29 R. Lo Nigro, R. Toro, G. Malandrino, M. Bettinelli, A.Speghini, I. L. Fragala` , Adv. Mater. 2004, 16, 891.
30 R. Lo Nigro, G. Malandrino, R. G. Toro, M. Losurdo, G. Bruno, I. L. Fragala` , J. Am. Chem. Soc. 2005, 127, 13772.
31 A. A. Levchenko, L. Marchin, Y. Moriya, H. Kawaji, T. Akate,S. Guillemet-Fritsch, B. Durand, A. Navrotsly,J. Mater. Res. 23 (2008) 1522
32 K. T. Jacob, C. Shekhar, X. Li, G. M. Kale, Acta Mater., 56 (2008) 4798 33 S. Shinomori, M. Kawasaki, Y. Tokura, Appl. Phys. Lett. 80 (2002) 574 34 C.F. Kao, C.L. Jeng, Ceramics Intern.26 (2000) 237
35 Y. Ling, W. Ren, X.Q. Wu, L.-Y. Zhang, X. Yao, Thin Solid Films 311 (1997) 128.
36P. Fiorenza, R. Lo Nigro, V. Raineri, R. G. Toro, M. R. Catalano, J. Appl. Phys. 102 (2007) 116103.
28
Chapter 3: Pr
1-xCa
xMnO
3perovskite thin films
Manganite perovskite materials have been intensively investigated for their several electrical and magnetic properties and, for this reason, they have been proposed as active components in resistive1 and magnetic data storage 2as well as in other future technologies.
The manganite materials have a perovskite structure with the general formula AMnO3, but the
RE1-xAExMnO3complex perovskites, where RE stands for a trivalent rare earth element such
as La, Pr, Nd, Sm, Eu, Gd, Ho, Tb, Y etc, and AE for a divalent alkaline earth metal such as Sr, Ca and Ba, are most interesting for their technologically important electrical and magnetic properties.
The perovskite A-site is occupied by RE trivalent ions and AE divalent ions with 12-fold oxygen coordination. The smaller Mn ions in the mixed-valence state Mn3+–Mn4+ are located in the B-site at the centre of an oxygen octahedron, with 6-fold coordination.
Based on the tolerance factor, introduced by Goldschimdt, the manganites having t<1 possess a distorted structure, rhombohedral (0.93<t<1)or orthorhombic structures(t< 0.93), of lower symmetry than the cubic one.The lattice distortion is due to cation size mismatch and to the MnO6 octahedron distortion arising from the Jahn–Teller (JT) effect: a distortion of the
oxygen octahedron surrounding the B site cation splits the energy levels of a 3d ion such as Mn,3+ thus lowering the energy.Another lattice deformation comes from the connecting pattern of the MnO6octahedra in the perovskite structure, forming a rhombohedral or
orthorhombic lattice.3
29
The distortion of the MnO6 octahedra and consequently the structure of manganite is closely
relatedto its magnetic and transport properties. The coupling of structure and physical properties of manganites has been widely investigated.4-6In addition, in doped manganites all magnetic and electrical properties are associated with mixed valency of the magnetic ion and depend sensitively on the ratio between Mn3+and Mn4+ions.
The Mn atom (Z = 25) has an electronic configuration 3d54s2, the five degenerate 3d levels, in according to the Hund‟s rule, are singly occupied with parallel spin electrons. When Mn atom is coordinated in a center of the MnO6 octahedra, the effect of the octahedral crystal
field, due to the p orbitals of the six neighboring oxygens, is to partially lift the orbital degeneracy (Fig. 3.2a) generating a triplet of lower-energy states calledt2g (dxy, dxz, dyz) and a
doublet higher-energy states called eg (dx2-y2, dz2), with a separation Δ~ 1.5 eV.7The electronic
configurations of Mn3+ion is 3d4(Fig.3.2b) and it contains four d electron: three electrons in the t2g level aligned in the same direction and 1 electron in eg level. This eg electron plays a
key role in conducting and other properties of manganites. The electronic configurations of Mn4+ is a 3d3(Fig.3.2b) ; the missing of eg electron create a hole.
Fig. 3.2 a)Octahedral splitting of d electrons, b)electronic configurations of Mn3+ andMn4+ ions.
In the case of Mn3+ion electron configuration , the Jahn-Teller (JT) effect leads to a further distortion of the orbitals (Fig.3.3a). The Jahn-Teller (J-T) theorem asserts that in molecules/ ions that have a degenerate ground-state, the molecule/ion will distort to remove the degeneracy and achieve a lower energy state. According to the Jahn-Teller theorem, the Mn(III)O6 groups in the manganite are energetically unstable towards distortions aiming to
reduce the total energy of the system, as a consequence of a lifting of degeneracy of the eg
levels. The degree of distortion is determined by the competition between the gain in energy due to the eg splitting and the increase of the elastic energy associated with the lattice
30
electron in the eg orbital.The JT distortion of the octahedra can lead, throughout the crystal, to
a distortion of the whole lattice (cooperative JT distortions effect).
Fig.3.3. a)Distortion of the d orbitals by Jahn-Teller effect, b) cooperative JT distortions effect.
Cooperative JT effect is more evident in the manganite compounds in which the concentration of Mn3+ ions is sufficiently high (Fig. 3.3b). In this case a structural phase transition at a certain critical temperature TJT is evident.8Jahn-Teller effects in manganites is to localize the
eg electrons on Mn3+ sites, and to stabilize insulating phases, either locally or at long range.
On the other hand, if Mn3+concentration is low by doping with Mn4+ species, the cooperative JT effects is reduced, and no static distortion will be observed, but a dynamic effect which involves rapid hopping of the distortion from site to site.
In addition, the eg electrons of Mn3+ionsisresponsible for the phenomenon of charge ordering
(CO). This consists of a periodic distribution of electric charge in the crystal lattice driven by Coulomb interaction. The mobile eg electrons may be come localized at certain Mn ion
positions in the lattice, forming an ordered sublattice or on the bond centers as well, or, in the most general case, on some intermediate point between those two. Such an intermediate CO state can be more generally seen as a charge-density wave, lacking inversion symmetry and then potentially capable to develop ferroelectric ordering. The CO can be either long-ranged or short-ranged. It is clear that CO is competitive with the electron conductivity, because it tends to inhibit the movement of the charges through the crystal. Compounds with long-range CO are generally insulating, but localized CO (polarons) is responsible for an enhancement of resistivity, introducing scattering centers for the mobile electrons. At the end, the presence of Mn3+/Mn4+ion in the doped manganites lead to the double exchange mechanism, first introduced by Zener in 1951.9The eg electron on a Mn3+ion can hop to a neighboring
31
site(empty eg neighboring of Mn4+: the double exchange interaction favours hopping if
neighboring ions are ferromagnetically aligned, and do not favor hopping if neighboring ions are antiferromagnetically aligned.
Because the ability to hop gives a kinetic energy saving, allowing the hopping process reduces the over all energy. Thus, the ions align ferromagnetically to save energy. Moreover, the ferromagnetic alignment allows the eg electrons to hop through the crystal and the material
becomes metallic.
Very attractive property for future developments , that are closely related to the physical phenomena mentioned above, 10 is the colossal magnetoresistance. 11 The colossal magnetoresistance phenomenon, around the ferromagnetic transition temperature (Tc), consists in the dramatically decrease resistance of a material (negative magnetoresistance) when an external magnetic field is applied. In doped manganites the origin of the CMR is connected with the presence of a metal-insulator transition. The CMR effect is observed in manganites of a narrow range of composition between x = 0.3 and 0.4, where is observed the coexistence, in the absence of the magnetic field, of a ferromagnetic insulating phase and an antiferromagnetic insulating phase. In the presence of a magnetic field, these phases transform into a ferromagnetic metallic phase at a Curie temperature Tc. The maximum effect of the CMR appears near the Tc. Recently reported studies propose a new mechanism to explain the CMC effect, based on the idea that the colossal magnetoresistance is due to percolation between nanoscale ferromagnetic metallic (FMM) clusters in an antiferromagnetic insulating (AFI) matrix.12-14Among the doped manganite perovskite, Pr0.7Ca0.3MnO3 has been largely
investigated not only for its colossal magnetoresistance properties, but also for the recently observed electric pulsed induced resistance (EPIR),15interesting properties for potential applications in next-generation nonvolatile resistance random access memories, magneto-resistive read-head, and semiconductor field effect transistors.16,17
Pr1-xCaxMnO3 is obtained by chemical doping through substitution of Ca2+into Pr3+
sites(Fig.3.4a). It has a distorted perovskite-like structure with an orthorhombic Pbnm symmetry (Fig.3.4b) having lattice parameters at room temperature18a=0.5426 nm, b=0.5478
nm, c=7.679 nm.
The crystal structure is characterized by a considerable MnO6 octaedra distorsion, with a bond
32
Fig. 3.4.Pr1-xCaxMnO3 ideal perovskite a) and distorted orthorhombic b) structures.
A lot of papers report on the phase diagram of the Pr1-xCaxMnO3 in function of the
Ca2+concentration and temperature(Fig. 3.5).18- 20 For0 ≤ x ≤ 0.1 it is observed a antiferromagnetic insulating (AFI) phase, stable below 100 K. For 0.15 ≤ x ≤ 0.3 a region of ferromagnetic insulating(FI) phase with Tc ≤ 140 K is observed.For 0.3 ≤ x ≤ 0.5, the PCMO has an antiferromagnetic insulating behavior at temperatures below 150 K. Finally, for a wider range of doping, 0.3 ≤ x ≤ 0.75at 240 K, PCMO presents a state of charge ordering temperature TCO, due to a Jahn-Teller distortion. At lower temperature (≤ 175 K), d electrons
of Mn ions show antiferromagnetic (AF) spin ordering, resulting in an AF insulator. The magnetic state for temperature between the Neel temperature (TN) and that of charge ordering
Tco is a paramagnetic state (PI).In the range 0.3 < x < 0.4, a canted AF insulating (CAFI) state
is observed at low temperature, in which small ferromagnetic clusters are embedded in antiferromagnetic matrix.
Pr1-xCaxMnO3 is a unique example among manganites, exhibiting insulating behaviour over
the entire chemical composition x and over the entire temperature range. This is a consequence of the small ionic radius of Ca, which results in a pronounced orthorhombic distortion that favours charge localization.
The Pr0.7Ca0.3MnO3composition is between two different regions: one where the CO/AF
phase is stabilized and the other where a transition from a PI state to a FMI one is observed at around 130 K.
33
Fig.3.5.: Phase diagram of Pr1-xCaxMnO3.
3.1Pr
0.7Ca
0.3MnO
3thin films on STO(001) and STO:Nb (001) substrates
3.1.1 Thermal properties of the precursors and MOCVD growth
In this research, the attention has been focused on the synthesis of calcium-doped praseodymium manganite, Pr0.7Ca0.3MnO3, in the form of epitaxial thin films; for many
applications, it is desirable to synthesize these materials in the form of nanostructure thick and thin film. A lot of magnetic and electrical properties such as the temperature and field behaviour of the resistivity, the ferromagnetic transition temperature Tc, and the metallic/insulating transition temperature Tp,21are closely related to epitaxial strain due to the lattice mismatch between the film and the substrate. At the same time, developing a “user friendly” and low cost route to deposit thin films through an industrially transferable and scalable methodology, is necessary for introducing PCMO materials into electronic and magnetic devices. Metal-organic chemical vapor deposition (MOCVD) has the potential advantage of being a very reliable and reproducible method for the fast production of films with high uniformity degree in both thickness and composition over large areas.22In addition, a synthetic approach able to selectively deposit films with a defined stoichiometry is crucial since, as discussed above, the physical properties of PCMO are strictly related to the Ca doping amount.
In the first step of the present approach a screening has been done to find suitable precursors for the growth of PCMO films. Previous MOCVD studies carried out on Pr or Ca containing films have shown that the Pr(hfa)3•diglyme and Ca(hfa)2•tetraglyme
2,5,8,11,14-34
pentaoxapentadecane] are suitable Pr and Ca precursors to grow high quality films.
In regard to the Mn precursor, a novel Mn precursor has been synthesized and compared to commercial precursors.23,24The attention has been devoted to the synthesisof a new “second generation” manganese(II) precursor, the Mn(hfa)2●tmeda [tmeda = N,N,N',N'-
tetramethylethylendiamine)].
The solid state crystal structure of Mn(hfa)2●tmeda, determined by mean of X-ray
single-crystal diffraction confirmed the FT-IR evidences, i.e. the metal cation is coordinated by the four oxygen atoms of two hfa anion and its coordination sphere is fulfilled by the nitrogen atoms of one tmeda molecule. In this way, no water molecules take part to the manganese coordination (Fig. 3.1.1.1).25
The thermal behavior of the Mn(hfa)2●tmeda precursor has been investigated by
thermogravimetric (TG) analyses and compared with the commercially available Mn(II) [“Mn(acac)2”, acac = acetylacetone] and Mn(III) [Mn(tmhd)3,Htmhd =
2,2,6,6-tetramethyl-3,5-heptandione]precursors. The TG profile recorded at atmospheric pressure in purified nitrogen flow is reported in Fig. 3.1.1.2. The Mn(hfa)2●tmeda adduct is thermally stable and
the derivative curve of TG (DTG) consists of a single peak thus indicating that it evaporates quantitatively in the 100-230 °C temperature range, with a 1.5 % residue at 300 °C. A completely different behaviour has been observed for the commercially available Mn(II) precursor, the “Mn(acac)2”. This compound shows a TG curve with various steps in the range
120-280 °C and a very high residue (27%) at 350°C. This residue is likely due to Mn2O3
phase since a theroretical value of 27.3 % is found with respect to the parent Mn(acac)2•2H2O.
Fig. 3.1.1.1. Ball and stick representation of the compound Mn(hfa)2tmeda. Hydrogen atoms have