RESEARCH PAPER
Establishing pathological cut-offs of brain atrophy
rates in multiple sclerosis
Nicola De Stefano,
1Maria Laura Stromillo,
1Antonio Giorgio,
1Maria Letizia Bartolozzi,
2Marco Battaglini,
1Mariella Baldini,
2Emilio Portaccio,
3Maria Pia Amato,
3Maria Pia Sormani
41Department of Medicine,
Surgery and Neuroscience, University of Siena, Siena, Italy
2Neurology Unit, Hospital of
Empoli, Empoli, Italy
3Department of Neurology,
University of Florence, Florence, Italy
4Department of Health
Sciences (DISSAL), University of Genoa, Genoa, Italy Correspondence to Professor Nicola De Stefano, Quantitative Neuroimaging Lab, Department of Medicine, Surgery & Neuroscience, University of Siena, Viale Bracci 2, Siena 53100, Italy; [email protected] Received 11 November 2014 Revised 19 December 2014 Accepted 11 January 2015 Published Online First 22 April 2015
To cite: De Stefano N, Stromillo ML, Giorgio A, et al. J Neurol Neurosurg Psychiatry 2016;87:93–99.
ABSTRACT
Objective To assess whether it is feasible to establish specific cut-off values able to discriminate ‘physiological’ or ‘pathological’ brain volume rates in patients with multiple sclerosis (MS).
Methods The study was based on the analysis of longitudinal MRI data sets of patients with MS (n=206, 87% relapsing–remitting, 7% secondary progressive and 6% primary progressive) and healthy controls (HC; n=35). Brain atrophy rates were computed over a mean follow-up of 7.5 years (range 1–12) for patients with MS and 6.3 years (range 1–12.5) for HC with the SIENA software and expressed as annualised per cent brain volume change (PBVC/y). A weighted (on the follow-up length) receiver operating characteristic analysis and the area under the curve (AUC) were used for statistics. Results The weighted PBVC/y was−0.51±0.27% in patients with MS and−0.27±0.15% in HC (p<0.0001). There was a significant age-related difference in PBVC/y between HC older and younger than 35 years of age (p=0.02), but not in patients with MS (p=0.8). The cut-off of PBVC/y, as measured by SIENA that could maximise the accuracy in discriminating patients with MS from HC, was−0.37%, with 67% sensitivity and 80% specificity. According to the observed distribution, values of PBVC/y as measured by SIENA that could define a pathological range were above−0.52% with 95% specificity, above −0.46% with 90% specificity and above −0.40% with 80% specificity.
Conclusions Our evidence-based criteria provide values able to discriminate the presence or absence of
‘pathological’ brain volume loss in MS with high specificity. Such results could be of great value in a clinical setting, particularly in assessing treatment efficacy in MS.
INTRODUCTION
Numerous recent studies have used MRI-based methods for a computed estimation of brain volumes, since this may represent a valid biomarker of clinical state and progression in many neurological disorders.1In multiple sclerosis (MS), although the pathological hallmark is the focal demyelination of the cerebral white matter (WM), significant brain atrophy also occurs and proceeds relentlessly throughout the MS course.2 3 These volumetric changes occurring during the course of MS have been correlated with physical disability and cognitive impairment and, overall, have been of great relevance
for understanding the pathophysiology of MS and for monitoring treatment efficacy in clinical trials.3 4
In a complex disease such as MS, however, brain volume loss might be due to several mechanisms. These include not only tissue loss (ie, loss of myelin, glial cells, neurons and axons due to the inflamma-tory demyelination and neurodegeneration), but also change in non-tissue components (ie, fluids shift due to inflammation).5–9The respective contribution of each component to brain volume loss may depend on many factors, such as disease stage, brain region affected, type of pharmacological treatment, presence of comorbidities and other factors unrelated to the disease.10In addition, capturing temporal patterns of structural brain changes requires adequate MRI pro-tocols and accurate and robust image analysis tools. In this context, it might be challenging the use of MRI-based assessments on an individual basis to reli-ably classify participants into patient versus normal, as opposed to assessing significant group differences.
We propose here a study aiming at assessing whether it is feasible to achieve individual charac-terisation of brain atrophy rates in patients with MS by quantifying interindividual variations and group overlaps, taking advantage of MRI measure-ments obtained longitudinally over long follow-up periods (up to 12 years) using the same MRI proto-col on the same scanner. The main goal was to establish specific cut-offs of brain atrophy rates able to identify subjects with a ‘physiological’ or ‘patho-logical’ brain volume loss over time.
MATERIALS AND METHODS Study population
This is a study based on the analysis of longitudinal MRI data sets (at least 2 paired scans) of patients with MS and healthy controls (HC), which were acquired between January 2000 and December 2013 at the MR center of the University of Siena as part of other research studies. Patients (n=206, 146/60 women/men; age: mean 37 years, range 18–63 years; MS type: 180 relapsing–remitting (RR, 87%), 14 sec-ondary progressive (SP, 7%) and 12 primary progres-sive (PP, 6%)) were consecutively recruited among those who were referring to the MS Clinics of the Universities of Siena and Florence, and the hospital of Empoli during the study period. During the same period, HC (n=35, 20/15 women/men; age: mean=37 years, range 21–60 years) were recruited from laboratory and hospital workers and were included in the group if they had normal neurological Open Access
Scan to access more free content
examination and no history of neurological disorders. The minimum between-scan interval for patients with MS and HC was 12 months (MS patients: mean follow-up=7.5 years, range 1– 12 years; HC: mean follow-up=6.3 years, range 1–12 years). The mean number of paired scans was 2.6 (range 1–8) for patients with MS and 1.5 (range 1–4) for HC. The mean time interval between the paired scans was 4 years (SD=3 years) for patients with MS and 4.9 years (SD=4 years) for HC. For patients with MS, there was no limitation for the Expanded Disability Status Scale (EDSS)11 score (mean=2.25, range 0–8) and disease dur-ation (mean=6 years, range 0–32 years) at study entry. An EDSS assessment was performed at the time of each MRI visit. Disease-modifying treatments (DMTs) were used in 175 (85%) patients during the study period, while 31 (15%) patients did not receive any DMT during the study period with the exception of the intravenous administration of methylprednisolone during acute relapses.
The study received approval from the local ethics committee and written informed consent was obtained from all study participants.
MRI data and analyses
All MRIs were acquired at the MR center of the University of Siena using a 1.5 T Philips Gyroscan (Philips Medical Systems, Best, The Netherlands) and the same MRI protocol, as part of previous research projects. Identical conventional T1-weighted (T1-W) gradient-echo images used for the brain volume analysis (repetition time (TR)/echo time (TE)=35/10 ms, 256×256 matrix, 1 signal average, 250 mm field of view, 50 slices of 3 mm thickness, axial orientation) were acquired in each partici-pant and for each time point. Periodical quality control sessions and no major hardware upgrades were performed on the MR scanner during the study period.
Global brain volume changes over time were quantified using the SIENA method,12 part of the FMRIB Software Library (FSL; http://www.fmrib.ox.ac.uk/fsl/).13 14 This registration-based method uses images from two time points to assess brain volume changes by directly estimating the local shifts in brain edges across the entire brain and then converting the edge dis-placement into a global estimate of percentage brain volume change (PBVC) between the two time points. An automated procedure of brain extraction able to improve the removal of eyeballs and the remaining non-brain tissues15was implemented in SIENA for a more accurate estimation of brain atrophy.
Statistical analysis
Annualised PBVC (PBVC/y) was calculated for each participant as the slope of the regression line fitted to all the PBVC measurements for that participant, with the first available scan as the first time point, assuming a linear change over time. A weighted mean of PBVC/y in patients with MS and HC was calculated, with weights proportional to the follow-up duration (ie, higher weights were given to PBVC obtained from longer follow-up periods). Weights were calculated as the follow-up duration (expressed in years) divided by two, in order to account for correlated information within participants. Sensitivity analyses using no weights or weights equal to follow-up duration were performed. A brain atrophy rate cut-off, which simultaneously maximises the sensitivity and the spe-cificity of PBVC/y in discriminating on an individual basis patients with MS from HC, was estimated by a weighted receiver operating characteristic (ROC) analysis and quantified by the area under the curve (AUC).
Change in annualised EDSS (EDSS/y) was calculated for each participant as the slope of the regression line fitted to all the EDSS measurements for that participant, assuming a linear change over time according to the same procedure used for PBVC/y. The correlation of PBVC/y with EDSS/y worsening over time was tested at the univariate analysis by the Pearson correlation coefficient and at the multivariate analysis by a linear model adjusted for baseline characteristics (age, disease duration, EDSS, disease type). The difference in EDSS worsen-ing between patients with a PBVC/y higher and lower than 0.4% was tested by a Student t test and by a linear model adjust-ing for baseline characteristics.
All the analyses were run using SPSS V.21.0 (SPSS Inc Chicago, Illinois, USA) and R software.
RESULTS
Distribution of PBVC/y in HC and patients with MS
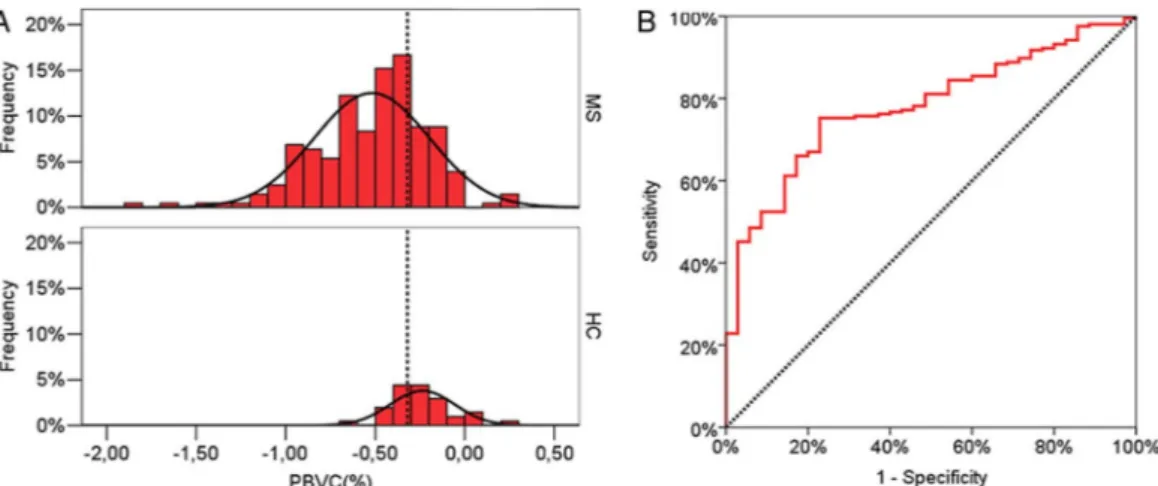
Of 545 paired T1-W images for patients with MS and 53 for HC, four scans of three patients with MS and two scans of one HC were excluded from the analysis because of unsatisfactory quality. Using a linear regression analysis, PBVC/y was calculated for each participant (figure 1) as the slope of the regression line of PBVC over time. The average (±SD) of these values, weighted on the follow-up length, was−0.51%±0.27% in patients with MS and −0.27%±0.15% in HC (p<0.0001). The observed (histogram) and theoretical (normal curve) distribution of PBVC/y is reported infigure 2A.
Figure 1 ‘Spaghetti’ plots reporting, with different colours, the percent brain volume change (PBVC) between every time point for each healthy control (HC; left panel) and each patient with multiple sclerosis (MS; right panel) with the fitted average slope (black line).
There was a significant age-related difference of PBVC/y in HC, but this was not observed in patients with MS: PBVC/y was −0.20%±0.13% in HC younger than 35 years and −0.32% ±0.14% in HC older than 35 years (p=0.02); PBVC/y was −0.52%±0.28% in patients with MS younger than 35 years and −0.51%±0.28% in patients with MS older than 35 years (p=0.8). There were no significant differences of PBVC/y between patients with MS who were in a relapsing form (−0.52%±0.29%) and those who were in a progressive form (−0.45%±0.18%, p=0.2) at baseline, and between patients with MS who were not on DMT (−0.43%±0.28%) and those who were on DMT during the follow-up (−0.53%±0.27%, p=0.1;table 1).
ROC analysis
The ROC curve relative to PBVC/y in patients with MS and HC is reported infigure 2B. The AUC was 0.77 (0.74–0.81) and the cut-off simultaneously maximising the sensitivity and specificity of PBVC/y in discriminating patients with MS from HC was −0.37%. Such a cut-off value gives an observed sensitivity of 67% and a specificity of 80% in discriminating patients with MS from HC based on their PBVC/y in our cohort. Using the
theoretical distribution fitted to the data, the sensitivity was 69% and the specificity was 74%.
When including only patients with relapsing–remitting mul-tiple sclerosis (RRMS; n=180), the AUC was 0.78 (0.74–0.81) and the best cut-off, as previously defined, was again−0.37%. In this cohort, using this cut-off value for PBVC/y, the sensitivity was 67% and the specificity was 80% in discriminating patients with MS from HC.
Similar results were obtained in the sensitivity analyses using dif-ferent weighting systems: the AUC using no weights was 0.78 (0.72–0.85) and the cut-off was−0.32%; the AUC using the full follow-up duration as the weight was 0.77 (0.75–0.80) and the cut-off was −0.37%. Results did not chance by including only patients with RRMS (AUC=0.78 (0.74–0.81); cut-off=−0.37%). Defining ranges of PBVC/y
The main aim of this analysis was to define ranges of ‘physio-logical’ or ‘patho‘physio-logical’ PBVC/y, and this could be achieved using the distribution of PBVC/y in HC and patients with MS. The ‘pathological range’ can be defined as the one containing all the values of PBVC/y that minimise the probability to define as ‘pathological’ an HC (ie, the value that maximises the specifi-city). Consequently, the ‘physiological range’ can be defined as the range of PBVC/y values below the threshold defining the pathological range. In table 2, the ranges giving an expected (and observed) 95%, 90% and 80% specificity to define a Figure 2 In (A), observed frequency distribution of annualised percent brain volume change (PBVC/y) in patients with multiple sclerosis (MS; top panel) and healthy controls (HC, lower panel) with their fitted normal distribution and the optimal cut-off discriminating the two groups as estimated by the receiver operating characteristic (ROC) analysis. In (B), ROC curve reporting sensitivity and specificity in discriminating patients with MS and HC according to different cut-off levels of their PBVC/y.
Table 1 Values of PBVC/y according to age, MS type and use of DMTs during follow-up
Subject characteristics Mean PBVC/y (SD), % p Value Age at baseline (HC)
≤35 (n=16) −0.20 (0.13) 0.02 >35 (n=19) −0.32 (0.14)
Age at baseline (patients with MS )
≤35 (n=92) −0.52 (0.28) 0.8 >35 (n=114) −0.51 (0.28) MS type Relapsing (n=180) −0.52 (0.29) 0.2 Progressive (n=26) −0.45 (0.18) DMTs during follow-up No (n=31) −0.43 (0.28) 0.1 Yes (n=175) −0.53 (0.27)
DMTs, disease-modifying treatments; HC, healthy controls; MS, multiple sclerosis; PBVC/y, annualised percent brain volume change.
Table 2 Cut-off values that identify PBVC/y (as measured by SIENA) distinguishing HC from patients with MS with specificity ranging from 95% to 80% and the corresponding levels of sensitivity
PBVC cut-offs, % Specificity (%) Sensitivity (%) −0.52 95% (observed 97) 49% (observed 44) −0.46 90% (observed 91) 56% (observed 48) −0.40 80% (observed 86) 65% (observed 61)
Values of probability are estimated from the theoretical normal distributions of PBVC/ y in HC and patients with MS (in brackets, those actually observed are reported). Note that the observed sensitivity was very similar when only patients with RRMS (n=180) were considered.
HC, healthy controls; MS, multiple sclerosis; PBVC/y, annualised percent brain volume change; RRMS, relapsing–remitting multiple sclerosis.
patient as having a pathological PBVC/y are reported. Expected values are calculated using the area under the normal distribu-tion with the mean and the SD obtained in the HC group, while observed values are the proportion of patients actually observed in our cohort.
According to the observed distributions, a cut-off of PBVC/y higher than−0.52% (ie, defining as ‘pathological’ a subject with a yearly brain volume loss higher than −0.52%) can identify a pathological subject with a 5% rate of ‘false-positive’ results (ie, a 5% of normal subjects will be defined erroneously as pathological using this cut-off), while a cut-off of PBVC/y higher than−0.46% can identify a pathological subject with a 10% rate of ‘false-positive’ results, and a cut-off of PBVC/y higher than−0.40% can identify a pathological subject with a 20% rate of ‘false-positive’ results (table 2,figure 3).
Testing association of the PBVC cut-offs with the rate of EDSS worsening
The slope of yearly EDSS worsening was estimated for each patient. The PBVC/y was significantly associated with the slope of EDSS change (r=−0.21, p=0.003), also when adjusting for age, MS type (relapsing vs progressive), disease duration and baseline EDSS in a multivariate model (partial r=−0.23, p=0.001). The PBVC/y was dichotomised according to the −0.4% cut-off to test whether patients with MS with a change in their brain volume above and below this value have a different EDSS worsening over time. The change in EDSS/y was signifi-cantly different between patients with a PBVC/y higher than −0.4% (mean EDSS/y change=0.00 (SD=0.32) and patients with a PBVC/y lower than−0.4% (mean EDSS/y change=+0.14 (SD=0.35), p=0.003,figure 4), and the difference remained sig-nificant after adjusting for age, disease duration, MS type and baseline EDSS. The same was true when only the patients with RRMS were considered: the change in EDSS/y was −0.10 (SD=0.20) for patients with PBVC/y higher than−0.4% and was +0.07 (SD=0.30), p<0.001 for patients with a PBVC/y lower than−0.4%.
DISCUSSION
Despite the relevance demonstrated by a number of research studies, brain volumetric MRI has yet to be widely translated into clinical practice. Generally, this is due to several factors such as, for example, the variation in imaging protocols (MRI parameters, spatial distortions, motion artefacts, etc) or the lack of normative data acquired with the same MR protocol used for patients who would allow the physician to interpret biomarker values in patient care. Moreover, even when using fully auto-mated computerised methods, anatomical knowledge has always to be the foundation of quality control (ie, visual inspection of the results), as it would happen for any type of quantitative ana-lysis. All these issues were taken into account in the present study. It is more difficult to control for factors such as lifestyle (eg, alcohol, smoking, dehydration), genetics (eg, apolipoprotein E expression) and concomitant drug therapies and pathophysio-logical conditions (eg, diabetes, cardiovascular risk), which may affect the accuracy of brain volume measurements, particularly in the single-patient assessment.1 Moreover, brain volume loss progresses over time and may be more pronounced when ageing is complicated by other risk factors, such as smoking, diabetes and other cardiovascular risk factors.16
Despite the above limitations, advances in computational technology are paving the way for a more convincing clinical use of MRI-based brain volumetry in a number of neurological disorders.1 17 This is, in principle, more difficult in a disease
with a complex pathological substrate such as MS where brain volume changes reflect not only tissue loss due to the inflamma-tory demyelination and neurodegeneration, but also fluid shift due to inflammation.5–9This makes it difficult to use individua-lised longitudinal brain volume assessments in a clinical setting since physiological variability and measurement errors may add to the biological variations related to the disease.
In this study, we made an attempt to control for many of the above limitations. First, we used a longitudinal data set of patients with MS and HC that was acquired with the same MR scanner (which did not have major hardware upgrades during the more than 10-year study period) and by using an identical protocol over the long follow-up. Second, a widely used soft-ware package (ie, SIENA),18 which has shown to be a highly sensitive, reproducible and accurate method in previous studies,19–32 was employed for measuring brain volume changes. Third, processes related to inflammation (ie, ‘pseudoa-trophy’) or the presence of concomitant pathophysiological con-ditions that can complicate the interpretation of brain volume measurements in the single patient were minimised by the long-term follow-up (ranging from 1 to 12 years, with a mean of 7.5 years in patients with MS and 6.3 years in HC); the long-term follow-up also minimises the impact of the biological vari-ability and measurement error on the estimate of the yearly rate of brain volume loss. Finally, we implemented a statistical model that was able to provide values of brain volume rates that could discriminate HC from patients with MS on a single-patient basis. Results show a range of brain volume rates (seetable 2) that could classify a single patient with MS as being in a physio-logical (ie, in the range of HC) or pathophysio-logical (ie, in the range of MS) rate of brain volume loss with a certain degree of sensi-tivity and specificity. Interestingly, these values are not different from those published previously by using the same approach as physiological16 33–35or pathological19–32 brain volume loss. In particular, our study suggests different values of PBVC/y that can define a pathological range at different levels of specificity (ie, ‘pathological’ rates could be defined as above−0.52% with a specificity of 95%, above −0.46% with a specificity of 90% and above −0.40% with a specificity of 80%). Interestingly, increasing age, which did not show a role in the PBVC/y differ-ence across patients with MS, did not infludiffer-ence such cut-off values. In contrast, treatment effect might have influenced them (most of the population with MS reported here was treated with DMT for most of the follow-up), but this should have worked in the direction of making the general cut-offs more conserva-tive on the pathological side.
Establishing cut-offs able to discriminate between physio-logical and pathophysio-logical rates in patients with MS is not an easy task. The relatively large overlap of the PBVC distribution between patients with MS and HC confirms these difficulties (seefigure 3). Thus, we based our statistical model on the speci-ficity we can reach in defining a subject in the ‘pathological’ range rather than on the sensitivity we can reach in defining a subject in the ‘physiological’ range. Indeed, a patient with MS does not necessarily have pathological brain volume loss in a given follow-up period, and in fact the overlap of the distribu-tions of HC and patients with MS is large on the right, ‘physio-logical’, side. In contrast, all HC are supposed to have a physiological rate of PBVC, thus making possible to base the definition of “pathological” on values that HC do not have or can have with a very low probability.
Several lines of evidence challenge the classical view of MS as a disease leading exclusively to the formation of focal WM lesions, giving paramount relevance to the diffuse pathology
involving grey and WM.36 37Brain volume loss can be consid-ered the ultimate consequence of this diffuse damage, and since this has relevant clinical implications on disease progression,3 the definition of pathological cut-offs for the rate of brain volume loss in a patient with MS could be of great help in a clinical setting with potential therapeutic impact. Indeed, rates
of brain volume loss have been shown to provide additional complementary information in explaining treatment effect on disability in a recent meta-analysis of randomised clinical trials.38 Even more importantly, brain volume loss rates might be very helpful in expanding the concept of no evident disease activity, an emerging target for treatment in MS where a Figure 3 Graphical representation of
the specificity given by each cut-off value of annualised percent brain volume change (PBVC/y) in distinguishing patients with multiple sclerosis (MS) and healthy controls (HC), with the fitted distribution of PBVC/y in each group, and the overlap of the two distributions.
measure of diffuse brain damage needs to be added to focal MRI (ie, WM lesions) and clinical (ie, relapses and disability) measures. In this context, on the basis of the present analysis, we can provide evidence-based criteria to choose cut-offs of PBVC/y defining patients with no evidence of brain volume loss. Indeed, according to the present data, a PBVC/y of −0.4% could discriminate the presence or absence of ‘pathological’ brain volume loss with high specificity and good sensitivity (table 2). This specific cut-off was demonstrated to be clinically relevant, since patients with brain volume loss higher than −0.4% had a significant EDSS worsening than those with a brain volume loss lower than−0.4% (seefigure 4).
Further, it must be stressed here that while the values of brain volume loss provided in this study for both the groups with patients with MS and HC are similar to those previously pub-lished by using the same measurement method (ie, the SIENA method),16 19–35 they cannot be extended to other methods. Moreover, while in this study biological variability and measure-ment errors were minimised by the long-term follow-up, owing to the use of an accurate quality control and a homogeneous single-centre data set, these sources of errors could be magnified in a real-world setting where the follow-up is significantly shorter and different MR sequences and multicentre data sets are used. Interestingly, a recent meta-analysis that integrated findings from 56 different MRI studies on whole brain volume changes in healthy individuals reported values which were not very different from those reported in this study, despite the het-erogeneity in the MRI acquisition and postprocessing. It is true, however, that this aspect needs to be further assessed in pro-spective multicentre studies, possibly focusing on healthy indivi-duals to establish normative values for brain volume changes from a large population and take into account all possible con-founding factors.
Contributors NDS made substantial contributions to the conception/design of the work and to the drafting of the manuscript. MLS and AG were involved in the acquisition, analysis and interpretation of the data and revising of the manuscript critically for important intellectual content. MLB, M Battaglini, M Baldini, EP and MPA participated in the acquisition and analysis of the data and revising of the manuscript critically for important intellectual content. MPS made substantial
contributions to the statistical analysis and interpretation of data, and to the drafting of the manuscript. All the authors gave their approval of the final version. Funding This study was supported by a grant from Fondazione Italiana Sclerosi Multipla (FISM, Cod. 2010/R/15).
Competing interests NDS has received honoraria from Schering, Biogen-Idec, Teva, Novartis, Genzyme, and Merck Serono S.A. for consulting services, speaking and travel support. He serves on advisory boards for Merck Serono S.A. and Novartis. He has received research grant support from the Italian MS Society. EP serves on scientific advisory boards for Biogen Idec, Merck Serono and Bayer Schering and receives research support and honoraria for speaking from Biogen-Idec, Merck Serono, Bayer Schering, Teva, Novartis and Sanofi Aventis. MPA serves on scientific advisory boards for Biogen Idec, Merck Serono, Bayer Schering, Teva and Sanofi Aventis and receives research support and honoraria for speaking from Biogen Idec, Merck Serono, Bayer Schering, Teva, Novartis and Sanofi Aventis. MPS has received personal compensation for consulting services and for speaking activities from Genzyme, Merck Serono, Teva, Synthon, Actelion, Novartis and Biogen Idec. Ethics approval Ethics Committee of the Azienda Ospedaliera Universitaria Senese.
Provenance and peer review Not commissioned; externally peer reviewed. Open Access This is an Open Access article distributed in accordance with the Creative Commons Attribution Non Commercial (CC BY-NC 4.0) license, which permits others to distribute, remix, adapt, build upon this work non-commercially, and license their derivative works on different terms, provided the original work is properly cited and the use is non-commercial. See: http://creativecommons.org/ licenses/by-nc/4.0/
REFERENCES
1 Giorgio A, De Stefano N. Clinical use of brain volumetry.J Magn Reson Imaging
2013;37:1–14.
2 Bermel RA, Bakshi R. The measurement and clinical relevance of brain atrophy in multiple sclerosis.Lancet Neurol2006;5:158–70.
3 De Stefano N, Airas L, Grigoriadis N, et al. Clinical relevance of brain volume measures in multiple sclerosis.CNS Drugs2014;28:147–56.
4 Filippi M, Rocca MA. MR imaging of gray matter involvement in multiple sclerosis: implications for understanding disease pathophysiology and monitoring treatment efficacy.AJNR Am J Neuroradiol2010;31:1171–7.
5 Trapp BD, Peterson J, Ransohoff RM, et al. Axonal transection in the lesions of multiple sclerosis.N Engl J Med1998;338:278–85.
6 Evangelou N, Konz D, Esiri MM, et al. Size-selective neuronal changes in the anterior optic pathways suggest a differential susceptibility to injury in multiple sclerosis.Brain2001;124:1813–20.
7 Helms G. T2-based segmentation of periventricular paragraph sign volumes for quantification of proton magnetic paragraph sign resonance spectra of multiple sclerosis lesions.MAGMA2003;16:10–16.
8 Whittall KP, MacKay AL, Li DK, et al. Normal-appearing white matter in multiple sclerosis has heterogeneous, diffusely prolonged T(2).Magn Reson Med
2002;47:403–8.
9 Evangelou N, Esiri MM, Smith S, et al. Quantitative pathological evidence for axonal loss in normal appearing white matter in multiple sclerosis.Ann Neurol
2000;47:391–5.
10 Giorgio A, Battaglini M, Smith SM, et al. Brain atrophy assessment in multiple sclerosis: importance and limitations.Neuroimaging Clin N Am2008;18:675–86. 11 Kurtzke JF. Rating neurologic impairment in multiple sclerosis: an expanded
disability status scale (EDSS).Neurology1983;33:1444–52.
12 Smith SM, Zhang Y, Jenkinson M, et al. Accurate, robust, and automated longitudinal and cross-sectional brain change analysis.Neuroimage2002;17:479–89. 13 Smith SM, Jenkinson M, Woolrich MW, et al. Advances in functional and structural
MR image analysis and implementation as FSL.Neuroimage2004;23(Suppl 1): S208–219.
14 Jenkinson M, Beckmann CF, Behrens TE, et al. FSL.Neuroimage2012;62:782–90. 15 Battaglini M, Smith SM, Brogi S, et al. Enhanced brain extraction improves the
accuracy of brain atrophy estimation.Neuroimage2008;40:583–9.
16 Enzinger C, Fazekas F, Matthews PM, et al. Risk factors for progression of brain atrophy in aging: six-year follow-up of normal subjects.Neurology2005;64:1704–11. 17 Brewer JB. Fully-automated volumetric MRI with normative ranges: translation to
clinical practice.Behav Neurol2009;21:21–8.
18 Smith SM, Rao A, De Stefano N, et al. Longitudinal and cross-sectional analysis of atrophy in Alzheimer’s disease: cross-validation of BSI, SIENA and SIENAX.
Neuroimage2007;36:1200–6.
19 Barkhof F, de Jong R, Sfikas N, et al. The influence of patient demographics, disease characteristics and treatment on brain volume loss in Trial Assessing Injectable Interferon vs FTY720 Oral in Relapsing-Remitting Multiple Sclerosis (TRANSFORMS), a phase 3 study of fingolimod in multiple sclerosis.Mult Scler
2014;20:1704–13.
Figure 4 The graph shows significant (p=0.003) differences in annualised Expanded Disability Status Scale (EDSS/y) changes between patients with multiple sclerosis with an annualised percent brain volume change (PBVC/y) higher than−0.4% (mean EDSS/y change: 0.0 ±0.32) and patients with a PBVC/y lower than−0.4% (mean EDSS/y change: +0.14±0.35). The difference remained significant after adjusting for age, disease duration, disease type and baseline EDSS.
20 Vollmer TL, Sorensen PS, Selmaj K, et al. A randomized placebo-controlled phase III trial of oral laquinimod for multiple sclerosis.J Neurol2014;261:773–83. 21 Dolezal O, Gabelic T, Horakova D, et al. Development of gray matter atrophy in
relapsing-remitting multiple sclerosis is not gender dependent: results of a 5-year follow-up study.Clin Neurol Neurosurg2013;115(Suppl 1):S42–48.
22 Perez-Miralles F, Sastre-Garriga J, Tintore M, et al. Clinical impact of early brain atrophy in clinically isolated syndromes.Mult Scler2013;19:1878–86.
23 Portaccio E, Stromillo ML, Goretti B, et al. Natalizumab may reduce cognitive changes and brain atrophy rate in relapsing-remitting multiple sclerosis—a prospective, non-randomized pilot study.Eur J Neurol2013;20:986–90.
24 Magraner M, Coret F, Casanova B. The relationship between inflammatory activity and brain atrophy in natalizumab treated patients.Eur J Radiol
2012;81:3485–90.
25 De Stefano N, Giorgio A, Battaglini M, et al. Assessing brain atrophy rates in a large population of untreated multiple sclerosis subtypes.Neurology
2010;74:1868–76.
26 van den Elskamp IJ, Boden B, Dattola V, et al. Cerebral atrophy as outcome measure in short-term phase 2 clinical trials in multiple sclerosis.Neuroradiology
2010;52:875–81.
27 Horakova D, Dwyer MG, Havrdova E, et al. Gray matter atrophy and disability progression in patients with early relapsing-remitting multiple sclerosis: a 5-year longitudinal study.J Neurol Sci2009;282:112–19.
28 Minneboo A, Jasperse B, Barkhof F, et al. Predicting short-term disability progression in early multiple sclerosis: added value of MRI parameters.J Neurol Neurosurg Psychiatry2008;79:917–23.
29 Horakova D, Cox JL, Havrdova E, et al. Evolution of different MRI measures in patients with active relapsing-remitting multiple sclerosis over 2 and 5 years: a case-control study.J Neurol Neurosurg Psychiatry2008;79:407–14.
30 Jasperse B, Minneboo A, de Groot V, et al. Determinants of cerebral atrophy rate at the time of diagnosis of multiple sclerosis.Arch Neurol2007;64:190–4. 31 Richert ND, Howard T, Frank JA, et al. Relationship between inflammatory lesions
and cerebral atrophy in multiple sclerosis.Neurology2006;66:551–6. 32 Paolillo A, Piattella MC, Pantano P, et al. The relationship between inflammation
and atrophy in clinically isolated syndromes suggestive of multiple sclerosis: a monthly MRI study after triple-dose gadolinium-DTPA.J Neurol2004;251:432–9. 33 Takao H, Hayashi N, Ohtomo K. A longitudinal study of brain volume changes in
normal aging.Eur J Radiol2012;81:2801–4.
34 Anderson VC, Litvack ZN, Kaye JA. Magnetic resonance approaches to brain aging and Alzheimer disease-associated neuropathology.Top Magn Reson Imaging
2005;16:439–52.
35 Hedman AM, van Haren NE, Schnack HG, et al. Human brain changes across the life span: a review of 56 longitudinal magnetic resonance imaging studies.Hum Brain Mapp2012;33:1987–2002.
36 Filippi M, Rocca MA. MRI evidence for multiple sclerosis as a diffuse disease of the central nervous system.J Neurol2005;252(Suppl 5):v16–24.
37 Filippi M, Rocca MA, Barkhof F, et al. Association between pathological and MRI findings in multiple sclerosis.Lancet Neurol2012;11:349–60.
38 Sormani MP, Arnold DL, De Stefano N. Treatment effect on brain atrophy correlates with treatment effect on disability in multiple sclerosis.Ann Neurol