UNIVERSITÁ DEGLI STUDI DELLA TUSCIA
Facoltà di Agraria
Dipartimento di Scienze dell’Ambiente Forestale e delle sue Risorse (DISAFRI)
Corso di Dottorato di Ricerca in
Ecologia Forestale
XXIII ciclo (2008-2010)Phenotypic plasticity of the bud set process
in a Populus nigra L. mapping pedigree
and characterization of phenology in a P. nigra European
association population
Settore Scientifico-Disciplinare AGR/05 Assestamento Forestale e Selvicoltura
Coordinatore:
Prof. Paolo De Angelis
Tutore: Dottorando:
Dr. Maurizio Sabatti Francesco Fabbrini
Co-Tutore:
Dr. Catherine Bastien Dr. Muriel Gaudet
A Loretta,
… che è bella
come il primo fiocco di neve
che vede un bambino …
Abstract
Among forest trees, poplars are important components of riparian ecosystems and are now accepted by the scientific community as ideal model to study perennial plants. They offer several advantages as a model system, including rapid growth, ease of cloning, prolific sexual reproduction, small genomic size and facile transgenesis. This study has the objective to contribute to the knowledge of the genetic control of bud set (apical bud formation in the fall) in black poplar (Populus nigra). For this purpose the genetic variability and the broad-sense hereditability at individual and genotypic level, have been examined in a full-sib family (POP5) and in different european natural metapopulations of black poplar grown in a common garden experiment. In addition QTLs (Quantitative Trait Loci) analysis for the most discriminative traits of phenotypic variation in POP5 has been done using a genetic linkage map produced using 154 genotypes. The full-sib family was obtained crossing two parents selected in the germplasm collection (DISAFRI – University of Tuscia) from Italian natural populations and divergent for phenology and other adaptive traits. The full-sib family was planted in two sites in central (Viterbo 42°25’N, 12°05’E) and northern Italy (Cavallermaggiore 44°42’N, 07°40’E). The european natural populations were sampled in 4 different countries and 814 genotypes, from 14 metapopulations were planted in a common garden study in Northern Italy (Savigliano 44°36’N, 07°37’E). A randomized block design was defined for the establishment of the experimental plantations in each site. Six complete blocks were used with one replicated genotype randomly assigned to each block. The phenological study has been realized on the basis of a protocol designed to monitor six crucial phenological phases of bud set in black poplar. Data analysis have allowed to decompose the contribution of the different phases to the dynamics of bud set. Results showed that the onset of growth cessation is a quantitative trait under strong genetic control. Night length is the most important signal triggering the physiological process, but the role of other environmental factors such as temperature increase during the process. Taking advantage of two contrasting experimental sites a considerable role of GxS interactions has been found in all the different phenological phases and the low temperature seems to influence the sensitivity of some more plastic genotypes. The large number of QTLs mapped in the POP5 genetic map, each one characterized by small or modest effect, highlighted the complex nature of traits involved in the apical bud formation-maturation process.
Key-words: Populus nigra L., GxS interaction, photoperiod, bud set, heritability.
Riassunto
Tra le specie forestali i pioppi risultano essere un’importante componente degli ecosistemi ripariali e sono ad oggi accettati dalla comunità scientifica come modello ideale per lo studio delle piante perenni. Per tale scopo questo genere offre molti vantaggi come il rapido accrescimento, la facilità di clonazione, la semplice riproduzione gamica, un genoma di dimensioni ridotte e un’agevole produzione di organismi transgenici. L’obiettivo di questo lavoro è contribuire alla conoscenza del controllo genetico del bud set (formazione della gemma apicale autunnale) in pioppo nero (Populus nigra L.). A tale scopo sono state esaminate la variabilità genetica e l’ereditabilità in senso lato, a livello individuale e genotipico, in una famiglia full-sib di pioppo nero (POP5) e in differenti metapopolazioni europee della medesima specie cresciute nello stesso impianto sperimentale (common garden). In POP5 sono stati inoltre mappati i QTLs (Quantitative Trait Loci) limitatamente ai caratteri maggiormente discriminanti della variabilità fenotipica sulla base di una mappa genetica prodotta utilizzando 154 genotipi. La famiglia full-sib è stata ottenuta dall’incrocio di due parentali divergenti per fenologia ed altri caratteri adattativi e selezionati in una collezione di germoplasma (DISAFRI – Università della Tuscia) composta da popolazioni naturali raccolte in Italia. La famiglia full-sib è stata piantata in due siti, rispettivamente nell’Italia centrale (Viterbo 42°25’N, 12°05’E) e settentrionale (Cavallermaggiore 44°42’N, 07°40’E). Le popolazioni europee sono state raccolte in 4 differenti Paesi e 814 genotipi, provenienti da 14 metapopolazioni, sono state piantate nello stesso sito sperimentale dell’Italia settentrionale (Savigliano 44°36’N, 07°37’E). In ciascun sito è stato definito un disegno sperimentale a blocchi randomizzati. Sono stati utilizzati sei blocchi ed una replica di ciascun genotipo è stata assegnata casualmente a ciascun blocco. Lo studio fenologico è stato condotto sulla base di un protocollo realizzato allo scopo di monitorare sei specifiche fasi fenologiche caratterizzanti il bud set in pioppo nero. L’analisi dei dati ha permesso di scomporre il contributo delle differenti fasi nella dinamica del bud set. I risultati hanno mostrato che l’innesco della cessazione dell’accrescimento è un carattere quantitativo caratterizzato da un forte controllo genetico. La lunghezza della notte risulta essere il segnale più importante nell’innesco del processo fisiologico, ma il ruolo di altri fattori ambientali come la temperatura aumenta durante il processo. Grazie alla possibilità di studiare due siti sperimentali contrastanti si è potuto constatare un ruolo considerevole dell’interazione GxS in tutte le diverse fasi fenologiche e la bassa temperatura sembra influenzare la sensibilità di alcuni genotipi più plastici. L’alto numero di QTLs mappati nella mappa genetica di POP5, ciascuno caratterizzato da un basso o modesto effetto, sottolineano la complessa natura dei caratteri coinvolti nel processo di formazione-maturazione della gemma apicale.
1
TABLE OF CONTENT
INTRODUCTION ... 4
1. STATE OF THE ART ... 7
1.1. POPULUS NIGRA L. ... 7
1.1.1. Taxonomy ... 7
1.1.2. Distribution ... 10
1.1.3. Biology and ecology... 11
1.1.4. Importance and uses ... 13
1.1.4.1. Ecological importance of Populus nigra L. ... 13
1.1.4.2. Economic interest of Populus nigra L. ... 16
1.1.4.3. Scientific importance of Genus ... 17
1.2. PHENOLOGY AND QUANTITATIVE GENETICS ... 18
1.2.1. Tree Phenology ... 18
1.2.2. Quantitative genetics ... 21
1.2.3. Quantitative traits loci (QTLs) ... 26
2. OBJECTIVE ... 29
3. MATERIAL AND METHODS – P. NIGRA FULL-SIB FAMILY ... 30
3.1. GENETIC MATERIAL ... 30
3.2. EXPERIMENTAL PLANTATIONS ... 31
3.3. SITES DESCRIPTION ... 32
3.4. PROTOCOL OF BUD SET MEASURES ... 32
3.5. OTHER TRAITS MEASURED ... 35
3.6. ORGANIZATION OF THE DATABASE AND STATISTICAL ANALYSES ... 36
3.6.1. Data management and fitting ... 36
3.6.2. Statistical analyses... 36
2
3.6.4. Principal component analysis ... 39
3.6.5. Linear and genetic relationship between traits ... 39
3.6.6. GxS interaction and plasticity of bud set... 41
3.6.7. QTLs analysis ... 42
4. RESULTS - P. NIGRA FULL-SIB FAMILY ... 43
4.1. SURVIVAL ... 43
4.2. TEMPERATURE AND PHOTOPERIOD DURING THE BUD SET PERIOD ... 44
4.3. PHENOTYPIC DYNAMICS AND VARIATION IN BUD SET TRAITS ... 45
4.4. COMPARISON OF POP5 PARENTS AND FAMILY MEAN VALUES ... 50
4.5. WITHIN-SITE FAMILY VARIABILITY AND HERITABILITY ... 53
4.6. GENOTYPE X SITE INTERACTION AND GENOTYPE STABILITY ... 56
4.7. DEFINITION OF THE MOST DESCRIPTIVE TRAITS BASED ON PHENOTYPIC VARIATION ... 58
4.8. GENETIC CORRELATIONS BETWEEN BUD SET TRAITS ... 61
4.9. NUMBER OF QTLS AND PERCENTAGE OF VARIANCE EXPLAINED ... 62
4.10. PHENOLOGICAL VS. BIOMETRIC TRAITS ... 65
5. DISCUSSIONS - P. NIGRA FULL-SIB FAMILY ... 67
5.1. DISSECTING THE BUD SET PROCESS IN POP5 ... 67
5.2. THE CONTRIBUTION OF PHENOTYPIC PLASTICITY TO VARIATION IN BUD SET... 70
5.3. QTL REGIONS DETECTED ... 72
6. CONCLUSIONS - P. NIGRA FULL-SIB FAMILY ... 75
7. MATERIAL AND METHODS - P. NIGRA EUROPEAN NATIVE POPULATIONS ... 77
7.1. GENETIC MATERIAL ... 77
7.2. EXPERIMENTAL PLANTATION ... 77
7.3. SITES DESCRIPTION ... 80
7.4. PROTOCOL OF BUD SET MEASURES ... 81
7.5. OTHER TRAITS MEASURED ... 82
3
7.6.1. Data management and fitting ... 82
7.6.2. Statistical analyses... 83
7.6.3. Genetic parameters ... 84
7.6.4. Principal component analysis ... 84
7.6.5. Linear and genetic relationship between traits ... 84
8. RESULTS - P. NIGRA EUROPEAN NATIVE POPULATIONS ... 85
8.1. SURVIVAL ... 85
8.2. TEMPERATURE AND PHOTOPERIOD DURING THE BUD SET PERIOD ... 86
8.3. PROGRESSION OF BUD DEVELOPMENT AND PHENOTYPIC VARIATION ... 87
8.4. GENETIC VARIABILITY AND HERITABILITY ... 91
8.5. SELECTION OF DESCRIPTIVE TRAITS BASED ON PHENOTYPIC VARIATION ... 93
8.6. GENETIC CORRELATIONS BETWEEN BUD SET TRAITS ... 95
8.7. PHENOLOGICAL VS. BIOMETRIC TRAITS ... 97
9. DISCUSSIONS - P. NIGRA EUROPEAN NATIVE POPULATIONS ... 99
9.1. LATITUDINAL CLINES IN GROWTH CESSATION AND BUD SET DYNAMIC ... 99
9.2. GENETIC CHARACTERIZATION OF THE BUD SET PROCESS ... 100
10. CONCLUSIONS - P. NIGRA EUROPEAN NATIVE POPULATIONS ... 103
11. GENERAL CONCLUSIONS AND PERSPECTIVES ... 104
12. REFERENCES ... 106
13. APPENDIX 1 ... 124
14. APPENDIX 2 ... 139
15. APPENDIX 3 ... 147
4
INTRODUCTION
Poplars are considered the fastest growing trees under temperate zones and are broadly used to produce a variety of wood-based products including paper, plywood, matches, light packaging materials or wood for bioenergy (Hansen, 1991; Heilman et al., 1994; Zsuffa et al., 1996). Among forest trees, they are important components of riparian ecosystems and are now accepted by the scientific community as a woody model tree which is necessary needed to study the unique processes that occur in perennial plants, such as secondary wood formation, bud set, bud flush and dormancy (Taylor, 2002). Poplars offer several advantages as a model system, including rapid juvenile growth (Bradshaw et al., 2000 ; Dickmann, 2001b), high levels of natural variations in wild populations (Jansson and Douglas, 2007), easy of sexual and asexual propagation (Stettler and Bradshaw, 1996), small genomic size (about 550 million base pairs, 4× larger than Arabidopsis and one fortieth the size of the Pinus genome) (Taylor, 2002 ; Boerjan, 2005 ; Tuskan et al., 2006), facile transgenesis, plant transformation and regeneration capabilities (Wullschleger et al., 2002).
Populus nigra L. is a tree of ecological, social, and economic interest. It is a species of
riparian woodlands that has been planted for centuries in urban areas as ornamental and landscaping and as windbreak and shelterbelt in rural areas. It is well suited also for riparian buffers for interception of contaminants before they reach the stream and for the control of erosion of banks streams and rivers maintaining a more natural landscape and saving money due to the low cost natural plant materials (Isebrands and Karnosky, 2001). P. nigra is one of the most important parents to produce euramerican hybrids in breeding programs to increase wood production and to be used in short rotation intensive culture.
Despite the enormous environmental advantages, the P. nigra riparian forests have been largely lost due to the spread of agriculture and other human activities. The genetic diversity, that is considered to be important for long-term survival of natural populations and for the ability to adapt to changing environmental conditions (Booy et al., 2000), is seriously threatened (Cagelli and Lefèvre, 1995 ; Lefèvre et al., 1998). Therefore, studies are necessary to get a better knowledge of the remaining natural populations of P. nigra to conserve and restore natural riparian ecosystems.
In the case of Populus several traits are likely to be important for local adaptation and phenology permits the trees to find the right compromise solution between the necessity to avoid the risk of frost damage, if the trees set buds too late or flush too early (Luquez et al.,
5
2008), and assure the maximization of the growth period (Kramer, 1996), especially for the short growing season of the northern latitudes. As a trait directly related to cold adaptation, the characterization of growth cessation is an important tool for the identification of ecotypes for conservation strategies, delineation of breeding zones and selection in breeding programs (Howe et al., 2003 ; Rohde et al., 2011). Daylength is the primarily used environmental signal for the growth cessation (Rohde and Bhalerao, 2007) even if the timing of bud formation are also influenced by other factors such as temperature (Kalcsits et al., 2009), temperature x photoperiod (x population) interaction (Håbørg, 1972 ; Tanino et al., 2010), nutrition and drought (Rohde et al., 2000 ; Howe et al., 2003). Given the influence of temperature on the phenology of trees, the cessation of growth and the bud formation may be affected by globally climatic warming and increase the risk of frost damage, the survival and eventually the distribution of forest trees, caused by a less closely adaptations to the local altered environment (Kramer, 1996 ; Kramer et al., 2000).
In the light of these considerations, research efforts in order to understand the genetic basis of growth cessation and bud formation are of paramount importance. Besides, in this context efforts are required also to investigate the role of phenotypic plasticity, a source of variability that can contribute to short-term adaptation to a changing climate regime (Rohde et al., 2011), and to evaluate the possibility of temperature-mediated plasticity in some genotypes that are more adapted to specific conditions.
The main objective of this work is to contribute to the knowledge of the genetic control of bud set applying a new detailed scoring system, analysing phenotypic plasticity of the bud set process in a full-sib family grown in two contrasting site and detecting quantitative trait loci (QTLs) for the most discriminative traits in term of phenotypic variation.
For these purposes the genetic variability (CVg) and the broad-sense hereditability (H2) at individual and genotypic level have been examined in a full-sib family of black poplar (POP5) and in different european natural metapopulations of the same species grown in a common garden experiment. The full-sib family was obtained from parents selected in a germplasm collection (DISAFRI – University of Tuscia) from Italian natural populations and divergent for phenology and other adaptive traits. The full-sib family was planted at two sites in central (Viterbo; 42°25’N, 12°05’E) and in northern (Cavallermaggiore; 44°42’N, 07°40’E) Italy. The european natural populations were sampled in 4 different countries and 814 genotypes, from 14 metapopulations, were planted in northern Italy (Savigliano; 44°36’N, 07°37’E). A randomized complete block design was defined for the establishment
6
of the experimental plantations in each site. Six complete blocks were used with one replicated genotype randomly assigned to each block. QTL analysis was based on 154 individuals. A genetic linkage map for the full-sib family POP5 has been produced by Gaudet and co-workers (2008) using MapMaker software version 3.0 (Lander et al., 1987) and improved after the addition of new genotypes (154 vs. 92) (Gaudet, personal communication). The phenological study has been realized on the basis of a protocol (Rohde et al., 2011) developed inside the POPYOMICS project (contract No. QLK5-CT-2001-00953, an EC funded research program: http://www.soton.ac.uk/~popyomic/) in order to improve the phenotypic resolution of the distinctive phases observed during the formation of the apical bud in autumn and to evaluate the duration of bud development as separate character.
The research leading to these results has received funding from the European Community's Seventh Framework Programme (FP7/ 2007-2013) under the Project NOVELTREE (grant agreement n° 211868, May 2008 – April 2012). The project has been undertaken by fifteen european partners, from seven countries, within six work-packages. The main aim of this project is i) develop genetic tools for forest tree breeding and optimized management of genetic resources, especially high throughput phenotyping and genotyping for adaptive and productivity-related traits of interest, and ii) demonstrate novel/improved methods to breed trees with improved quality and productivity (other information on the web site:
7
1. STATE OF THE ART
1.1.Populus nigra L. 1.1.1. Taxonomy
Populus nigra L., commonly known as black poplar, is a pioneer angiosperm of the genus Populus L. (aspen, cottonwood, and poplars) which belongs, as well as the genus Salix L., to
the family Salicaceae. The taxonomy hierarchy is:
Division MAGNOLIOPHYTA Class MAGNOLIOPSIDA Subclass DILLENIIDAE Order SALICALES Family SALICACEAE Genus POPULUS
Species POPULUS NIGRA
The genus includes nearly thirty species, according to a recent classification, but in the literature the number varies from 22 to about 85 due to the difficulties in delineating species boundaries and the misinterpretation of some hybrid (Eckenwalder, 1996 ; Dickmann, 2001a). The genus is naturally distributed in the temperate and cold regions of the northern hemisphere, from 30° to 70° of latitude, including Europe, Asia, north-Africa and America. Only a few numbers of species grow in subtropical areas and only Populus ilicifolia Engl., which is endemic to Kenya, grows in the equatorial region of East Africa (Browicz, 1966 ; Oballa, 1996).
Populus L. is historically divided into 5 morphologically and ecologically distinct sections
which subsequently, with the addition of Abaso, have been brought into 6 (Table 1). The major barriers to hybridization in the genus lie between sections whereas poplar hybrids occur naturally between species within the same sections and between species in some combinations of sections (Figure 1) (Zsuffa, 1975 ; Eckenwalder, 1996 ; Dickmann, 2001a ; Rajora and Zsuffa, 1984).
8
Table 1. Proposed taxonomic classification of the genus Populus (Dickmann and Kuzovkina, 2008).
b
Common names vary considerably depending upon language and locality.
9
Figure 1. Interspecific breeding in the genus Populus (Zsuffa, 1975).
URL: http://na.fs.fed.us/spfo/pubs/silvics_manual/volume_2/populus/populus.htm
The sections Aigeiros and Tacamahaca, between which natural hybridization occurs (Zsuffa, 1975 ; Eckenwalder, 1984 ; Floate, 2004), comprise most of the species of economic importance. Populus nigra L. belong to the first section that includes also Populus deltoides Marshall, an important commercial timber species particularly in the southern U.S.. It has a substantial predisposition to make hybrid with Populus trichocarpa Torr. & Gray (producing
Populus x generosa Henry) and Populus nigra L. (producing Populus x canadensis Moench),
largely utilized in poplar cultures. However, the placement of Populus nigra L. into section
Aigeiros remains controversial because its chloroplast DNA has ties to Populus alba L. of
section Populus (Smith and Sytsma, 1990), it has a genetic affinity to the other species of section Tacamahaca and it is not clearly more similar to the northern American cottonwoods placed into the same section than some species of the balsam poplars in the section
Tacamahaca. Aigeiros and Tacamahaca are two sections vegetatively and ecologically
readily distinguishable but there are no clear differences in flowers and inflorescences between them (Eckenwalder, 1996). The taxonomy of the species is particularly complex because the wide range of distribution and the human responsibility in the diffusion of the species facilitate intermediate forms of spontaneous hybrid among varieties. In addition, different synonymous for the same varieties exist (Cagelli and Lefèvre, 1995).
10
The varieties known are: P. nigra var. nigra Schneid, P. nigra var. italica Duroi, P. nigra var.
betulifolia (Pursh) Torr., P. nigra var. pubescens Parl. (= P. nigra var. caudina Ten.), P. nigra
var. thevestina Dode, P. nigra var. neapolitana Ten., P. nigra var. sinensis Carr., P. nigra var.
sosnowskyi Grossheim., P. nigra var. afghanica Aiton and Hemsl (Vietto, 2009).
More researches are needed to improve the resolution of poplar classification at section and species levels.
1.1.2. Distribution
Black poplar has a wide natural distribution area that extends from Ireland and the British Isles in the west to Kazakhstan and China in the east. It naturally grows all over Europe, from the Mediterranean in the south to approximately 64° latitude in the north, western Asia, form 30° latitude (Pakistan) in the south and 64° latitude (Russia, Severnaya river) in the north, and north Africa (Lefèvre et al., 2001 ; Vietto, 2009 ; Vanden Broeck, 2003) (Figure 2).
Figure 2. Distribution map of black poplar (Populus nigra L.), EUFORGEN 2009.
URL: http://www.euforgen.org/distribution_maps.html
In Italy the black poplar grows in all the national territory in cold and medium Lauretum and warm and cold Castanetum phytoclimatic zones.
11
Due to the fact that is an azonal species not linked to particular climatic area but only to the soil moisture, this native species grows along riparian ecosystem between the sea level up to 1.200 m a.s.l. (mountain range system of Alpi), 1.660 m a.s.l. (mountain range system of Appenini) (Vietto, 2009).
1.1.3. Biology and ecology
European black poplar is a typical heliophilous pioneer tree species that colonize open areas on european alluvial soils forming floodplain ecosystems. In softwood floodplain forests P.
nigra, together with Salix species, plays an important role in the initial phase of development
and it is a keystone species because it is highly adapted to water dynamics and sediment movement.
P. nigra is a rapid growth tree that can reach heights of 40 m and diameters over 2 m at
maturity; individual trees can live 300 years (Weisgerber, 1999). It has a wide, rounded crown and a yellow-white juvenile bark that become dark grey and deeply fissured with age with many swellings on the trunk. The leaves of Populus nigra L. are dimorphic; pre-formed leaves are small (15-95 cm2), dark green in colour, rhombic in shape, with a slightly lighter under-surface whereas neo-formed leaves are larger, broader than long, and oval in shape (Dickmann and Kuzovkina, 2008). Leaves has the lower angles rounded and the upper angle pointed, smooth on both sides, bluntly toothed margin and long and slender foot-stalks, so that they wave and flutter with the slightest draught of wind.
P. nigra is a dioecious and obligatory out-crossing species with female and male flowers on
separate uni-sexual individuals. They reach reproductive age at 10-15 years old, even if a remarkable quantities of seed are generally produced after 20 years old (Stanton and Villar, 1996), but may be delayed by unfavourable environmental conditions. Males commonly initiate flowering before females, ensuring that pollen is in the air when the first females are receptive (Farmer and Pitcher, 1981). Both sexes flower in the early spring (March - April), approximately 1-2 weeks prior to leaf emergence (except in some subtropical species), during the flood peak period. Black poplar produces flowers from specialized buds containing preformed inflorescences, which are clustered in <10 cm pendulous green racemes (catkins, aments) on females and smaller reddish-purple on males (Figure 3), primarily located in the upper tree crown (Barsoum, 2001).
12
Significant variation exist within and between species concerning the time and duration of flowering that are related to both photoperiod and ambient temperatures (Pauley, 1950): at higher latitude and altitude flowering is delayed while under longer growing season and wormer conditions it occurs earlier.
Figure 3. P. nigra leaves, flowers, catkins and seeds: 1. Branch with male catkins (a - f) and a closed terminal
vegetative bud (k). - 2. Branch with female catkins (g - i) and closed terminal vegetative bud (k). - 3. Branch with ripe fruit-catkins (a, b). - 4. Seedling with cotyledons and first ordinary leaves. - 5. Winter-branch. Photos and explanations from Borzan (2001).
13
Wind-dispersed pollen fertilizes ovule within 24 hours of arrival upon the receptive stigma and subsequent ovule ripening, seed maturation and dispersal occurring within 3-6 weeks following fertilization. Mature catkins are made up of many capsules, approximately 20-50, each developed from an individual flower, with about 4–5 small seeds (2 mm) per capsule with little or no endosperm (Braatne et al., 1996).
Seed dispersal typically occurring in late spring and it is timed to coincide with the presence of ideal conditions for seed germination and seedling establishment after the declining of river flows and the exposure of freshly barren alluvial deposits that are ideal microsites for colonization by P. nigra via wind- and water-disseminated seed. The opening of fruit capsule and release of seeds can be either gradual or very rapid. The short seed life, generally less than 2 weeks following seed dispersal under natural conditions, is an important limiting factor in the black and once a seed became wet, viability will be lost in 2-3 days (Braatne et al., 1996).
P. nigra is affected at all stages of its life cycle by hydrological conditions and the water
availability of soil moisture is fundamental for successful regeneration, but prevailing anoxic conditions will be fatal. Poplar species are also capable of asexual (vegetative) reproduction that occur after damage to parent promoted by flood disturbances or extended periods of submergence that stimulate dormant primordia in roots and shoots to produce new shoots and roots (Barsoum, 2001).
1.1.4. Importance and uses
1.1.4.1. Ecological importance of Populus nigra L.
Populus nigra L. has been planted for environmental purposes for centuries. Trees were
commonly used for amenity plantings in urban areas as ornamentals and landscaping and as windbreaks and shelterbelts in rural areas.
Urban amenity planting provide environmental benefits like moderation of winter and summer climate, protection from heavy or cold wind, decrement of noise pollution, creation of wildlife habitat, improvement of the air quality and good psychological effect on people that feel more peaceful and serene. Farmstead windbreaks protect farm homes, buildings and orchards from winter winds (Picture 1), decrease noise pollution and dust, provide beautify landscape and wildlife habitat. Field shelterbelts protect crops by decreasing moisture loss and
14
soil erosion, increase crop yields by up to 20% by decreasing stress on the plants, increase biodiversity and populations of beneficial insects and produce biomass for wood and energy. For these purposes it is essential the choice of the appropriate clone for the intended site and use, especially in order to ensure high levels of survival and growth. In the rural contest poplars are well suited also for riparian buffers for interception of contaminants before they reach the stream and, at the same time, provide improved wildlife habitat, increased biodiversity and decreased flood damage.
In both rural and urban contest poplars can be used to control erosion of banks streams and rivers maintaining a more natural landscape and saving money due to the low cost natural plant materials (Isebrands and Karnosky, 2001).
Picture 1. Row of Populus acting as windbreak near Oriashoro, Bulgaria.
URL: http://www.fao.org/docrep/62737e/62737e19.jpg
Poplars are also being used to recover polluted sites with heavy metals, pesticides, chlorinated solvents, hydrocarbons, excess nutrients and others pollutants because they can remove, degrade or contain chemical contaminants located in the soil by phytoremediation (Picture 2). 1.4 million sites in the EU have been identified as contaminate with organic and inorganic pollutants (Reichenauer, 2001) and this relatively new emerging technique is seen with interest by the world of research because is a promising cleanup solution for a wide variety of
15
pollutants and sites. Moreover, it is cheaper than conventional techniques (Chappell, 1997), like removal of the contaminated soil followed by the technical extraction of the pollutant or by deposition of the contaminated soil in a landfill, especially for a broad polluted area. At last, but not less important, all these forms of poplar’s utilization contribute also to carbon sequestration and provide a natural mitigation strategy in the storage of carbon dioxide (CO2) in biomass and soil (Isebrands and Karnosky, 2001). For example, concerning the rural shelterbelt Kort and Turnock (1996) reported that a poplar 2.5 m spacing between trees shelterbelt would have an average above ground biomass of 174.8 tonnes per kilometre and would contain 84.2 tonnes of carbon.
Picture 2. Phytoremediation study using Populus.
URL: http://ideonexus.com/2008/05/02/let-the-phytoremediation-begin/
Despite the enormous environmental advantages the black poplar riparian forests, that naturally evolve towards hardwood formations (Vanden Broeck, 2003) and that are among the most biologically diverse in the area of the species (Dickmann and Kuzovkina, 2008), have been largely lost due to the spread of modern civilization. Various anthropic perturbations, like the management of riverbanks, channelization, canal and dyke construction, intensive grazing, wood cutting, expanding agricultural activities and the large utilization of the euramerican hybrids, black poplar natural habitat have been lost and genetic diversity, that is considered to be important for long-term survival of natural populations and for the ability to
16
adapt to changing environmental conditions (Booy et al., 2000), is seriously threatened (Cagelli and Lefèvre, 1995 ; Lefèvre et al., 1998).
Therefore, studies are necessary to get a better knowledge of the remaining natural populations of P. nigra and efforts to improve of poplar image in the public perception (Cagelli and Lefèvre, 1995) in order to conserve and restore natural riparian ecosystems. Restoration programs will involve different approaches related to flow regulation, land-use policies, stream channel restoration and revegetation using a range of genotypes of native species in order to promote diversity (Braatne et al., 1996). In this sense two main projects, “EUFORGEN” P. nigra network” and “EUROPOP”, were started in order to work on the evaluation of the existing biodiversity of natural populations with the objectives of conservation and the restoration of the remaining natural riparian ecosystems.
1.1.4.2. Economic interest of Populus nigra L.
Concerning the economic point of view, P. nigra is one of the most important parent to produce euramerican hybrids in breeding programs to increase wood production, providing adaptive properties for various soil and climate conditions, excellent rooting ability of stem cuttings, high resistance to bacterial canker (Xanthomonas populi Ridé), fair resistance to Marssonina leaf spot (Marssonina brunnea (Ell. et Ev.) P. Magn.) and to poplar mosaic virus (Cagelli and Lefèvre, 1995). In the early 1980s, the ISP (Istituto di Sperimentazione per la
Pioppicoltura) started long-term breeding programmes using a large number of native P. nigra and the best P. deltoides females in controlled crossing or open pollination (Vietto and
Bianco, 2004). Recently intersectional hybrids between P. nigra and taxa in section
Tacamahaca, including some Asian species like P. maximowiczii and the north American P. trichocarpa, have been successful and some clones show promise for plantation wood
production (Dickmann and Kuzovkina, 2008).
Poplars are widely used in overseas countries as a source of timber for furniture manufacture, match-making and pulp. The most rapidly increasing use of the species today is in intensive culture for wood fibre and biomass for renewable, low-polluting energy (Picture 3). Thanks to the rapid juvenile growth and response to cultural treatments, the easy production of hybrids and the easy vegetative propagation, poplar’s hybrids are ideal for short-rotation intensive-culture (Wyckoff and Zasada, 2007).
17
Short-rotation coppice cultures (SRCs) can be expected to play a major role in the production of biomass as a renewable energy source to substitute fossil fuels according to the “White Paper of the European Commission on renewable sources of energy”. It set the target to increase energy by renewable sources up to 12% of the european energy consumption by 2010 in answer to the Kyoto’s protocol disposition that scheduled (Article 3.1) a 8% reduction in annual greenhouse gas emissions compared to the 1990s emissions by 2008– 2012 (Schulze et al., 2002).
Picture 3. Harvest of poplar’s short-rotation coppice cultures (SRCs).
URL:http://www.avanzi.unipi.it/ricerca/quadro_gen_ric/biomass_bioenergy/image biomass/Image19.jpg
1.1.4.3. Scientific importance of Genus
Regarding scientific importance of the genus, Populus was accepted by the scientific community as a woody model tree which is necessary needed to study the unique processes that occur in perennial plants, such as secondary wood formation, bud set, bud flush and dormancy (Taylor, 2002).
This genus has several advantages for biologic and genetics studies and it is considered primary model system because of the small and completely sequenced genome (about 550
18
million base pairs, 4× larger than Arabidopsis and one fortieth the size of the Pinus genome) (Taylor, 2002 ; Boerjan, 2005 ; Tuskan et al., 2006), publicly accessible molecular markers, gene sequences, bacterial artificial chromosome (BAC) libraries, high-throughput plant transformation and regeneration capabilities (Wullschleger et al., 2002). Other important attributes include the great diversity of species that cover vast geographic and elevation ranges (Brunner et al., 2004) as adaptations to the diverse conditions, the high levels of natural variations in wild populations (Jansson and Douglas, 2007), inter-specific crossability and the ease of sexual and asexual propagation (Stettler and Bradshaw, 1996). Moreover the genus has phylogenomic proximity to well-studied angiosperms (Brunner et al., 2004) and the rapid juvenile growth allow researchers to quickly measure short-term responses to abiotic and biotic factors (Bradshaw et al., 2000 ; Dickmann, 2001b).
To give an indication of the reservoir of knowledge of poplar that have been accumulated up to 2001, Dickmann (2001b) searched the TREECD database (2001 CAB International, New York, NY) and founded that from 1939 over 20500 publications on some aspect of poplars appeared were done, and approximately 65% of these were printed in the last quarter of the past century.
1.2.Phenology and quantitative genetics 1.2.1. Tree Phenology
Trees of temperate and boreal zones must adapt themselves to persist periods that are unfavourable for growth, as well as resist to the strict winter climatic conditions, synchronizing the annual growth cycle with the seasonality (Ruttink et al., 2007) in the context of a sessile existence. For this reason they have evolved a mechanism whereby they can switch between active growth during summer and dormancy in winter in response to the environmental signals (Figure 4).
Phenology is the study of recurring events that annually occur during the life cycle of plants and animals (Kramer, 1996), as a result of natural selection, and how they respond to seasonal change in their environment. The timing of bud set in the fall and bud flush during the spring represents a critical ecological and evolutionary trade-off between plant growth and survival (Horvath et al., 2003 ; Howe et al., 2003). Ruttink and co-worker (2007) describe the bud development during the autumn as compose of three processes: the bud formation, the acclimation to dehydration and cold, and finally the dormancy. In trees the activity of the bud
19
determines not only the extent of seasonal growth, which largely determines tree productivity and wood quality in temperate and boreal zones, but also growth habit and tree form (Rhode
et al., 2000).
Populus spp. are trees that show a continuous development during the growing season
(indeterminate growth) and that respond to short daylength, the only environmental signal that is constant and predictable year after year, with growth cessation, the formation of terminal bud (autumn bud set) and dormancy induction (Howe et al., 1996 ; Rohde et al., 2002). Plants which have an indeterminate growth are most responsive to photoperiod (Rohde et al., 2000) and the critical photoperiod, the largest one that induce the bud set response (Howe et al., 1995), is not inherited in a simple Mendelian mode but as a quantitative trait with a large number of genes involved in the reaction (Pauley and Perry, 1954 ; Rohde et al., 2000).
Figure 4. Modified picture of the synchronization of the annual growth cycle with the seasonality in Populus
spp. The bud flush and bud set delimit the growing season. Non-growing season is characterised by different meristem stages: I, cessation of cell division; II, establishment of dormancy; III, maintenance of dormancy; IV, release from dormancy state; and V, resumption of cell division. ‘Gap’ between stage IV and V denotes the phase where growth does not occur because of purely environmental restraints (Rohde et al., 2007). On the left are showed different significant moment during the bud formation process (Rohde et al., 2000).
20
In the case of Populus several traits are likely to be important for local adaptation and phenology of bud permits the trees to find the right compromise solution between the necessity to avoid the risk of frost damage, if the trees set buds too late or flush too early (Luquez et al., 2008), and assure the maximization of the growth season (Kramer, 1996), especially for the short growing season of the northern latitudes.
Common garden studies demonstrate that bud set in the fall and bud flush in the spring are correlated with the latitudinal and altitudinal origin of the trees (Frewen et al., 2000 ; Howe et
al., 2003 ; Ingvarsson et al., 2006) and trees from high latitudes and elevations are earlier
relative to trees from lower latitudes and elevations (Pauley and Perry, 1954). Howe and co-workers (1995) found the northern ecotype show a longer critical photoperiod and a greater photoperiodic sensitivity, defined as the change response per unit change in photoperiod, than the southern ones. Some studies show that the latitude of origin is a factor which has strong effect on phenology. The days to bud set showed a significant clinal pattern with the variation in the latitude which explains most of the variation among populations in the timing of bud set (Ingvarsson et al., 2006 ; Hall et al., 2007) as adaptive answer to different length of the growing season.
For the growth cessation daylength is the primarily used environmental signal (Rohde et al., 2007) even if the timing of bud formation are also influenced by other factors such as temperature (Kalcsits et al., 2009), temperature x photoperiod (x population) interaction (Håbørg, 1972 ; Tanino et al., 2010), nutrition and drought (Rohde et al., 2000 ; Howe et al., 2003). Given the influence of temperature on the phenology of trees, the cessation of growth and the bud formation may be affected by globally climatic warming and increase the risk of frost damage, the survival and eventually the distribution of forest trees, caused by a less closely adaptations to the local altered environment (Kramer, 1996 ; Kramer et al., 2000); if some species will benefit from increasing temperatures and longer favourable season, others will disappear (Linderholm, 2006).
In this contest phenological observation are very important in a global-climate warming scenarios for a better understanding how different plant species respond to regional climate conditions and to climatic changes by shifting their phenological events (Chmielewski and Rötzer, 2001 ; Menzel, 2000). Johnesn and co-workers (2005a ; 2005b) had demonstrated that phenological process of bud formation in Picea abies (L.) Karst. is strongly affected for many year by temperature prevailing during zygotic and somatic embryogenesis and this memory has probably an epigenetic nature (Kvaalen and Johnsen, 2008), introducing a new font of
21
phenotypic variation and adaptive plasticity between generations for one of the most differentiated genetic trait in many temperate trees (Rohde and Junttila, 2008).
In Poplars the bud set in the fall and the cessation of growth are regulated by phytocrome (Howe et al., 1996 ; Olsen et al., 1997) phyA, phyB1, phyB2 (Howe et al., 1998), with the mediation of poplar CO/FT module (Costant/Flowering Locust) (Böhlenius et al., 2006). Given that the phenological process of bud set in the fall is a quantitative trait under moderate to strong genetic control (Li et al., 1998 ; Howe et al., 2000 ; Frewen et al., 2000, Luquez et
al., 2008), in the last years a lot of researches are developing about the identification of genes
involved in the genetic variation of bud set through quantitative traits loci (QTLs) analyses.
1.2.2. Quantitative genetics
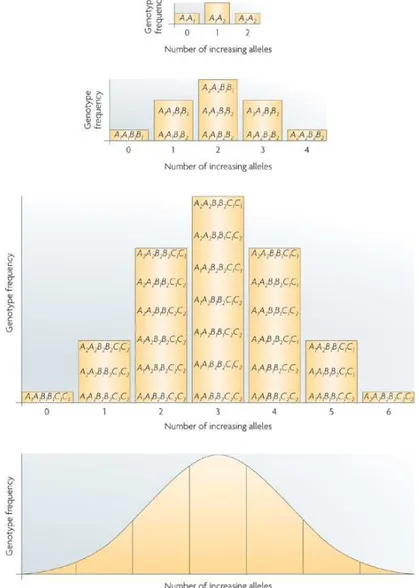
Quantitative genetics is a science that study quantitative characters and seek to explain how variability in these is influenced by heritable and non-heritable factors. In fact quantitative traits, also called metric characters because their study depends on measurement instead of on counting, exhibit a continuous variation. The resultant normal distribution, which is described by its mean (mid-point) and by its characteristic variance (width), is due to the combination effect of many genes, each contributing a small amount (Figure 5), plus non-genetic causes, like environmental factors, that are non-heritable and reduces the efficiency of selection (Falconer, 1981). The study of quantitative traits is very important because they are adaptive and economic characters such as reproductive ability, diameter, height, growth, survival, bud set, bud flush, cold hardiness, drought hardiness, wood quality, disease resistance etc. In order to dissect quantitative traits and analyse the genetic proprieties of a population is necessary to distinguish two terms often used mistakenly: genotype and phenotype. The genotype is the genetic potential of a generic individual. It is determined by the genes that reside in chromosomes and it cannot be seen directly. The phenotype is the individual we directly see on the field, we measure and we work with. It is influenced by the genetic potential of the tree and by the environment in which the tree is growing (Zobel and Talbert, 1984). The phenotype is often indicated by the formula:
Formula 1: P= G+ E
22
The relative contribution of the genetic and environmental components to the phenotypic variability of a generic quantitative trait is described by heritability. This parameter measures the percentage of variation among trees that is genetic and range from 0 to 100% (0.00 to 1.00). It is of primarily importance in order to predict result in genetic improvement programs: low heritabilities make genetic improvement difficult.
Figure 5. Effect of increasing number of alleles on genotype frequency (Plomin et al., 2009).
In order to calculate heritability of a generic quantitative trait is necessary to measure the phenotypic variability by the Analysis of Variance, an analytical method developed by R.A. Fisher in the 1920s, and divide it into its genetic and environmental components by equating
23
genetic expectations (expected mean square) to observed mean square in a completely balanced experiment (Riemenschneider et al., 1996).
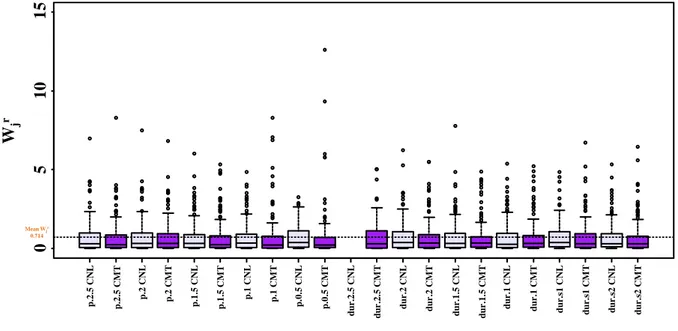
Another source of variability is due to the genotype x environment interaction (Barcaccia and Falcinelli, 2005), term used to describe the situation where a number of genotypes respond differently to various environments. This may involve a change in the rank of the different individuals of a given population, which is the most important type of interaction to the tree breeder, or may simple involve a change in the variation from one site to other with no change in rank, situation that cause no problem for breeding because a well-performing genotype selected in one environment will remain well-performing when grown in a different environment. It can be of great benefit when maximum gains are desired in specific environment, but the GxE interaction can became a formidable barrier when an environmental stable genotype for a given trait is sought (Zobel and Talbert, 1984). A good method to reduce the genotype x environment interaction in breeding program is to select for genotypes that perform well and that show little interaction over different environmental condition; for this aim several statistics estimating stability (Wricke, 1962 ; Brancourt-Hulmel et al., 1997 ; Mandel, 1969 ; Gauch, 1992) have been developed to understand which genotypes mainly contribute to the total GxE interaction in a given population studied. The genotype x environment source of phenotypic variability is considered very important and an understanding of the genetic control of this interaction is of great importance for quantitative genetics and its applications in breeding, conservation and theory of evolution (Rae et al., 2008).
Following what we have previously mentioned, the total phenotypic variance includes the components due to the genotypic variability, environmental variability and the interaction between genotype and environment, as shown by the following formula:
Formula 2: σ2P= σ2G + σ2E + σ2GE
where σ2P is the phenotypic variability, σ2G and σ2E the genotypic and environmental variability respectively and σ2GE the genotype-environment interaction.
The genotypic variance can be further divided into the additive and the non-additive components. The additive variance, fixable by selection, is the variance in a trait that is due to the effects of each individual allele being added together, without any interaction with other alleles or genes. The non-additive genetic variance can be divided into two types: dominance
24
variance, that is due to the interaction between alleles at a gene locus and is not directly inherited from parent to offspring, and epistasis variance, which is due to the interaction between different gene loci (Zobel and Talbert, 1984). Following the previous distinction, the genetic variance component is described as:
Formula 3: σ 2G= σ2D + σ2H + σ2I
where σ2D is the additive variance, σ2H is the dominance variance and σ2I the interaction component. In this way, the phenotypic variance could be expressed by the complete formula:
Formula 4: σ 2P= σ2D + σ2H + σ2I+ σ2E + σ2GE
Because the expression of a generic quantitative trait is a result both of the environment in which the trait is expressed and genes involved in this expression, it doesn't make sense to say of a particular phenotype that characterize an individual that genes are more important than environment or vice versa in determining it because it’s not possible have this phenotype without both sources of variability. What is possible to measure is how much of the difference among individuals is attributable to differences in their genes by the heritability value. The concept of heritability, which express the proportion of variation in the population that is attributable to genetic differences among individuals and, therefore, a ratio of the degree to which parents pass their characteristics to their offspring, is one of the most used in quantitative genetics and it is of key importance in estimating gains that can be obtained from selection programs (Zobel and Talbert, 1984).
Two types of individual-tree heritability exist: narrow-sense heritability (h2) and broad-sense
heritability (H2). The first one represents the ratio of additive genetic variance to total
variance and it can be written as:
Formula 5: h 2 = σ2D / σ2P
or
Formula 6: h 2 = σ2D / σ2D + σ2H + σ2I+ σ2E + σ2GE
25
Narrow sense heritability can also be calculated directly from breeding experiments through the direct observation of results and, in this case, it is called “realized heritability”. The range of narrow-sense heritability varies from 0, when we have no additive variance, to 1, when we have only the additive component. Broad-sense heritability is defined as the ratio of total genetic variation in a population to the phenotypic variation and it can be written as:
Formula 7: H 2 = σ2G / σ2P
or
Formula 8: H 2 = σ2D + σ2H + σ2I / σ2D + σ2H + σ2I+ σ2E + σ2GE
where σ2G is the genetic variance and σ2P the total phenotypic variance.
The biggest problem with broad sense heritability comes from that all genetic phenomena are included into a single σ2G factor. The broad-sense heritability limits are 0, when none of variation in a population is due to genetics, and 1, when we have not environmental effects on the variation. This kind of parameter is never lower than the narrow-sense heritability; if all the genetic variance is of the additive type, the two types of heritabilities are equal.
An important but often underestimate aspect of heritability is that they applies only to a particular population growing in a particular site at a particular moment because a generic quantitative trait may not be influenced by exactly the same genes when grow in different environmental or experimental conditions. The heritability value of a given trait also change with age when the environment change and when the genetic control of the character change as the tree mature (Zobel and Talbert, 1984).
Like heritability, tree improvers are really interest to understand the genetic correlations among traits because they indicate the proportion of variance that two traits share due to genetic causes and how the improvement of one character will cause simultaneous changes in other ones.
An observed phenotypic correlation between two quantitative traits may be due to genetic or environmental causes, and just as with phenotypic variances, there is a need to understand these underlying components that give rise to a phenotypic correlation. Genetic correlations, correlation of breeding values, and environmental correlations, correlation of environmental deviations together with non-additive genetic deviations, combine together to give phenotypic correlations. These two genetic parameters allow us to define independently the genetic and environmental causes of a correlation (Falconer, 1981).
26
Genetic correlations may be estimated as:
Formula 9: rg = σg(xy) / [σ2g(x) x σ2g(y)]½
where σ2g(x) is the genotypic variance component for the trait x, σ2g(y) is the genotypic variance component for the trait y and σg(xy) is the genetic covariance between the same traits.
By the same way we can estimate residual or environmental correlations as:
Formula 10: rw= σw(xy) / [σ2w(x) x σ2w(y)]½
where σ2w(x) is the residual variance component for the trait x, σ2w(y) is the residual variance component for the trait y and σw(xy) is the residual covariance between the same traits.
In some cases genetic and environmental correlations are similar but they could be very different in magnitude or opposite in sign and these show that genetic and environmental sources of variation affect the traits through different physiological mechanisms.
1.2.3. Quantitative traits loci (QTLs)
Quantitative trait loci (QTLs) are genomic regions associated with a phenotypic trait exhibiting continuous variation. The QTL mapping techniques were developed in the late 1980s with the advent of molecular markers and it allows us to dissect quantitative variation and understand the genetic control of such complex traits. This important tool has been used to look at a number of traits in Populus such as biomass (Rae et al., 2008 ; Marron et al., 2010), rust resistance (Newcombe et al., 1996 ; Jorge et al., 2005), canopy structure (Wu and Stettler, 1998), leaf traits (Wu et al., 1997 ; Ferris et al., 2002 ; Rae et al., 2006), stem growth (Bradshaw and Stettler, 1995 ; Wullschleger et al., 2005), growth rates (Wu et al., 2003), bud dormancy (Frewen et al., 2000), bud set (Marron et al., 2010 ; Rohde et al., 2011).
The mapping of quantitative trait loci is the statistical study of the alleles that occur in a locus and the phenotypes that they produce. They are shown as intervals across a chromosome, where the probability of association is plotted for each marker used in the mapping experiment (Bradshaw, 1996).
Understanding the genetic architecture of quantitative traits is important in a number of disciplines, including animal and plant breeding, medicine, plant evolution.
27
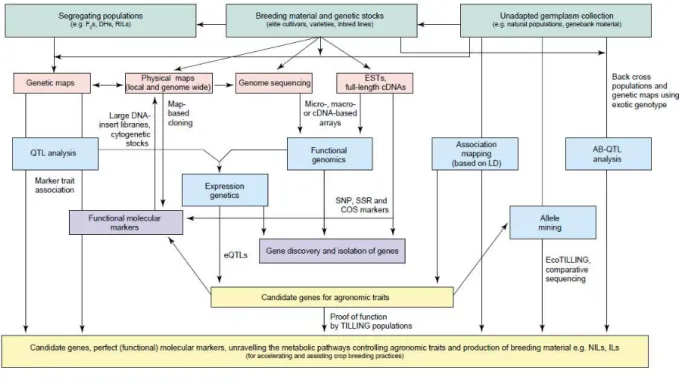
Mapping QTLs make possible the manipulation of genes in breeding programs. For every quantitative trait at the molecular level we wish to know the chromosomal location of each quantitative trait locus (QTL) affecting the trait, the magnitude of effect of each QTL on observed phenotype (many genes of small effect or few genes of large effect), the mode of gene action at each QTL (additive, dominant/recessive, over-dominant), the effect of interaction among different QTLs (epistasis) and the parent source of beneficial QTL alleles (Bradshaw, 1996). Moreover an important goal of genetic studies is try to quantify the number of QTLs that influence a quantitative trait, the number of alleles that each QTL has, the frequencies of the alleles in the population and the influence of each QTL and its alleles on the quantitative trait (Moore, 2003), in order to characterize the genetic architecture of the traits. The locations of QTLs in the genome can be determined by genetic mapping with respect to genetic markers (Figure 6).
Figure 6. Different genetic and genomic strategies for crop improvement (Varshney et al., 2005). Abbreviations:
AB-QTLs, advanced backcross QTL; COS, conserved orthologous set; eQTLs, expression QTLs; ESTs, expressed sequence tags; LD, linkage disequilibrium; QTL, quantitative trait loci; SNP, single nucleotide polymorphism; SSR, simple sequence repeat; TILLING, target induced local lesions in genome.
28
Genetic maps allow scientists to search for a specific gene somewhere within a vast genome of plants or animals through the help of genetic markers, genes or DNA sequence with a known location on a chromosome, that allow to access to the genes. In recent years, numerous genetic markers have been identified and mapped with molecular techniques making QTL mapping feasible for many organisms. The underlying idea is simple: if the inheritance of a genetic marker is associated consistently with the inheritance of a particular characteristic (such as increased height), then that marker must be linked to a QTL that affects height. The key is to have enough genetic markers so that QTLs can be detected throughout the genome (Pierce, 2002). When a QTL is found, it is often not the actual gene underlying the phenotypic trait, but rather a region of DNA that is closely linked with the gene.
Another use of QTLs is to identify candidate genes underlying a trait because once a region of DNA is identified as contributing to a phenotype, it can be sequenced and compared to a database of DNA for genes whose function is already known. For organisms whose genomes are known, one might try to exclude genes in the identified region whose function is known with some certainty not to be connected with the trait in question.
29
2. OBJECTIVE
Phenology is crucial to tree distribution and conservation and research efforts to understand its genetic basis are of paramount importance, especially in the light of climate change. In this direction our objectives are:
• to contribute to the knowledge of the genetic control of bud set applying a new detailed scoring system to assess the phenotypic and genetic variation of the different components of the process (Rohde et al., 2011);
• to assess the bud set process in an intra-specific poplar pedigree grown in two contrasting sites and in different european metapopulations of black poplar;
• to analyse the response to the photoperiod and evaluate the role played by the temperature and the “environment” in the process;
• to analyse the phenotypic plasticity of the bud set process in two contrasting site, another short-term option for adaptation (global change) that remained largely uncharacterized for phenology traits;
• to detect quantitative trait loci (QTL) in the intra-specific pedigree for the most descriptive traits, using the available molecular genetic map (Gaudet et al., 2008), and test the robustness of QTL in the mapping pedigree.
In perspective this work is aimed to contribute to the identification of one or more traits relevant as selection criteria and to provide molecular markers for marker-assisted selection (MAS) to be used in breeding programs.
30
3. MATERIAL AND METHODS – P. nigra full-sib family
3.1.Genetic material
An intra-specific Populus full-sib family was examined in this experiment. The family consisted of 162 black poplar (Populus nigra L.) genotypes resulting from an intra-specific cross (P. nigra x P. nigra family, POP5) between the Populus nigra L. “Poli” (father parent) from the southern Italy Policoro (40°09’N, 16°41’E) and the Populus nigra L. “58-861” (mother parent) from the northern Italy Val Cenischia (45°09’N, 07°01’E).
In order to cover a significant range of variability, parental genotypes were chosen according to their strong differences, tested in a common garden experiment, in morphological (Picture 4) and phenological traits.
Picture 4. Morphological differences between female (58-861, on the left) and male (Poli, on the right) parents
of the P. nigra intra-specific cross.
The female parent has less branches and biggest leaves than the male parent as adaptive response to colder ad wet environment conditions of the native site of origin. The cross was realized in Italy by the Department of Forest Resources and Environment of the University of
31
Tuscia (DISAFRI, Viterbo) in 2001 (Sabatti, personal communication) and the collection of progeny is preserved in the experimental farm of the University.
3.2.Experimental plantations
The study was performed in two common garden experimental plantations established during April 2003 (Cavallermaggiore, CV) and April 2008 (Viterbo, VT) from 25 cm homogeneous hardwood cuttings planted at a spacing of 0.75 m in rows and 2 m between rows (Picture 5), accommodating an overall plant density of 6667 plants per ha.
Picture 5. Preparation of the two common garden experimental plantations established during April 2003
(Cavallermaggiore, on the left) and April 2008 (Viterbo, on the right).
The field trials were established using a randomized complete blocks design with six blocks for CV and five blocks for VT. One replicate of each F1 genotype and of the parents was randomly assigned to each block and a double border row, using clonal material of the same species, was planted around the plantation in each location to minimize border effect (Zavitkovski, 1981 ; van Heacke et al., 1995).
The two plantations were irrigated, weeded and treated with pesticides and fungicides as needed during the two growing seasons in CV and the first one in VT. Systematic pruning was made during February 2005 (at the end of second growing season of the first coppice rotation) only for the northern site, and during the entire plantations duration new shoots were removed in both sites in order to keep only one stem on each stool to avoid light competition among shoots of a stool.
32
3.3.Sites description
The field trials were located in central (VT, Tevere valley; 42°25’N, 12°05’E) and northern Italy (CV, Po valley; 44°42’N, 07°41’E) with an elevation of 285 m above sea level for the second site and 310 m above sea level for the first one.
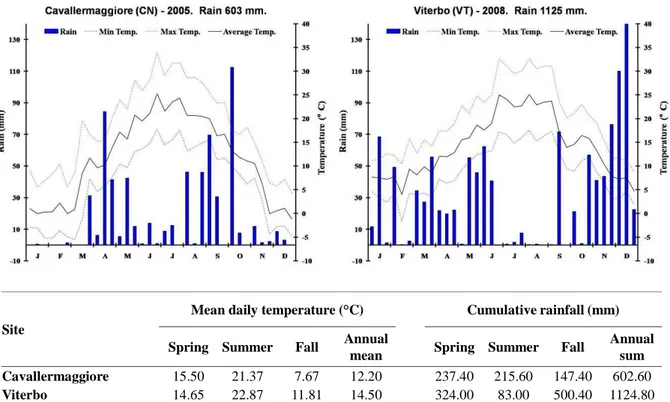
At the northern site in 2005 the mean meteorological conditions during the year was colder and the rainfall amounts were lower as compared to the central Italy location in 2008 (Figure 7), with more seasonality for the first location especially during spring and fall. The soil at the northern site was an alluvial soil with sandy-load texture while it was sandy silt in VT (Sabatti, personal communication).
Site
Mean daily temperature (°C) Cumulative rainfall (mm)
Spring Summer Fall Annual
mean Spring Summer Fall
Annual sum
Cavallermaggiore 15.50 21.37 7.67 12.20 237.40 215.60 147.40 602.60
Viterbo 14.65 22.87 11.81 14.50 324.00 83.00 500.40 1124.80
Figure 7. Meteorological characteristics of the two experimental sites in Italy where the POP5 Full-sib family
was studied. Data were obtained in 2005 (CV) from a nearby meteorological station and in 2008 (VT) from the Department of Crop Production (DIPROV) of University of Tuscia.
3.4.Protocol of bud set measures
The phenological measurements of bud set were done according to the protocol developed inside the POPYOMICS project (contract No. QLK5-CT-2001-00953, an EC funded research
33
program: http://www.soton.ac.uk/~popyomic/) in order to improve the phenotypic resolution of the distinctive phases observed during the formation of the apical bud in autumn and to evaluate the duration of bud development as separate character.
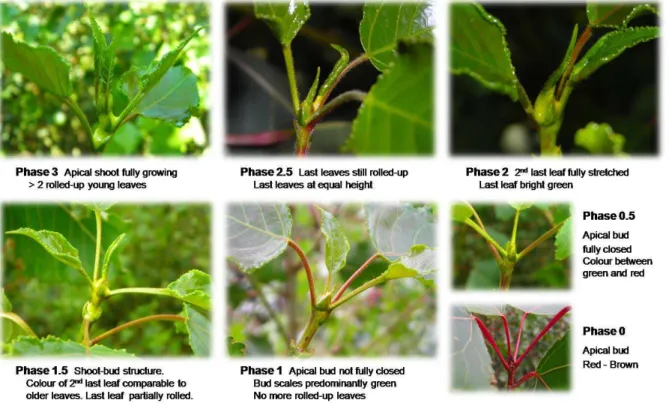
For this protocol (Figure 8) six representative phases (excluding stage 3 which represent the shoot during vegetation) characterizing the development and maturation of apical bud (Rohde
et al., 2011) were defined. The protocol covers the bud set process form the stage 2.5, which
represent the perception of critical day length and the onset of the phenological process, to the phase 0, the end of bud maturation.
Figure 8. The high resolution bud set scoring protocol. The first stage (phase 3) represent the vegetative apex in
fully growing stage. All pictures were made in individuals of Populus nigra L. during the phenological sampling.
Phases 1, 0.5, and sometime the stage 0, correspond to the most utilized model of bud set in some traditional studies of apical bud formation (Li et al., 1998 ; Frewen et al., 2000 ; Howe
et al., 2000 ; Rae et al., 2004), whereas the phase 1.5 represent the critical transition from
34
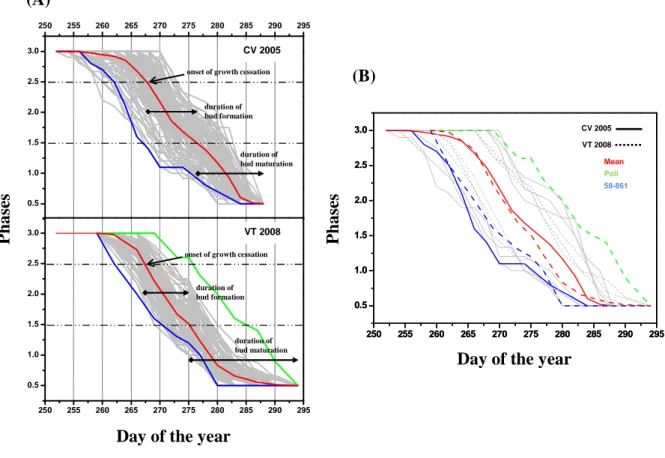
Since the last phase described in the protocol is only a change of colour, for our aim we decided to examine only the first five phases (from stage 2.5 to 0.5) and estimate indirect phenological traits such as the duration of the different phases described (duration of phase
2.5, duration of phase 2, duration of phase 1.5 and duration of phase 1), duration of subprocess 1 (cumulative days for each tree in phases 2.5, 2 and 1.5, i.e. the total amount of
the duration of the phase 2.5 and phase 2), that essentially describe change in the apical shoot, and duration of subprocess 2 (cumulative days for each tree in phases 1.5, 1 and 0.5, i.e. the total amount of the duration of the phase 1.5 and the phase 1) (Figure 9), refers to visible changes in the apical bud after the onset of its formation. These indirect traits were defined in order to widen the information that could be studied.
Phase 2.5 Phase 2 Phase 1.5 Phase 1 Phase 0.5
duration of subprocess 1
bud formation
duration of subprocess 2
bud maturation
duration of phase 2.5 + duration of phase 2 duration of phase 1.5 + duration of phase 1 duration phase 2.5 duration phase 2 duration phase 1.5 duration phase 1
Figure 9. The different traits analysed in this work.
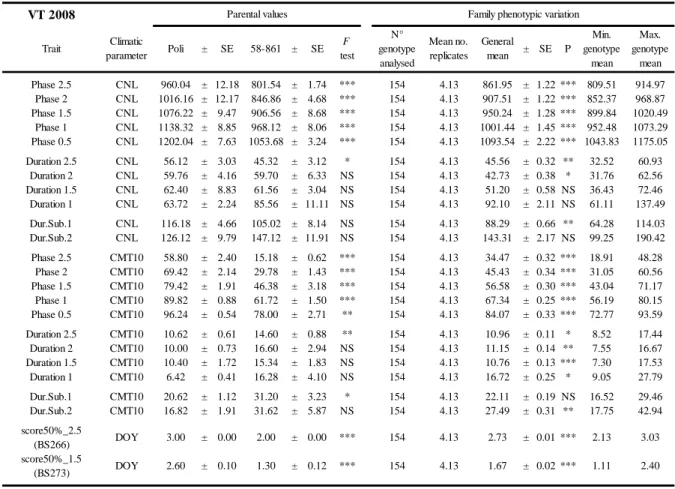
Moreover, only concerning the full-sib family POP5 experiment for which we had in both experimental trials an enough number of sampling days, the date of the year in which 50% of individuals had reached the onset of the phenological process and the day of transition to bud structure (score50%_2.5 and score50%_1.5) was calculated and the distribution of score analysed. These are two important breading values to compare different family and tools applicable in practical tree breeding strategies.
Phenological measurements for the northern location (CV) were started in autumn 2005, at the end of the first growing season of the second coppice rotation (i.e. Root 3 - Shoot 1, third growth year), and data were collected every two days from the beginning of September