UNIVERSITÀ DEGLI STUDI DELLA TUSCIA DI VITERBO
DIPARTIMENTO DI ECOLOGIA E SVILUPPO SOSTENIBILE
CORSO DI DOTTORATO DI RICERCA
ECOLOGIA E GESTIONE DELLE RISORSE BIOLOGICHE - XX CICLO.
Non-invasive diet analysis based on DNA Barcoding: the
Himalayan Brown Bears (Ursus arctos isabellinus) as a case
study.
BIO/O7 Coordinatore: Prof. Roberta Cimmaruta Tutor: Prof. Giuseppe Nascetti
Tutor: Dott. Pierre Teberlet
ABSTRACT I
RESUME III
RIASSUNTO V
LIST OF PAPERS VII
INTRODUCTION 1
DIET ANALYSIS 1
DNA BARCODING (PAPER IV) 2
Diet analysis using DNA barcoding. 5
HIMALAYAN BROWN BEAR 5
OBJECTIVES OF THE THESIS 7
MATERIAL AND METHODS 8
THE STUDY AREA 8
GENETIC METHODS 9
Non-invasive genotyping of brown bears in Deosai National Park 9
Diet analysis 10
The next-generation sequencing systems 10
Test of primer universality 11
The trnL approach: primer universality and parallel pyrosequencing for diet analysis 13
The trnL approach applied to Himalayan brown bear 15
MAIN RESULTS AND DISCUSSION 16
THE GENETIC STATUS OF BROWN BEAR POPULATION IN DEOSAI NATIONAL PARK (PAPER I) 16 RELIABILITY OF THE TRNL APPROACH FOR BARCODING (PAPER II) 17 DIET ANALYSIS (PAPER III) 18 DIET ANALYSIS OF HIMALAYAN BROWN BEARS (NAWAZ ET AL. IN PREPARATION) 24
CONCLUSIONS AND PERSPECTIVES 29
THE GENETIC STATUS OF HIMALAYAN BROWN BEAR POPULATION IN DEOSAI NATIONAL PARK 29 DNA BARCODING APPLIED TO DIET ANALYSIS 29
ACKNOWLEDGEMENTS 33
REFERENCES 35
Abstract
The study of food webs and their dynamics is fundamental to understand how the feeding habits of the different species can affect the community, thus improving our understanding of the functioning of the ecosystem as a whole. Furthermore, the study of feeding ecology becomes crucial when it concerns endangered species since a precise knowledge of their diet is to be gathered when designing reliable conservation strategies. A wide range of methodologies have been proposed for diet analysis, including simple ones, as visual observation of foraging behavior, and more complex ones such as Near Infrared Reflectance Spectroscopy and DNA based methods.
DNA barcoding, i.e. species identification using a standardized DNA region or markers, has recently received much attention and is being further developed through an international initiative called "Consortium for the Barcode of Life". When using DNA barcoding for diet analysis, the choice of the markers is crucial. The ideal DNA barcoding marker should meet several criteria. It should be variable among species, standardized, with enough phylogenetic information, extremely robust, and short enough to allow amplification of degraded DNA.
In this study we propose the trnL (UAA) intron as marker for plant DNA barcoding. The power and the limitations of this system were evaluated as well as the possibility of species identification with highly degraded DNA. The main limitation of this system is its relatively low resolution in discriminating closely related species. Despite the relatively low resolution, it has many advantages: the primers are highly conserved, the amplification system is very robust and it is able to work with much degraded DNA samples. This system has been coupled with massively parallel pyrosequencing technique. We demonstrate the efficiency of this new approach by analyzing the diet of various herbivorous species. The whole chloroplast trnL (UAA) intron (254–767 bp) and a shorter fragment of this intron (the P6 loop, 10–143 bp) were used in this study. For the whole trnL intron 67.3% of the species retrieved from GenBank were unambiguously identified and 19.5% for the P6 loop. The resolution is much higher after calibration of specific contexts using species originating from the same ecosystem.
Furthermore, the trnL approach was coupled with individual and sex identification using microsatellites polymorphism in the Himalayan brown bear (Ursus arctos
endangered and least studied. Here, populations have declined by more than half in the past century owing to habitat loss and fragmentation and human activity. Presently in Pakistan brown bear occur sparsely in seven small populations, with the largest isolate in the Deosai National Park. We examined this population using a combination of fecal DNA analysis and field data for which geographical location and date of sampling were available, with the aim to study individual and sexual differentiation in the diet, and also temporal and geographical variations. Twenty-eight individuals (16 male, 10 females and 2 unknown sex) were identified in this study with microsatellites markers. Only eight plant species were found represented in more than 50% of individual feces. Temporal differences were found with more energetic food detected before the hibernation periods.
Resumé
L'étude des réseaux trophiques et leur dynamique est fondamentale pour comprendre comment les habitudes alimentaires des différentes espèces peuvent influencer la communauté, afin d'améliorer notre compréhension du fonctionnement de l'écosystème dans son ensemble. En outre, l'étude de l'écologie alimentaire devient cruciale lorsqu'il s'agit des espèces en voie de disparition, une connaissance précise de leur alimentation doit être acquise lors de la conception des stratégies de conservation. Un large éventail de méthodes a été proposé pour l’analyse du régime alimentaire, y compris les plus simples, comme l'observation visuelle du comportement d’alimentation, et les plus complexes, comme la spectrométrie dans le proche infrarouge et les méthodes basées sur l'ADN.
"DNA barcoding" (Code barre d’ADN), c'est-à-dire l'identification des espèces en utilisant une région standardisée d'ADN ou des marqueurs standardisés, a récemment reçu beaucoup d'attention et est actuellement développé grâce à une initiative internationale appelée "Consortium for The Barcoding of Life". Lors de l'utilisation du "DNA barcoding" pour le régime alimentaire, le choix des marqueurs est crucial. Le marqueur idéal pour le "DNA barcoding" doit satisfaire plusieurs critères. Il doit être variable entre les espèces, standardisé, avec suffisamment d'informations phylogénétiques, très robuste, et suffisamment court pour permettre l'amplification de l’ADN dégradé.
Dans cette étude, nous proposons l’intron trnL (UAA) en tant que marqueur pour le "DNA barcoding" des plantes. Le pouvoir et les limites de ce système ont été évalués, ainsi que la possibilité d'identification des espèces avec de l'ADN fortement dégradé. La principale limitation de ce système est la relative faible résolution de discrimination des espèces très proches. En dépit de la résolution relativement faible, elle présente de nombreux avantages: les amorces sont hautement conservées, le système d'amplification est très robuste et il est capable de travailler avec des échantillons d'ADN très dégradés. Ce système a été couplé avec la technique du pyroséquençage. Nous avons démontré l'efficacité de cette nouvelle approche par l'analyse de l'alimentation de différentes espèces herbivores. L'ensemble des introns chloroplastique trnL (UAA) (254-767 pb) et d'un court fragment de cet intron (P6 boucle, 10-143 pb) ont été utilisés dans cette étude. Pour l'ensemble de l’intron trnL, 67,3% des espèces récupérées à partir de GenBank ont été identifiées sans ambiguïté et 19,5% pour la P6 boucle. La résolution
est beaucoup plus élevée après calibration sur des contextes spécifiques en utilisant des espèces originaires d'un même écosystème.
En outre, l’approche par le trnL a été associée à l'identification individuelle et le sexe en utilisant le polymorphisme de microsatellites dans l’ours brun himalayen (Ursus
arctos isabellinus). Parmi les populations mondiales d'ours bruns, celles d’Asie sont les
plus menacées et les moins étudiées. Ici, les populations ont diminué de plus de moitié au cours du siècle dernier en raison de la perte d'habitats, de sa fragmentation et de l'activité humaine. Actuellement, au Pakistan l'ours brun existe dans sept petites populations isolées, dont la plus grande est située dans le Parc National du Deosai. Nous avons examiné cette population au moyen d'une combinaison de l'analyse d'ADN des fèces et de données de terrain pour lesquelles les coordonnées géographiques et la date de prélèvement étaient disponibles, pour étudier la différenciation sexuelle et individuelle du régime alimentaire, ainsi que les variations temporelles et géographiques. Vingt-huit individus (16 mâles, 10 femelles et 2 de sexe inconnu), ont été identifiés dans cette étude avec les marqueurs microsatellites. Seulement huit espèces de plantes ont été trouvées représentées dans plus de 50% des fèces des individus. Des différences temporelles ont été trouvées, avec une alimentation plus énergétique avant la période d'hibernation.
Riassunto
Lo studio delle reti trofiche e della loro dinamica è fondamentale per comprendere come le abitudini alimentari delle diverse specie possono incidere sulla comunità, migliorando in tal modo la nostra comprensione sul funzionamento dell'ecosistema nel suo complesso. Inoltre, lo studio dell’ecologia dell’alimentazione diventa cruciale quando si tratta di specie in via d’estinzione, nelle quali una precisa conoscenza della loro dieta deve essere acquisita per definire una strategia di conservazione di successo. Una vasta gamma di metodi é stata proposta per l’analisi della dieta, che vanno da quelli più semplici, come osservazione visiva dell’animale durante il pasto, a quelli più complessi, come la Near Infrared Reflectance Spectroscopy e i metodi basati sul DNA.
Il DNA barcoding, cioè l’identificazione di attraverso una regione standardizzata di DNA o attraverso marcatori, ha recentemente ricevuto molta attenzione e si è ulteriormente sviluppato attraverso un'iniziativa del consorzio internazionale denominato "Consortium for Barcoding of Life". Quando si usa il DNA barcoding per l'analisi della dieta, la scelta dei marcatori è cruciale. Il marcatore ideale per il DNA barcoding deve soddisfare diversi criteri. Deve essere variabile tra specie, standardizzato, avente una sufficiente informazione filogenetica, molto robusto, e abbastanza corto da consentire l'amplificazione di DNA degradato.
In questo studio si propone l'introne trnL (UAA) come marcatore per il DNA barcoding delle piante. I vantaggi e gli svantaggi di questo sistema sono stati valutati come pure la possibilità di identificare di specie da DNA molto degradato. Il limite principale di questo sistema è la sua relativamente bassa risoluzione in discriminare specie filogeneticamente molto simili. Nonostante la relativa bassa risoluzione, il sistema ha molti vantaggi: i primers sono molto conservati, il sistema di amplificazione è molto robusto ed è in grado di funzionare con campioni di DNA molto degradati. Questo sistema è stato accoppiato con la tecnica di pirosequenziamento parallelo. Abbiamo dimostrato l'efficacia di questo nuovo approccio analizzando la dieta di varie specie d’erbivori. L'intero introne trnL (UAA) del cloroplasto (254-767 pb) e un breve frammento di questo introne (il P6 loop, 10-143 pb) sono stati utilizzati in questo studio. Per l'intero introne trnL, il 67,3% delle specie, recuperate da GenBank, sono statie indentificate in modo inequivocabile e 19,5% per il P6 loop. La risoluzione è molto più elevata dopo la calibrazione in contesti specifici utilizzando specie originarie dello stesso ecosistema.
Inoltre, il trnL approach è stato condotto in parallelo con identificazione degli individui e del sesso dell’animale tramite microsatelliti nell’orso bruno imalaiano (Ursus arctos isabellinus). Tra le popolazioni d’orso bruno al mondo, quelle in Asia sono le più minacciate e meno studiate. Qui, le popolazioni sono diminuite di oltre la metà nel secolo passato, a causa della frammentazione, la perdita di habitat e le attività umane. Attualmente in Pakistan, l’orso bruno è presente in sette piccole popolazioni isolate, con la più grande nel Parco Nazionale del Deosai. Abbiamo esaminato questa popolazione utilizzando una combinazione d’analisi di DNA da feci e di dati di campo per i quali la localizzazione geografica e la data di campionamento erano disponibili, con l'obiettivo di studiare differenze nella dieta a livello individuale tra i due sessi, e anche variazioni geografiche e temporali. Ventotto individui (16 maschi, 10 femmine e 2 di sesso sconosciuto) sono stati identificati in questo studio con i marcatori microsatelliti. Solo otto specie di piante sono state trovate rappresentate per oltre il 50% degli individui. Differenze temporali sono state riscontrate, con un consumo di cibo più energtico prima del periodo del letargo.
List of papers
PAPER I
Eva Bellemain, Muhammad Ali Nawaz, Alice Valentini, Jon E. Swenson, Pierre Taberlet. 2007. Genetic tracking of the brown bear in northern Pakistan and
implications for conservation. Biological Conservation 134: 537 –547.
PAPER II
Pierre Taberlet, Eric Coissac, François Pompanon, Ludovic Gielly, Christian Miquel, Alice Valentini, Thierry Vermat, Gérard Corthier, Christian Brochmann and Eske Willerslev. 2007. Power and limitations of the chloroplast trnL (UAA) intron for
plant DNA barcoding. Nucleic Acids Research 35, No. 3 e14.
PAPER III
Alice Valentini, Christian Miquel, Muhammad Ali Nawaz, Eva Bellemain, Eric Coissac, François Pompanon, Ludovic Gielly, Corinne Cruaud, Giuseppe Nascetti, Patrick Winker, Jon E. Swenson, Pierre Taberlet. New perspective in diet analysis
based on DNA Barcoding and large scale pyrosequencing. Molecular Ecology
(submitted).
PAPER IV
Alice Valentini, François Pompanon, Pierre Taberlet. DNA Barcoding for ecologists. Trend in Ecology and Evolution (submitted).
Introduction
Diet analysis
Trophic relationships are of prime importance for understanding ecosystem functioning (e.g. Duffy et al. 2007). They can only be properly assessed by integrating the diets of animal species present in the ecosystem. Furthermore, the precise knowledge of the diet of an endangered species might be of special interest for designing sound conservation strategies (e.g. Marrero et al. 2004; Cristóbal-Azkarate & Arroyo-Rodrígez 2007).
Several methods have been developed to evaluate the composition of animal diets. The simplest approach is the direct observation of foraging behavior. However, in many circumstances, direct observation is difficult or even impossible to carry out. It is often very time consuming or even impracticable when dealing with elusive or nocturnal animals, or when an herbivore feeds in a complex environment, with many plant species that are not spatially separated. The analysis of gut contents has also been widely used to assess the diet composition of wild herbivores foraging in complex environments (Norbury & Sanson 1992). Such an approach can be implemented either after slaughtering the animals, or by obtaining the stomach extrusa after anesthesia. Feces analysis represents an alternative, non-invasive, and attractive approach. Up to now, four main feces-based techniques have been used.
First, for herbivores, microscope examination of plant cuticle fragments in fecal samples has been the most widely employed technique (Holechek et al. 1982; McInnis
et al. 1983). Some herbivores do not masticate their food into small fragments, allowing
plants present in the feces to be identified visually (Dahle et al. 1998). However, this method is very tedious to perform, and requires a considerable amount of training while a variable proportion of plant fragments remains unidentifiable.
Another method is stable isotope analysis. This approach is based on the fact that stable isotopes ratios in tissue and feces are related to the organism diet (DeNiro & Epstein 1978, 1981). Stable carbon isotopes can distinguish marine from terrestrial dietary protein, and C3 plants that fix CO2 by Calvin cycle (most grasses, trees, roots, and tubers) from C4 plants (such as maize), which use dicarboxylic acid pathway. Nitrogen isotopes can successfully distinguish plant from animal protein and thus define the trophic level and the position an organism occupies in the food chain (DeNiro & Epstein 1981). This method was used for inferring the diet of several species, including
black and brown bears (Hobson et al. 2000), red-backed voles (Sare et al. 2005), blue and black wildebeest (Codron & Brink 2007), etc. This method can be used as a simple tool for investigating the passage rate of plants in the digestive track (Sponheimer et al. 2003). The main advantage of this technique is that diet can be also inferred from hairs and bones, and surveys a very large time span. This method can be used to infer diet of ancient remains (Feranec & MacFadden 2000) or mummies (Wilson et al. 2007). The main disadvantage is that is not possible to perform identification at species level.
The third technique is based on the analysis of the natural alkanes of plant cuticular wax (Dove & Mayes 1996). This wax is a complex chemical mixture containing n-alkanes (saturated hydrocarbons) with chain lengths ranging from 21 to 35 carbons, with the odd-numbered molecules largely predominating the even-numbered ones. There are marked differences in alkane composition and concentrations among plant taxa (families, genera, species), and thus the alkane fingerprints represent another chemical approach for estimating the species composition. This method is very common for study ruminant diet (e.g. Ferreira et al. 2007a, b; Piasentier et al. 2007). However, the approach is limited when the animal feeds in complex environment, because composition and concentration of the chemical markers are confounded. In this case it may be extremely difficult or impossible to have a discrimination of the eaten species (Dove & Mayes 1996).
The fourth approach is the Near Infrared Reflectance Spectroscopy (NIRS) (e.g. Foley et al. 1998; Kaneko & Lawler 2006). Near infrared spectra depend on the number and type of H chemical bonds (C-H, N-H and O-H) present in the material being analyzed. After an appropriate calibration, the spectral features are used to predict the composition of new or unknown samples. The most common use of NIRS for diet analysis is the estimation of nutritional components in animal feeds, including total nitrogen, moisture, fiber, starch, etc. However this technique has several limitations. Particle size variation and non homogeneity can bias the analysis. The calibration model is a crucial and challenging step, specific to the animal under study and to the species eaten.
A quite recent approach is DNA barcoding.
DNA Barcoding (Paper IV)
The term DNA barcoding is of recent use in the literature (Floyd et al. 2002; Hebert et
and automatable species identification (Hebert & Gregory 2005). However, DNA barcoding is not a new concept. The term "DNA barcodes" was first used in 1993 (Arnot et al. 1993) in a paper that did not receive very much attention from the scientific community. Actually, the concept of species identification using molecular tools is even older, and came before the invention of the Sanger sequencing technique (Sanger et al. 1977). However, the “gold age” of DNA barcoding began in 2003 (Hebert
et al. 2003) and the number of publications on the subject has grown exponentially, with
now more than 250 articles published.
The now well-established Consortium for the Barcode of Life (CBOL; http://barcoding.si.edu/), an international initiative supporting the development of DNA barcoding, aims to promote global standards and to coordinate research in DNA barcoding. For animal, the gene region that is proposed as the standard barcode is a 650 base-pair region in the mitochondrial (mt) cytochrome c oxidase 1 gene (“COI”) (Hebert et al. 2003). For plants, the situation is still controversial, but recently it has been proposed to use three coding chloroplast DNA regions that together would represent the standard barcode: rpoC1, matK, and either rpoB or psbA-trnH (Chase et
al. 2007).
As pointed out by Chase et al. (2005), taxonomists are not the only potential users of DNA barcode, since it may be helpful for scientists from other fields (e.g. forensic science, biotechnology and food industry, animal diet). Taxonomists are concerned in DNA barcoding “sensu stricto". Other scientists will be more interested in DNA barcoding “sensu lato” i.e. by DNA-based taxon identification using diverse techniques than can lies outside the CBOL approach (such as RFLP, AFLP, SSCP, etc). The difference between the two approaches mainly relies on different priorities given to the criteria used for the choice of the ideal barcoding system. It should be sufficiently variable to discriminate among all species, but conserved enough to be less variable within than between species; it should be standardized with the same DNA region used for different taxonomic groups; the target DNA region should contain enough phylogenetic information to easily assign species to its taxonomic group (genus, family, etc.); it should be extremely robust, with highly conserved priming sites, and highly reliable DNA amplification and sequencing. This is particularly important when using environmental samples where each extract contains a mixture of many species to be identified at the same time. The target DNA region should be short enough to allow
amplification of degraded DNA as usually DNA regions longer than 150 bp are difficult to amplify from degraded DNA.
Thus, the ideal DNA marker should be variable, standardized, with enough phylogenetic information, extremely robust and short. Unfortunately, such an ideal DNA marker does not exist (or at least has not been found up to now). As a consequence, according to the scientific and technical context, the different categories of users (e.g., taxonomists, ecologists, etc.) will not give the same priority to the five criteria listed above. Taxonomists are more interested in standardized markers that express a high level of variation with sufficient phylogenetic information, following the CBOL strategy, while other scientists may favor highly robust procedures even if the identification to species level is not always possible.
But when an ecologist needs to use DNA barcoding for species identification? When the use of non-invasive samples is necessary (i. e. only traces of the organism are present, the animal should not be disturbed or the species is endangered) or when the species identification is not possible or easy on morphological criteria. Barcoding has the advantage that it can be used as a non-invasive technique. It will be useful as tool when only traces of an organism are present in nature, for example (Valiere & Taberlet 2000) utilized mtDNA control region for identifying species (in their case wolf and dog) from urine traces left by the animals on the snow.
The study of endangered species is one of the central topics of most of the ecologists, and in this case the use of non-invasive molecular tools can be vital for the species studied. In some case the capture of the animal can lead to the injury or the death of it, and in the cases of endangered species this loss will have a huge cost for the species. In their article (Sugimoto et al. 2006) describe a non-invasive technique to identify two endangered species that live in sympatry from their feces samples: Amur leopard Panthera pardus orientalis, the world most endangered species of leopard, and Siberian tiger Panthera tigris altaica.
DNA Barcoding became fundamental when the species identification is not possible or easy on morphological criteria. In many cases the species cannot be identified in all life stages or only one sex has the keys characters for the identification.
In Paper IV we review some studies that have applied DNA barcoding from an ecological point of view.
Diet analysis using DNA barcoding.
DNA barcoding is a very useful tool to establish the diet of an individual from its feces or stomach contents. This is really helpful when the food is not identifiable by morphological criteria, such as in liquid feeders like spiders (Augusti et al. 2003). This technique also provides valuable information when eating behavior is not directly observable, as in the case of krill eating diatoms (Passmore et al. 2006), giant squid (Architeuthis sp.) in the sea abyss (Deagle et al. 2005), or deep sea invertebrates . Most of the studies that use DNA markers for diet analysis are based on carnivorous animals (e.g., insects (Pons 2006, Symondson 2002), whale and Adelie penguin (Pygoscelis
adeliae) (Jarman et al. 2004)). Fewer studies were carried on herbivorous animals (e.g.
Bradley et al. 2007). DNA barcoding approach was also successfully applied to study the diet from ancient coprolites (Hofreiter et al. 2000) and human mummies (Rollo et
al. 2002; Poinar et al. 2001).
There are two different strategies when using molecular tools for diet analysis: the use of group-specific primers (Nystrom et al. 2006) or the use of universal primer. When analyzing the diet of the Macaroni penguin (Eudyptes chrysolophus) using feces as a source of DNA, Deagle et al. 2007 applied both group-specific and universal primers. The results obtained with five different groups of specific primers were similar to those involving universal (for fish, cephalopods and crustaceans) 16S rDNA primers and subsequent cloning of the PCR products. In general, the use of specific primers requires an a priori knowledge of the animal’s diet. This is not possible in most cases and makes the “universal” approach more appropriate.
Himalayan brown bear
Brown bear is one of the eight different species of bears in the word, and it is widely distributed on the northern hemisphere, and it is found in Europe, North America and Asia. In Asia the brown bear (Ursus arctos) is widely distributed from the tundra and boreal forests of Russia in the north to the Himalayas in the south (Servheen 1990). Among world brown bears populations, those in Asia are the most endangered and least studied. Here, populations have declined by more than half in the past century (Servheen, 1990; Servheen et al., 1999).
Himalayan brown bear (Ursus arctos isabellinus) is a subspecies of brown bear distributed in small populations in Afghanistan, China, India, Kazakhstan, Kirghizstan, Nepal, Uzbekistan, Pakistan, and Tajikistan. This bear subspecies is threatened with
extinction and for this is listed in the Appendix I of CITES (Convention on International Trade in Endangered Species of Wild Fauna and Flora). Historically, it occupied the western Himalaya, the Karakoram, the Hindu Kush, the Pamir, the western Kunlun Shan and the Tian Shan range in southern Asia, but today its geographical distribution has been strongly reduced, compared with its historically range. In Pakistan brown bear are found in sub-alpine and alpine areas (2600-5000m) and its primary habitat are alpine meadows (51,000 km²) and blue pine forest (19,000 km²) (Nawaz 2007). Approximately 150-200 bears survive in seven isolated (or with limited connections) populations, Himalayan, Karakoram, Hindu Kush, Kalam, Indus Kohistan, Kaghan, Neelam Valley. Himalayan, Karakoram, Hindu Kush, and Neelam Valley are divided in sub-population each. Deosai National Park, Minimerg and Nanga Parbat are sub-populations of Himalayan population. Karakoram host Central Karakoram National Park and Khunjerab National Park, a Hindu Kush host Ghizer, Karambar, Tirch Mir sub-populations. Gumot, Shontar Valley and Gurez Valley are the subpopulations of Neelam Valley (Nawaz 2007). Except for the Deosai National Park subpopulation, that is increasing (Nawaz et al. unpubblish), all the subpopulations and populations are declining and they have a very small size, with only 5 bears recorded in some cases. The Deosai National Park supports the largest population of brown bears in the country (with 40-50 bears recorded (Paper I and Nawaz 2007). The brown bear population in this park has been protected and closely monitored since 1993, when bear population was composed only by 19 individual, after that the population started to recover gradually (Himalayan Wildlife foundation 1999a)
Brown bears in Pakistan are declining for habitat loss and fragmentation, and human activity, which include commercial poaching of cubs and body parts, bear baiting and hunting (Nawaz 2007). The most used habitat for brown bear are alpine meadows in Northern Area of Pakistan, but those areas are now used as grazing areas due to the expansion of nomadic and transhumance grazing because of the deficiency of natural grazing areas after the nearly doubling of livestock population (Ehlers & Kreutzmann 2000). Bear in the region is hunted, and poached in protected areas, such as Deosai National Park, for sport (mostly by military officers), by villagers, that feel brown bears as a danger for their livestock, and for commercial purpose (Nawaz 2007). Climate change will influence brown bear population, by the reduction of alpine tundra, and a northward and upward shift of coniferous biome (Hagler Bailly Pakistan 1999).
The Himalayan brown bears are mainly vegetarian with very low dietary meat (Nawaz et al. in preparation), and this characteristic gave it the name of spang drenmo (vegetarian bear) in the Balti language (the dialect of the Northern Area region), for distinguishing it from Asiatic black bear, shai drenmo (carnivorous bear) (Nawaz 2007). The Deosai population has a very low reproductive capacity, with smaller litter size and longer maternal care than others brown bears populations (Nawaz et al. unpublished), probably due to its diet. In fact it was demonstrated that the reproductive success in bear is linked to the amount of meat ingested (Bunnel & Tait 1981, Hilderbrand et al. 1999). Due to its particular diet Deosai brown bears spend most of its daily activity foraging (67%, mainly grazing) (Nawaz & Kok 2004). Therefore, the study of its diet will be fundamental for assessing good conservational plans for this population.
Objectives of the thesis
In this thesis we will use molecular tools for better understand the biology and ecology of Himalayan brown bear. The thesis has two main objectives.
1. Determinate the genetic status and the size of the brown bear population in Deosai National Park (Paper I).
2. supply a new tool for assessing the diet of the brown bear population
To achieve the second objective the DNA barcoding approach is proposed. We review the possible applications of this approach for ecologists (Paper IV). After, we propose a new system for plant barcoding (Paper II). Finally we test this approach for study the diet of different herbivorous animals (Paper III)
Material and Methods
The study area
The study for population analysis was conducted in the Deosai National Park, Northern Areas, Pakistan. Deosai National Park is a plateau in the alpine ecological zone encompassing about 20,000 km², situated 30 km south of Skardu and 80 km east of the Nanga Parbat Peak in Pakistan. Elevations range from 3500 to 5200m and about 60% of the area lies between 4000 and 4500 m. The Deosai Plateau is situated between two of the world’s major mountain ranges, the Karakoram and Himalaya. The area receives abundant snow fall and rain, with annual precipitation in Deosai in the range of 510– 750 mm, which falls mostly as snow (Himalayan Wildlife Foundation, 1999b). Water percolates in the soil and emerges during spring along ravines and in open grassy valley. Where water emerges, the areas are covered by deep grassland and numerous flowering plants. Recorded mean daily temperatures range from -20 C° to 12 C°. The Deosai plains are covered by snow during winter months between November and May, and life on the plateau is confined to a window of five months.
Different habitats are present in Deosai Plateau: open sunny sites, rock slops, steppes and marshy places. The flora can be divided in three categories: weeds, desert type native plants and high alpine plants. The firsts are found close to cultivated fields, the seconds on cliff, sandy soil and on the streams and last type are found near melting snow and glaciers along moraines. The plants most represented are herbs and small shrubs. The only trees are birches, junipers and conifers, and they occur in the valley of the lower limits of Deosai, but they are very rare. The high elevation and the strong wind prevent the growth of trees on higher areas of the plateau. The plants are generally dwarf and tufted, owing to severe wind and frost, and are perennials, having a brief growing period. (Woods et al.1997).
The biota includes plants and animals from Karakoram, Himalaya and Indus Valley. As a result, Deosai is a centre of unique biota in northern Pakistan. The documented biota of Deosai National Park includes 342 species of plants, 18 of mammals, 208 of birds, three of fishes, one of amphibian, and two of reptiles (Woods et
Genetic methods
Non-invasive genotyping of brown bears in Deosai National Park
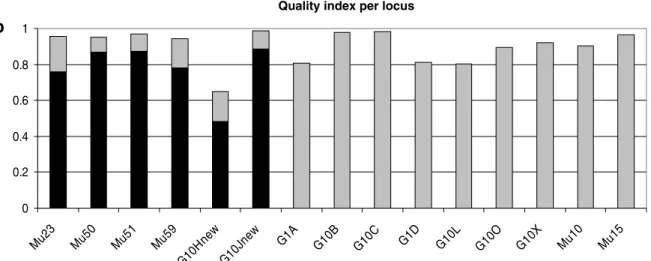
One hundred thirty six feces were collected in the field and used as the source of DNA. All samples were preserved in 95% alcohol until extraction. The extraction was performed using Qiamp DNA Stool Kit (Qiagen GmbH, Hilden, Germany). This study was divided in two parts: the first one was focused on the identification of the differents individuals from feces samples and the second was focused on the population genetic study. For individual identification six microsatellites loci were analysed. The number of loci studied is a compromise between the probability of identity and the probability of genotyping errors. As the number of loci increase, the probability of identity decrease, but the genotyping error rate increases (Pompanon et al. 2005). Because of the poor DNA conditions, we decided to follow the protocol already successfully used for brown bear individual identification from feces samples in the Scandinavian population (Piggott et al. 2004, Bellemain & Taberlet 2004). Four primer pairs were already described in Bellemain & Taberlet (2004) (Mu23, Mu50, Mu51, and Mu59) and 2 microsatellite primer pairs were specially designed for this study (G10H, G10J, from Paetkau & Strobeck (1994) and Paekau et al. (1995)), in order to obtain a probability of identity low enough for discriminate among individuals. For sex identification the SRY-primers (Bellemain & Taberlet 2004) were used. Amplification was carried using the protocol described in Taberlet et al. 1996. Quality index (Miquel et al. 2006) was calculated for each sample. Only the samples with a quality index above 0.5 were retained for the population genetic analysis. For this second part of the study the number of loci analysed was increased, because the probability of error rate was reduced after the selection based the quality index. Others 12 loci were added: G1A, G1D, G10B, G10C, G10L, G10P, G10X, G10O (Paetkau et al. 1995; Paetkau & Strobeck 1994) and Mu05, Mu10, Mu15, Mu61 (Taberlet et al. 1997). The amplifications were carried out using a modified protocol from Waits at al. 2000. One primer of each pair was synthesized with a fluorescent dye group (6-FAM, TET or HEX) on the 5’ end to allow detection and sizing of fragments on ABI Prism 3100 automatic sequencer. The gels were analyzed with GeneMapper version 3.0 when using the ABI Prism 3100. A new quality index for this second analysis was calculated and 3 microsatellites loci were discarded, because their QI was below 0.6.
The probabilities of identity, i.e. the probability to obtain two identical genotypes by chance, (PI; Paetkau & Strobeck (1994); PIsib, for siblings; Waits et al. (2001)) were low: PI=1.881e-05 and PIsib=1.206e-02 for the 6 microsatellites loci set, 5.827e-10 and 1.329e-04 respectively for the 15 microsatellite loci set. This allowed to perform reliable relatedness analysis.
Population size was estimated, as in Bellemain et al. (2005), using two different rarefaction indices, the one proposed by Kohn et al. 1999 and the one proposed by Eggert et al. 2003. In the Kohn methods the population size is estimated as the asymptote of the relationship between the cumulative number of unique genotype and the number of samples typed. The estimates are made using the equation y=ax/(b+x), where a is the asymptote, x the number of feces sampled, y the number of unique genotypes, and b the rate of decline in the value of slope. The Eggert methods is based on the equation y = a(1 - ebx). The small sample size and small number of recaptures not allow performing the analysis with the MARK method (White & Burnham 1999), which was suggested for population size analysis from fecal samples (Bellemain et al. 2005). The genetic diversity was calculated for this population and compared with other brown bear populations in Europe and North America (Taberlet et al. 1997; Peatkau et
al. 1998; Waits et al. 1998; Waits et al. 2000). Hardy-Weinberg equilibrium, linkage
disequilibrium were analyzed in the Deosai bear population, based on the 15 loci genotypes, we ran population genetic analyses using the software GENEPOP version 3.4 (Raymond and Rousset, 1995) and GENETIX version 4.02 (Belkhir et al., 1996– 2004). For detect a signature of bottleneck and date of this potential bottleneck in the Deosai bear population we used a bayesian approach, implemented in the MSVAR program (Beaumont, 1999).
Diet analysis
The diet study using DNA barcoding from fecal samples coupling universal primer approach and next generation sequencing technique was first implemented in this thesis (Papers II and Paper III).
The next-generation sequencing systems
Recently several new techniques were implemented, all based on a massively parallel approach, and sequencing individual molecules (with or without an amplification step) (e. g. SolexaTM, SOLiD™ DNA Sequencer, HeliscopeTM, 454 GS FLXTM, but see Box 3
in Paper IV). All new sequencers but one produce very short fragments (25-35 bp). The only system that allows sequencing longer fragments is the 454 GS FLX (Roche) that currently deliver 200-300 bp fragments (an upgrade of the system is already announced, multiplying by about ten the total output, with fragments of 400 bp). This new method is a combination of an emulsion-based method to isolate and amplify DNA fragments, and pyrosequencing in picolitre-sized wells. Single strand DNA is generated by fragmentation of the genome, or amplification by PCR. Subsequently each fragment is capture on its own beads and, within the droplets of an emulsion, clonally amplified. This part is defined as emulsion PCR (emPCR). Once the clonally reaction had finish the emulsion is broken, the DNA strands are denatured, and beads carrying single-stranded DNA clones are loaded into wells of a fiber-optic slide with beads carrying immobilized enzymes required for sequencing. The slide is loaded in the sequencer and cyclically nucleotides in a fixed order (TACG) flow perpendicularly and simultaneously to all the wells. If the nucleotide that flow in the well is complementary to the template strand is added to the strand generating a chemiluminescent signal that is recorded by the CCD camera in the instruments. The intensity of the signal is proportional at the number of nucleotides added to the strand. The results are shown in a flowgram that gives the sequence of the fragments analyzed (Margulies et al. 2005). Using this method c.a. 400,000 sequences are obtained per run. The enormous amount of sequences that are product without cloning step make this new technique suitable for environmental barcoding studies where there is the need to deal with samples composed by mixed species (e.g. of deep sea biodiversity (Sogin et al. 2006)).
Test of primer universality
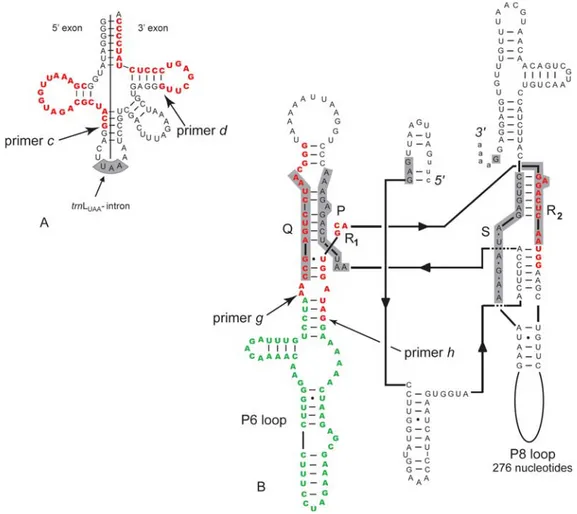
We have chosen to amplify and sequence trnL locus on chloroplast for several reason. Universal primers for this region were designed more than15 years ago (Taberlet et al. 1991), and subsequently extensively used, mainly in phylogenetic studies among closely related genera and species (Gielly & Taberlet 1996). The evolution of the trnL (UAA) intron has been thoroughly analyzed and is well understood (Quandt & Stech 2005; Quandt et al. 2004). Furthermore, this region has an alternation of conserved and variable regions (Quandt et al. 2004), as a consequence, new versatile primers that will amplify can be easily designed in the conserved region.
The power and the robustness of the trnL intron for DNA barcoding were first evaluated with the data available in public sequences databases. PCR were simulated on
the full plant division found on GenBank download from NCBI server on December 14, 2005 (ftp://www.ncbi.nlm.nih.gov/genbank), that correspond to 731,531 entries, using ePCR (electronic PCR) software, specifically developed (Paper II). This software allows use very short sequences as a query, to specify maximum mismatch count, minimum and maximum length of the amplified region and takes care also to retrieve taxonomic data from the analyzed entries. ePCR was applied on GenBank data, first with the c and d primers (Taberlet et al. 1991) that amplify the entire intron, then with the primers designed for the amplification of a shorter internal region of this intron, the P6 loop (g and h, Figure 1 and Paper II), then on a short rbcL fragment with the h1aF and h2aR primers, used in study with very degraded DNA (Poinar et a.l 1998), and finally with eight primer pairs found in Shaw et al. 2005 (psbB-psbH, rpoB-trnC (GCA), rpS16 intron, trnD (GUC)-trnT (GGU), trnH (GUG)-psbA and trnS
(UGA)-trnfM (CAU)), that were previously suggested for phylogenetic studies on plants.
The power and the robustness were evaluated also using two specific datasets. The first dataset was implemented by sequencing the whole intron (using c and d primers) for 132 artic plant samples (GenBank accession numbers DQ860511- DQ860642). The second one was build retrieving the sequences of the 72 plants used in the food industry from GenBank, and sequencing 7 plants species (cacao, beet, strawberry, apricot, sour cherry, garden pea, potato) (GenBank accession numbers EF010967- EF010973). The universality of the four primers c, d, g and h was examined by comparing their sequences with homologous sequences, either from GenBank (for primers c, d, g and h) or produced in this study (for primers g and h). Finally, the robustness of the new pair of internal primers (g and h) was tested applying this approach to different substrates supposed to contain highly degraded DNA: processed food (four samples: brown sugar from sugar cane, cooked potatoes, cooked pasta and lyophilized potage), human feces (two samples) and permafrost samples (four samples).
Figure 1 Positions of the primers c and d on the secondary structure of the trnL (UAA) exon (A) and of
the primers g and h on the secondary structure of the trnL (UAA) intron (B) for Nymphaea odorata (modified from Borsch et al. (2003)).
The trnL approach: primer universality and parallel pyrosequencing for diet analysis
In this second part of the diet analysis we coupled the universal amplification method using the P6 loop of the chloroplast trnL (UAA) intron (as described in Paper II) with the new highly parallel sequencing systems (Margulies et al. 2005) for describe a universal method for diet analysis of herbivorous animals. A total of 36 feces samples, form different herbivorous species (mammals, birds, mollusks and insects), were collected for the analysis as described in Paper III. For mammals, we sampled 12 feces from golden marmots (Marmota longicauda) in the Deosai National Park (Pakistan), with no more than one feces per marmot colony. We also analyzed 12 faeces from brown bears (Ursus arctos) collected in the same area, and previously used for genotyping analysis in Paper I. For birds, we used six capercaillie (Tetrao urogallus) samples previously analyzed in Duriez et al. (2007), four from the French Pyrenees (T.
u. aquitanus) and two from the Corinthian Alps in Austria (T. u. major). For the
invertebrates, we collected three grasshopper feces (two from Chorthippus biguttulus, one male and one female, and one from Gomphocerippus rufus) and three mollusc faeces (from the snail Helix aspersa, and from the slugs Deroceras reticulatum and
Arion ater). DNA from feces was extracted using DNeasy Tissue Kit (Qiagen GmbH,
Hilden, Germany), and not Qiagen Stool Kit, as in Paper I, because during a pilot experiment, we noticed that samples extracted with this kit systematically contained potato DNA, most likely coming from the "inhibitex" pill used during the extraction process. Qiagen technical support confirmed that "it cannot be ruled out that Inhibitex may contain DNA from plants".
In order to more precisely assess the diet of brown bears and golden marmots in Deosai National Park, a sequences database specific of the plants of this environment was constructed. Leaves of 91 plant species, that represent the most common species in Deosai plains, were collected and identified by three botanists (Dr Muhammad Qaiser, Dr Muqarrab Shah, and Dr. Mir Ajab Khan). The database was elaborated by sequencing the whole chloroplast trnL (UAA) intron of these species using the c-d primer pair (Taberlet et al. 1991).
The amplification from fecal samples was carried using universal primers for plants (g and h) using a modified PCR protocol, were the elongation step was removed for avoiding +A artefact (Brownstein et al. 1996; Magnuson et al. 1996). Each sample was amplified with primers g and h (Paper II), modified by the addition of a specific tag (5'-CCNNNN-3') on the 5' end in order to allow the recognition of the sequences after the pyrosequencing. The first two base of the tag were added, because previous study on 454 tagging system had shown an overrepresentation of sequence with 5’-CN tags (Binladen et al. 2007). Large-scale pyrosequencing was carried out on the 454 life sciences® technique (Margulies et al. 2005) following manufacturer's instructions, and using the GS 20 (Roche, Basel, Switzerland) for marmot and bear, and the GS FLX (Roche, Basel, Switzerland) for other samples. The plant taxa were then identified by comparing the sequences obtained either with public databases (GenBank, EMBL, etc.), using MEGABLAST algorithm (Zhang et al. 2000), and/or with a database made for this purpose.
The trnL approach applied to Himalayan brown bear
For brown bears all samples that were successfully amplified in Paper I (63 samples) were analysed using the trnL approach, Of the total of brown bear samples 12 samples were used for describing the trnL approach applied to diet analysis in Paper III.
Difference at sample and individual level in diet was tested using a correspondence analysis (Benzécri 1973) with the function dudi.coa implemented in ade4 package in R software version 2.4.0 (http://www.r-project.org/) using plants species, families and groups as variables. Plants were divided in five different groups: Graminoid, Forbs, Fruits, Browse, Tree and Other plants.
For investigating sex preferences in major diet groups, we arranged data into sex x presence/absence x k table, with k= number of plant regular species. Regular plant species (with ≥10% overall frequency) in diet were set as Z variable. Table analysis was run using PROC FREQ in SAS and Breslow-Day statistics was computed to determine if there was a homogenous relationship among sexes. We also computed Cohran-Mantel-Haenzel (CMH) statistics to investigate conditional independence between X and Y at each level of Z (Agresti 1996).
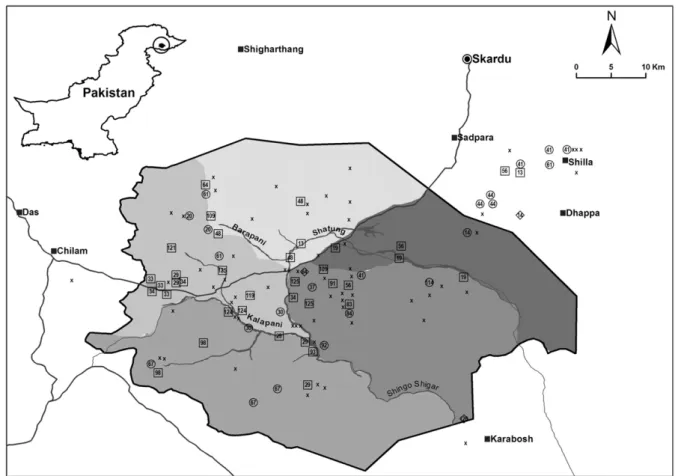
Data were grouped according to months of sampling (July through September) to determine the temporal trend in diet selection. We had too few samples for October, which were included in September. Locations of fecal samples were plotted on a vegetation map in Arc GIS (ESRI Inc., 2006) to determine their habitat types (marshy, grassy, stony, rocky, valley). Habitat differences in diet contents were investigated counting the number of species and families in each group.
Main Results and Discussion
The genetic status of brown bear population in Deosai National Park
(Paper I)
Totally, 136 fecal samples were collected and 63 (46%) of those samples were successfully amplified for 4–7 loci (including the SRY sex locus), and 28 individual genotypes were obtained (16 males, 10 females and 2 individuals of unknown sex). The amplification success was correlated negatively with the age of fecal samples. Amplification success was relatively good (58%) for feces that were less than 2–3 days old while samples older than one week had a poor amplification success.
Population size estimates provided by the two rarefaction indices are in the same order of magnitude as the numbers derived from field censuses, which gives us confidence that those results are realistic (Kohn’s estimate of 47 bears (95% CI: 33– 102), Eggert’s estimate of 32 bears (95% CI: 28–58), and 38 bears from the census 2004 (Nawaz et al. 2006)). Usually field methods give underestimates of wild populations, particularly for elusive animals (Solberg et al. 2006), but in our case several factors contributed to the realistic estimates of visual census: the open terrain of the Deosai plateau, the small population size, the presence of distinctive marks on many bears, and the expertise of the field staff. We conclude that approximately 40–50 bears were present in the park in 2004.
The results from the bottleneck analysis suggested that a decline in the Deosai population occurred approximately 80–100 generations ago. This period approximately corresponds to 800– 1000 years ago, assuming a generation time of 10 years. The ancestral population (before the decline; N1) was estimated to 10,000–12,500 individuals, which gives a density of about 55 bears per 1000 km². These results are consistent with previous knowledge on ancient population distributions (Nawaz 2007). The 200–300-fold decrease during the last thousand years was probably due to both natural (climatic and geological) and socio-political factors, such as the ‘‘little ice age’’ (1180–1840 AD; Kuhle 1997; Esper et al. 2002; Mackay et al. 2005), the influence of growing human population, the large deforestation in the Middle Ages (Bertrand et al. 2002), political unrest, and the spread of firearms in the late 19th century.
The population genetics analyses revealed that the level of nuclear genetic diversity of the Deosai population is globally lower than brown bear populations
considered to have a good conservation status, such those in Scandinavia or North America (Taberlet et al. 1997; Peatkau et al. 1998; Waits et al. 1998; Waits et al. 2001). However, this population is in Hardy Weinberg equilibrium and its level of relatedness is similar to that of the Scandinavian brown bear population. Therefore, the Deosai bear population does not appear to be at immediate risk of inbreeding depression. Its level of genetic diversity is comparable to the brown bear population in the Yellowstone area, USA, which has become an isolated remnant, separated from other brown bears for nearly a century (Paetkau et al. 1998). Furthermore four individuals in our genetic dataset showed private alleles at two different loci, suggesting that they could be migrants (or descendants from migrants) from outside of the study area. This result was supported by field observations.
Reliability of the trnL approach for barcoding (Paper II)
Via ePCR with primers c and d we retrieved 1308 sequences from GenBank, corresponding to 706 species, 366 genera and 119 families (excluding all sequences with at least one ambiguous nucleotide, and excluding genera with a single species and families with single genera). With primers g and h, we retrieved 18 200 sequences, corresponding to 11 404 species, 4215 genera and 410 families. The c–d primer pairs had a much lower number of hits because recorded sequences in GenBank often do not contain both primer sequences.
Globally, on the GenBank dataset, the entire trnL (UAA) intron and the P6 loop allow the identification of 67.3% (for c-d primer pair) and 19.5% (for g-h primer pair) of the species without taking into account single species within a genus. However, these values are probably underestimates, because of the possibility of misidentification of the species whose sequence has been submitted in public databases (Harris 2003). When analyzing the artic plant dataset the species identification was possible for the 85.44 % of the cases with c-d primers and 47.17% for h. For the food dataset analyzed with
g-h primers tg-he species were identified in 77.78% of tg-he cases. Tg-he ePCR using otg-her
primer pairs found in Shaw et al. 2005 never retrieved more than 100 sequences, and were not taken into account in the present study. For rbcL fragment amplified using
h1aF and h2aR, the resolution at species level is even lower, with only 15% of species
identified.
It is clear that the trnL intron does not identify all plant species and cannot distinguish among closely related species, but this limitation is compensated by several
advantages. First, the primers used to amplify both the entire region (c and d) and the P6 loop (g and h) are extremely well conserved, from Bryophytes to Angiosperms for the first primer pair, from Gymnosperms to Angiosperms for the second one. The primers g and h are much more conserved than primers h1aF and h2aR (Poinar et al. 1998) which target a protein sequence and thus have much more variable positions. This advantage is particularly important when amplifying multiple species within the same PCR. Second, the number of trnL (UAA) intron sequences available in databases is already very high (more than 15,000 sequences), by far the most numerous among non-coding chloroplast DNA sequences, allowing in many cases the identification of the species or the genus. Finally, the robustness of both systems also represents an important advantage, allowing the standardization and automation of the system. In many situations, the number of possible plant species is restricted, reducing the impact of the relatively low resolution, as in the case of arctic plant dataset.
The amplification of much degraded samples as processed food or permafrost sample that was between 21050 and 25440 years old was possible. So P6 loop has the potential to be extensively used in food industry, in forensic science, in diet studies based on feces, and in permafrost analyses for reconstructing past plant communities.
Diet analysis (Paper III)
Using faeces as a source of DNA, and universal primers that amplify a very short but informative fragment of chloroplast DNA and large-scale pyrosequencing, it was possible to successfully assess the diet composition of several herbivorous species. This DNA-based method is broadly applicable potentially to all herbivorous species eating angiosperms and gymnosperms, including mammals, insects, birds, and mollusks.
For the analysis of the 36 feces, we obtained a total of 97,737 P6 loop sequences, corresponding to an average of 2,715 ± 1130 sequences per sample. In each sample, a few sequences were found hundreds of time, whereas some other sequences were only represented either once or by very few occurrences. The sequences showing only up to three times were not taken into account in the subsequent analysis. They were almost always very close to a highly represented sequence, and thus we considered to be the result of sequencing errors in the P6 loop. In rare cases, we also found sequences, represented only once, that were not close to a highly represented sequence. Such sequences most likely correspond to a sequencing error within the tag, leading to an assignment to a wrong sample.
Plants were identified at several taxonomic levels from the species to the family, with a different rate for the different animal species. The percentage of discrimination is presented on Table 1. When a specific database was used the discrimination at species and genus level became more precise, such as for marmots were 64% of the sequences were unambiguously assigned at species level.
Table 1. Percentage of identified plants per level of identification per animal species studied
Level of identification I1 I2 M1 M2 M3 B1 B2 Ma1 Ma2
Species - 0.33 - - - 0.31 0.64
Genus 0.40 0.67 - - 0.40 0.67 0.75 0.51 0.77
Tribe 0.80 1 - 0.67 0.80 0.67 0.75 0.59 0.82
Subfamily 0.80 1 - 1 0.80 0.67 0.75 0.90 0.89
Family 1 1 1 1 1 1 1 1 1
I1= Chorthippus biguttulus, I2= Gomphocerus rufus , M1= Helix aspera, M2= Deroceras reticulatum,
M3= Arion ater, B1= Tetrao urogallus aquitanus, B2= Tetrao urogallus major, Ma1= Ursus arctos,
Ma2= Marmota caudata
All the results are consistent with the known diet of the animals, particularly for capercaillie, which eat mainly conifers in winter, and grasshoppers, which eat mainly grasses. The second slug was sampled in a compost box containing known plants, which were correctly identified by their sequences (C. Miquel, personal communication).
Mammals’ diet is more complex than that of birds and invertebrates, where a maximum 5 plant taxa were found. For bears an average of 5.6 different plant taxa were found in each scat (2-10). In the bear feces a total of 14 different plant families were identified.. For marmots an average of 16.5 different plant taxa were found in each scat (7-21) and 20 different plant families were identified. The results obtained in marmots show clearly that the system is particularly well adapted for analyzing complex situations, where the diet is composed of many different species. Blumstein & Foggin (1997) analyzed the diet of golden marmot population in Dhee Shar (Northern Pakistan). Identification of plants was carried out using feces microhistological analysis,
unfortunately species identification from feces was not possible, so plants were divided in 4 broad groups: graminoids (7 species), legumes (6 species), scrubs (8 species) and other herbs (71 species). The Authors demonstrated that marmot have forage preferences for legumes, that composed 71% of their diet. The trnL approach applied to golden marmot population in the Deosai National Park allowed us to describe their diet more precisely (arriving to identify 64% of the plant species eaten). In total 58 plant taxa were detected in marmots diet, of those 11 were present in more than 50% of the samples. Those plants belong to six different families (Asteraceae, Caryophyllaceae, Fabaceae, Lamiaceae, Poaceae, Polygonaceae). The most eaten species by marmots is
Cerastium cerastoides, in fact it was found in 10 samples of 12 (Table 2). The results
presented in Paper III demonstrate that golden marmots are more eclectic grazers than previously though.
Table 2 Plant taxa identified in the diet of the golden marmot (Marmota caudata) in Deosai National Park (Pakistan), based on sequence variation of the P6 loop of the chloroplast trnL (UAA) intron using feces as a source of DNA.
Faeces sample
Family Plant taxon Level of identification 1 2 3 4 5 6 7 8 9 10 11 12 Total
Apiaceae Heracleum candicans Species x x x 3
Pleurospermum hookeri Species x x x x 4
Araceae Araceae* Family x 1
Asteraceae Anaphalis nepalensis Species x 1
Anthemideae_1* Tribe x x x x x x x x 8
Anthemideae_2* Tribe x x x x 4
Aster falconeri Species x x x x x 5
Asteraceae_1* Family x 1 Asteraceae_2* Family x x x x x x 6 Asteraceae_3* Family x x 2 Asteraceae_4* Family x x 2 Asteraceae_5* Family x x 2 Asteraceae_6* Family x 1 Asteroideae_1* Subfamily x x x x x x x x 8 Asteroideae_2* Subfamily x x x x 4 Asteroideae_3* Subfamily x 1 Asteroideae_4* Subfamily x 1 Coreopsideae* Tribe x x x 3 Gnaphalieae* Tribe x 1 Inuleae* Tribe x x x x 4
Leontopodium brachyactis Species x 1
Brassicaceae Brassicaceae Family x 1
Draba oreades Species x x 2
Faeces sample
Family Plant taxon Level of identification 1 2 3 4 5 6 7 8 9 10 11 12 Total
Cannabaceae Cannabis sativa* Species x 1
Caryophyllaceae Cerastium Genus x x x x x x x x x 9
Cerastium cerastoides Species x x x x x x x x x x 10
Cerastium pusillum Species x x x x x 5
Silene* Genus x x 2
Silene tenuis Species x x x 3
Crassulaceae Crassulaceae Family x x x x 4
Rhodiola Genus x 1
Fabaceae Astragalus rhizanthus Species x x x x x x x x x 9
Galegeae Tribe x x x 3
Oxytropis cachemiriana Species x x x x x x x 7
Lamiaceae Dracocephalum nutans Species x x 2
Mentheae Tribe x x x x x x x x 8
Onagraceae Chamerion latifolium Species x 1
Papaveraceae Papaver nudicaule Species x x 2
Pinaceae Picea* Genus x 1
Plantaginaceae Lagotis kunawurensis Species x 1
Plantago* Genus x 1
Poaceae Agrostis vinealis Species x 1
Elymus longi-aristatus Species x x x 3
Poa alpina Species x 1
Poa supina Species x x x x 4
Pooideae* Subfamily x x x x x x x 7
Polygonaceae Aconogonon rumicifolium Species x x x 3
Polygonaceae Family x x x 3
Polygonum cognatum Species x x x 3
Faeces sample
Family Plant taxon Level of identification 1 2 3 4 5 6 7 8 9 10 11 12 Total
Rumex nepalensis Species x x x x x x x 7
Rosaceae Cotoneaster affinis Species x 1
Potentilla argyrophylla Species x x x x x 5
Rosoideae Subfamily x x x x x 5
Rubiaceae Galium boreale Species x 1
Saxifragaceae Saxifraga hirculus Species x 1
Solanacee Solanum* Genus x x 2
Total number of plant species per faeces 17 12 21 18 18 20 19 11 17 17 16 7 * Plants identified by comparing the sequence with sequence data in public databases.
Diet analysis of Himalayan brown bears (Nawaz et al. in preparation)
The trnL approach was coupled with individual and sex identification using microsatellites polymorphism (Paper I). Moreover, for each fecal sample the sampling date and the geographical coordinates were recorded by a GPS receiver (Garmin 12XL). This gives the opportunity to assess individual and sexual differentiation in the diet, and also to study temporal and geographical variations.
The 63 fecal samples that were successfully typed by microsatellites (Paper I) were also typed at the trnL locus. All samples gave consistent results but one, also when PCR cycles were increased to 45, conditions that favor the amplification of trace DNA molecules.
For all 62 samples totally 142030 sequences were obtained, with an average of 2,328.36 ± 921.09 sequences per sample. As found in Paper III, for each sample a few sequences were found hundreds of times, and only sequences that were repeated at least 4 times were taken into account in the subsequent analysis.
In total 57 plant taxa were found in bear feces, belonging to 50 genera and 29 families. Forty-seven percent of plants were identified at species level, 74% at genera, 77% at tribe, 82% at subfamily, and 100% at their family level. These results are much higher than those obtained for the 12 test samples in Paper III.
About 70% of identified taxa were present in ≤ 3 samples, and 27 taxa were present only in one sample. There were only four taxa with occurrence in more than 50% samples; one unidentified species of Poaceae, two of Cyperaceae (Carex diluta,
Carex sp.), and one of Apiaceae (Heracleum candicans). The unidentified Poaceae
species (subfamily Pooideae) had the highest frequency (92%). Among the 29 identified families, 14 were only present in one sample. Regular plant diet (≥ 10% occurrence) of brown bears consists of only eight families; Poaceae, Polygonaceae, Cyperaceae, Apiaceae, Asteraceae, Caryophyllaceae, Lamiaceae, Rubiaceae. The first four families make the preferred diet with more than 50% occurrence. Those results suggest that the plant families that do not belong to the preferred diet enter occasionally in the bear diet by chance during grazing.
The diet per individual is shown in Table 3. Graminoids (Poaceae and Cyperaceae) are presents in all individuals. Poeaceae were eaten by 27 individuals and
Cyperaceae by 21. Polygonaceae species are also an important food source for Himalayan brown bears, found in the diet of 26 of the 28 total individuals studied.
Variation among individuals in terms of total taxa in diet was not significant at species (χ2: 38.06, P = 0.09) and family level (χ2: 24.12, P = 0.67). The frequency of plants across individual bears ranged from 3 to 97%, the majority (72%) of plants were occasionally eaten (represented in <10% individuals). There were only eight taxa (Agrostis vinealis, Asteraceae sp., Bistorta affinis, Carex diluta, Carex sp., Heracleum
candicans, Poa supina, Poa sp.) present in > 50% individuals. Four taxa Poaceae, Polygonaceae, Cyperaceae, Apiaceae were present in at least half of the individuals. Graminoids and forbs were eaten by all individuals, and browse plants occurred only in 10% of cases. Correspondence analysis did not show major difference in the individual level for plant species, family and groups. Again this results support the hypothesis that bears have few preferred plants while the majority of plants species found by barcoding enter in the their diet by chance.
Among the 62 fecal samples analyzed with the trnL method; 21 belonged to females, 37 to males, and four to individuals of unidentified sex. . In females, 34 plants txa were identified and 43 taxa from male samples. The ratio of graminoids to forbs did not differ significantly (χ2: 0.24, P = 0.63) among sexes. The analysis of odds shows that females prefer Aconogonon rumicifolium, Agrostis vinealis, Heracleum candicans, and Menteae (Nepeta linearis or Thymus linearis). Instead males preference was for
Bistorta affinis, two Carex species (Carex diluta, C. sp.), and one unidentified species
of Polygonaceae. However those differences were not statistically significant, except for preferences of males for Bistorta affinis and Carex sp.. Female with cubs may show difference in their diet due also to different habitat selection, related to the avoidance of males. It will be interesting to test this hypothesis, but it was not possible in the present study.
No temporal difference was found in number of taxa (χ2: 2.54, P = 0.77) and families (χ2: 2.2, P = 0.82). However the ratio of graminoid forage to forbs changed significantly over three months (Spearman's r: -0.82, P = 0.04), favoring forbs in later season. At family level four plant families showed a temporal trend; Asteraceae and Poaceae declined in late season, while Polygonaceae and Fabaceae showed an increasing trend. This increase is linked to seed growth in the late season. Protein-rich food is preferred by bears for structural growth, instead calories-rich food is preferred
during hyperphagic period (period characterized by and high food intake that just precede hibernation period) (Gilbert & Lanner 1995; Brody & Pelton 1988). Brown bears hibernate during winter so they have to accumulate fat layer to maintain basic metabolic rate during this period. For female, storage of energetic food is even more important, because cub birth happens during hibernation. Other brown bear populations such as the Cantabrian (Naves et al. 2006) and Scandinavian (Dahle et al. 1998; Persson
et al. 2001) also show a temporal trend in the feeding behavior. Energy-rich food is
favored in the late season, for example the quantity in the total fecal volume of berries increase for Scandinavian brown bears from spring to autumn (from 31.9 to 64.7 of the fecal volume). Similar to other brown bears population, the Deosai bears prefer seed and caloric food in late season.
Among 62 fecal samples used with the trnL method, 15 were collected from marshy habitats, 16 from grassy and 13, 7 from stony, and rocky within the park. Ten were from surrounding valleys and location of 1 sample was not known (missing GPS coordinates). Neither number of taxa (χ2:1.52, P = 0.82) and number of families (χ2
:1.85, P = 0.76) varied significantly across habitat types. However four families; Adoxaceae, Araliaceae, Ephedraceae and Orobanchaceae were represented only in samples from valleys. Pinaceae and Cupressaceae were found in samples collected in the plateau, although these families are present only in valleys outside the park. Unfortunately, the passage rate of food in the gut is unknown for this species, so we can’t deduce when the bear have eaten a particular plant. We can only hypothesize that after having foraged in the valley they came back to the Deosai plain. Brown bear hibernate in the valley, and before hibernation they eat coniferous leaves (Nawaz personal communication). The feces in which we found conifers DNA, was collected close to a valley and at the end of September, therefore we hypothesize that this individual was preparing for the hibernation period.