DIPARTIMENTO DI SCIENZE CHIMICHE
DOTTORATO DI RICERCA IN SCIENZA E TECNOLOGIA DEI MATERIALI XXVII CICLO
Fabiola Spitaleri
Synthesis, characterization and thermal properties of polymers based
composites materials for High Power Electronic Packaging Applications
TESI DI DOTTORATO DI RICERCA
Tutor: Chiar.mo Prof. Placido G. Mineo
Coordinatore: Chiar.ma Prof.ssa Maria G. Grimaldi
Ma voi siete di Dio”
- 1 Cor 3, 22-23 -
In copertina:
Stefania Spitaleri,
“Particolare della Creazione”, Michelangelo.
Collezione privata, 2012.
~ 5 ~
1. A look on power
1.1
High
Power Electronic Packaging
1.1.1 Packaging Technology 1.1.2 Integrated Circuit Packaging
1.2 Semiconductor Power Devices
2. Aim of research
2.1 State of the art
2.2 Know how
3. Polymeric Matrix
3.1 Epoxy resins synthesis
3.2 Epoxy resins characterizations
4. Fillers
4.1 Polyamidic fillers
4.1.1 Synthesis and characterization of Poly(meta-phenylene isophthalamide)
4.1.2 Synthesis and characterization of Poly(p-phenylene terephthalamide)
4.1.3 Characterization of Kelin 130
4.2 Polyimidic filler
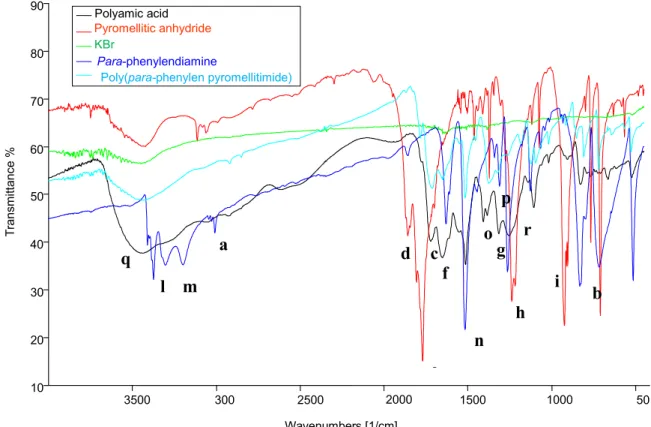
4.2.1 Synthesis and characterization of Poly(para-phenylen pyromellitimide)
4.3 Graphenoxidic filler
7
7
8 1316
22
25
27
33
40
46
53
54
55 64 7377
7987
~ 6 ~
5. Composites
5.1 Synthesis of composites
5.2 Composites Characterization
5.2.1 TGA and DTA analysis of "NOM.10" type composites 5.2.2 FT-IR analysis of NOM.10 composites
5.2.3 TGA and DTA analysis of NOM.33 and KEV.33composites 5.2.4 FT-IR analysis of NOM.33 and KEV.33 composites
5.2.5 TGA and DTA analysis of SIL.33 composite 5.2.6 FT-IR analysis of SIL.33 composite
5.2.7 TGA analysis of "KAP.33" composite 5.2.8 FT-IR analysis of KAP.33
5.2.9 Thermal Characterization of GO.33 composite 5.2.10 Thermal Characterization of KEL.33 composite
5.3 Indirect Thermal Conductivity determination
5.4 Finite Element Method
5.4.1 Virtual Prototyping
5.5 Direct Thermal Conductivity measurements
5.6 Prototypes
6. Conclusions and future perspectives
Appendix
Research products
Acknowledgments
90
90
92
92 96 98 101 102 104 105 109 111 113115
120
121125
131
134
140
161
164
~ 7 ~
1. A look on power
Power electronics deals with electric energy conversion trying to perform this transformation by minimizing the power dissipated. Electronic devices and power modules are key components of several power systems for the storage, conversion and conditioning of electromagnetic energy.
The package provides mechanical, chemical and electromagnetic protection to electronic devices; it also dissipates heat and allows the interconnection with other component.
1.1 High Power Electronic Packaging
Package starts at the interface with chip and includes the interconnection of chip itself to the substrate and its encapsulation.
First, the power package must be able to manage increases of power and current by several orders of magnitude (this requires a wide area for interconnections). Secondly the voltage, according to several applications, can reach several kilovolts (it requires high voltages breakdown). Finally, because these devices operate at high frequencies and density power, electrical conduction must be reduced to minimized parasitic noise and dissipation heat must be optimized1.
1 S. Wen and G. Q. Lu, “Finite-element modeling of thermal and thermomechanical behavior for
three-dimensional packaging of power electronics modules” Proceeding of the 7th Intersociety Conference on Thermal and Thermomechanical Phenomena in Electornic Systems, Vol. II, Las Vegas, Nevada, May. 2000, pp. 303-309.
~ 8 ~
1.1.1 Packaging Technology
Nowadays packaging of devices and semiconductor power modules can be built by following several technologies: flip-chip, wire-bonding, MIPPS, POL, DAI, EP, press pack.
Flip-chip technology
This package technology is also known as “C4” (Controlled Collapse Chip Connection) is a method for the interconnection of semiconductor devices, such as integrated circuits and Micro-Electro-Mechanical Systems (MEMS). Electrical connections between chip and substrate were provided by solder bumps: chips is upside down and mounted on a suitable substrate. 2
Device assembled with flip chip technology is much smaller than a traditional system: the chip is allocated directly on the printed circuit, and it is much smaller both in surface that height. Short links reduce inductance, allowing the exchange of information faster and greater heat dissipation. 3
Flip-chip flex is an extension of flip-chip technology on flex circuits. 4
Solder bumps connects chip to a flexible substrate (figure 1) ; the module is then encapsulated by a polymeric material capable of reducing the thermo-mechanical stresses imposed on the solder joints.
Figure 1: Flip-chip flex technology
2 J. H. Hua, “Flip Chip Technologies”, New York: McGraw Hill, 1995
3 R. R. Tummala, E. J. Rymaszewski, and A. G. Klopfenstein, “Microelectronics, Packaging
Handbook”, New York: Chapman & Hall, 1999.
4 J. Bai, G. Q. Lu, and X. Liu, “Flip-chip on flex integrated power electronics modules for high-density
~ 9 ~
Wire Bonding
Wire bonding is the interconnection technology chip nowadays more common for the power electronics. Thin wires connects chip with the respective pins on the package. Chips are soldered to copper heat sink and the source and gate terminals are connected by metal wires to heat sink (Figure 2); generally these wires are made of gold, aluminum or copper.
Wires diameters can reach several hundred microns for high power applications.5
Figure 2: wire bonding packaging6
Top of chips and bonding wires are encapsulated with insulating material, typically epoxy resins or ceramic.
The connections can be realized in two ways: Ball bonding or Wedge bonding (figure 3).
Figure 3: Ball bonding (A) e Wedge bonding (B).
5 R. R. Tummala, “Fundamentals of Microsystems Packaging”, McGRAW Hill, 2001, pp.346-347 6 “New packaging concepts for low voltage power MOSFETs lead to performance improvemnet in
advanced DC-DC converters”, ST Microelectronics Application Note AN2066, Nov. 2004.
B A
~ 10 ~
Wire Bonding process have many advantages: it is highly flexible and performing, a lot of industries have infrastructure suited to this technology, there is a rapid advances in equipment, tools and materials for this package technology.
The disadvantages include slower speed interconnection due to presence of wire bonds, length of chip-to-package interconnection, and limited heat dissipation.
MPIPPs (Metal-Posts Interconnected Parallel Plates) Technology
This packaging technique uses metal pins bonded directly to the die7 (Figure 4).
Figure 4: MPIPPs Technology
At the top of DBC there is an aluminum nitride substrate (AlN) and chips are directly connected by solder. The copper pins, having different sizes, are soldered on top of devices and connecting them to AlN substrate.
This technology has parasitic currents lower than the conventional wire bonding, but requires solderable devices.
POL (Power Overlay) Technology
POL technology eliminates wires bonding through the use of Cu/polyimide interconnections8, this reduce parasitic currents and improve thermal dissipation (due to 7 S. Haque, K. Xing, R. Lin, C. T. A Suchicital, G. Q. Lu, D. J. Nelson, D. Boroyevic, and F. C. Lee, “An
innovative technique for packaging power electronics building blocks using metal posts interconnected parallel plates structure ”, IEEE Transactions on Advanced Packaging, vol. 22, no. 2, pp. 136-144, May, 1999.
~ 11 ~
reduced number of thermal interfaces). Semiconductor devices are upside down and soldered to heat sink DBC, a thin layer of polyimide is deposited over the die and the interconnections are obtained with laser or with mechanical perforation. All upper surface is copper plated.
DAI (Dimple Array Interconnect) Technology
Electrical interconnection is established by the formation of solder bumps between device electrode and matrix, consisting of a metal foil with dimples as shown in figure 5
9. The result is a planar interconnection fits for the multi-layer integration with other
components.
Figure 5: DAI technology
This technique reduces parasitic currents interconnection and increases thermal capacity of packaging; however, the mismatch in thermal expansion coefficients between copper foil and silicon dimples can cause thermo-mechanical problems.
8 R. Fisher, R. Filion, J. Burgess, and W. Hennessy, “High frequency, low cost, power packaging using
thin film power overlay technology” Proc. of the 10th Applied Power Electronics Conference and
Exposition (APEC), Dallas, TX, Mar. 1995, pp. 12-17
9 Wen, D. Huff, and G. Q. Lu, “Dimple-array interconnect technique for packaging power semiconducotr
devices and modules”, Proc. of the 13th International Symposium on Power Semiconductor Devices and
~ 12 ~
EP (Embedded Power) technology
EP packaging technology concerns the construction of a planar power devices, embedded in a ceramic matrix; it presents a multi-layer structure: ceramic substrates, printable and sealing dielectric materials for encapsulating power device.
Power devices are mounted in special holes on ceramic substrate and surrounded by an adhesive polymer. Dielectric materials is printed with circuital pattern, copper layer is above deposited to give electrical connection. Copper layer can be thicken by an electro-deposition process.
Press Pack Technology
Press pack is a bonding wireless technology. The press pack structure has evolved to a sandwiched structure and involves Molybdenum strain buffers, gate connection and insulation, Copper (Cu) pole-piece and a ceramic ring.10
At the collector there is a cylindrical structure in copper and molybdenum in a wide disc connected to all of chips; at the emitter, instead, each die is in contact with a multi-column copper structure through a thin layer of molybdenum. The whole is enclosed by a ceramic ring, figure 6.
Figure 6: Press-Pack Technology
10 S. Eicher, M. Rahimo, E. Tsyplakov, D. Schneider, A. Kopta, U. Schlapbach, and E. Carroll, “4.5 kV
press pack IGBT designed for ruggedness and reliabilty,” Proc. of the 39th
~ 13 ~
Press-pack packages reaches high reliability for wide ranges of temperature and power applications. Disadvantages concern high costs of production and need to keep pressure in various parts of the package.
1.1.2 Integrated Circuit Packaging
The first integrated circuit appeared in 1958 and had only one transistor, today there are more than one million transistors on each one. As devices evolve, must do so also the hardware and interconnections of circuits. High power density devices, or with multiple dies, are calling for several new packaging technologies.
Packaging of Integrated Circuits can be divided into the following categories11: Surface mount package (in plastic or ceramic materials);
Chip-scale package; Bare die;
Through-hole package.
Surface mount package
Package obtained with this technique allows to have a small, lightweight device and able to withstand shocks; it is also economical because the manufacturing process takes place in a single stage. The case, usually plastic, is molded around the main frame of device; they are still in study new materials for this purpose, such as polyimides that could solve problems related to hermeticity and mismatch of expansion coefficients between chip and package. Plastic packages are hygroscopic and absorb moisture depending on the environment that surrounds them. Moisture can be removed with a quick warm-up, with the risk of package cracking (known as “popcorn effect”), and subsequent entry of contaminants that can corrode circuit.12
For special applications (eg. aerospace and military) are used hermetic packages such as flat pack or CLCCs: Flat Pack (Figure 7a) is a square or rectangular package, it was born in 196213 as an improvement of the existing package in heat dissipation and 11 Meeldijk, V. “Integrated Circuit Packages” ,The Electronic Packaging Handbook, Ed. Blackwell, G.R.
Boca Raton: CRC Press LLC, 2000
12 DA Burkhart, MM Chau: “Materials for semiconductor device assemblies”, US Patent 5,855,821, 1999. 13 Dummer, G.W.A., “Electronic Inventions and Discoveries” 2nd ed. Pergamon Press
~ 14 ~
number of chips inside circuits. Flat Packs can be made of glass, ceramic or metal and are hermetic.
Figure 7: Package Flat Pack (A) e CLCCs (B)
CLCCs (ceramic leadless chip carrier) don’t have wires, but are surrounded by pins along edges (Figure 7b). For simple applications can be realized in plastic.
Bare die
The use of bare die (figure 8) is increasing: the aim is to reduce both the size and the weight of the final product. The use of bare die eliminates delays (caused by inductance and parasitic capacitance): for static RAMs, there was a 20% improvement in access time14. The use of bare die has some problems: at this time, it is more costly for vendors to handle and ship bare die than packaged if compared to encapsulated devices and therefore this technology is still evolving.
Figure 8: bare dies
14 Meeldijk, V. “Integrated Circuit Packages” ,The Electronic Packaging Handbook, Ed. Blackwell, G.R.
Boca Raton: CRC Press LLC, 2000
A
~ 15 ~
Chip-Scale Packaging
This packaging technique is designed to obtain size and performance of bare die but with the handling and controllability of encapsulated devices: the size of the package does not exceed more than 1.2 times the bare die.
Through-hole package
This technique involves assembly of the package in holes, generally plated metal, on printed circuit board.
The choice of packaging technique to apply to a certain device or power module can already improve the properties for what concerns parasitic noise, hermeticity, heat dissipation, handling, cost of production, etc ...
Material component package may implement these properties even more: there are below a list of the main materials, depending on the type of microelectronic packaging15.
Plastic Packages: epoxy resins, silicone resins, polyurethanes;
Metallic Packages: Kovar16( that is a nickel–cobalt ferrous alloy with 25% Ni, 17% Co, 0.3% Mn, 0.2% Si and C<0.01%), aluminum, steel;
Ceramic Packages: (Al2O3, glass, SiO2, ZrO2);
Composite Packages: reinforced glass fiber, G200 (a high quality
potassium/sodium/calcium aluminum silicate ground to 200 mesh17), FR418 (woven of glass fibers in a epoxy resin matrix), Kapton19 (polyimide film), polyamides, Teflon.
15 http://www.optoi.com/it/servizi/packaging
16USPTO United States Patent and Trademark Office (1993). "Trademark Assignment Abstract”:
http://assignments.uspto.gov/assignments/q?db=tm&sno=71367381
17 http://www.standardceramic.com/G200Changes.pdf
18 https://www.nema.org/Standards/ComplimentaryDocuments/LI1.pdf
19
~ 16 ~
1.2 Semiconductor Power Devices
Figure 9: Power devices applications
A power semiconductor device, used as a switch or rectifier in the power electronics, is often called power device or, if used in an integrated circuit, IC power. The most common power devices are diode, SCR, MOSFET and IGBT.
The power devices can be classified as follows (Scheme 1):
two-terminal devices (diode), dependent on the external power circuit to which it is connected;
three terminal devices, whose state depends also by the signal on gate.
~ 17 ~
Another classification concerns the device performance:
majority carrier devices (Schottky diode, MOSFET, etc.);
minority carrier devices (SCR, bipolar transistor, IGBT, etc.), they use both majority and minority charge carriers (ie electrons and holes).
Diode
Diode is a non-linear bipole in which the terminals are anode and cathode. When diode is polarized with a negative voltage anode-cathode, it behaves like an open circuit and it is said polarized in reverse region. Instead, when the current flows from anode to cathode, the diode behaves as a short circuit: it is polarized in direct region.
A semiconductor PN diode (Figure 10) is based upon the p–n junction: it conducts current in only one direction, and it is made by joining a p-type semiconducting layer to an n-type semiconducting layer.20 Semiconductor diodes have multiple uses including rectification of alternating current to direct current, detection of radio signals, emitting light and detecting light.
Figure 10: P-N diode structure
Schottky diode21 and PIN diode have also great application in electronics.
Particularly, Shottky diode have a low potential drop between terminals that allows to have high switching speed and a better efficiency. Instead of a pn junction, it’s formed a Schottky barrier (Figure 11). Metal generally used are: Mo, Pt, W or Cr, and sometimes PtSi or PdSi and semiconductor is n-type silicon. The metal layer constitutes anode of diode, while the n-type semiconductor is cathode.
20 John Sparkes (1994). Semiconductor Devices (2nd ed ed.). CRC Press.
~ 18 ~
Figure 11: Schottky diode
A PIN diode22 (P-type, Intrinsic, N-type) is a diode with a large region of intrinsic semiconductor material contained between a p-type and a n-type semiconductors. A PIN diode shows an increase of electrical conductivity as a function of amplitude, wavelength and the rate of modulation of incident radiation; for this reason many photo-sensors include at least one PIN diode, such as PIN photodiodes or phototransistors.
JFET (Junction gate Field Effect Transistor)
The JFET transistors are unipolar : they only have n-type current or p-type current23. JFETs can have an n-type or p-type channel. In the n-type, if the voltage applied to the gate is less than that applied to the source, the current will be reduced (similarly in the p-type, the voltage applied to the gate is greater than that applied to the source).
BJT (Bipolar Junction Transistor)
A bipolar junction transistor is based on contact of two types of semiconductors, generally based on silicon. The BJTs are generally used as switches or amplifiers, both as individual components as part of integrated circuits24.
22 Doherty, Bill: “PIN Diode Fundamentals”, Watertown, MA: Microsemi Corp., MicroNote Series 701. 23D. Chattopadhyay: "Junction field-effect transistor (JFET)". Electronics (fundamentals and
applications). New Age International, 2006. pp. 269 ff.
~ 19 ~
Figure 12: Cross-section of BJT n-p-n
They are composed of three layers of doped semiconductor material in which the central layer has doping opposite to the other two, so as to form a double pn junction (Figure 12).
MOSFET (Metal Oxide Semiconductor Field Effect Transistor)
The ideal physical structure of MOSFET is constitute of a monocrystalline substrate of p-type where are realized two junctions of n+ 25 type, with two terminals of drain and source composed of semiconductor, doped in opposite way: if the substrate has a p-type, two terminals have n-type doping, and vice versa. In the area between drain and source is grown a layer of silicon dioxide (thickness less than 0.01 mm), which is an excellent insulator. The gate electrode is made of polycrystalline silicon.
There is also a fourth terminal connected to the bulk. The area between the drain and source is said channel.
Depending on the voltage applied to the substrate under the gate (MOS capacitor) the channel can be full of gaps, empty, or electrons.
Thyristors
Thyristors are semiconductor devices with PNPN junctions: they are used for high currents and high voltages control. For example SCR is able to control thousands of amperes and kV.
SCR (Silicon Controlled Rectifier, figure 13) is a controlled rectifier in silicon so as to stop the normal flow current as long as a small signal applied to a third electrode (gate). 25 Semiconductor doping concentration higher than that of a normal n-type.
~ 20 ~
The current flow can be interrupted only by applying a reverse voltage or opening anode circuit.
Figure 13: SCR device
The bulk of SCR is a weakly doped n-type Si with hundreds of μm thikness. On sides is carried out a diffusion of p-type Si, forming a wafer PNP. Subsequently, boron is diffused on both sides to obtain a thin p+26 layer.
SCRs are often employed in inverter and chopper.
TRIAC (Triod AC) can be considered as two antiparallel SCR: they can conduct or stop corrent flow in two directions. A lot of TRIAC applications concerns appliances.
GTO (Gate turn-off thyristor)
Thyristors are not completely controllable: they conduct (ON) by applying an appropriate voltage to gate electrode, but can not be stopped (OFF) using the same electrode. The thyristors remain in the ON state even the gate signal is removed. To return to the OFF state it requires that the current flowing below a certain limit value known as holding current. Unlike the SCR, the GTO can be turned on or off carrying respectively a positive or negative signal to the gate electrode. GTOs have long interval of time in which a residual current continues to flow until all the remaining charge is eliminated from the device. This limits the maximum operating frequency of about 1 kHz; however, if compared with SCR is ten times smaller27.
26 Semiconductor doping concentration higher than that of a normal p-type.
~ 21 ~
IGBT (Insulated Gate Bipolar Transistor)
IGBT is a semiconductor device used as electronic switch in high power applications. It
can be shown schematically as the connection of a BJT and a MOSFET28. The IGBT
today have assumed great importance for all applications of high voltages and currents power such as industrial inverter or photovoltaic. They are key components in electric and hybrid cars, which are the only solution for small engine control unit, powerful and efficient: the Toyota Prius uses a 50KW inverter based on IGBT which controls two motors connected to the batteries29.
An IGBT device is similar to a power MOSFET, with the difference that the drain n+ is replaced with a layer p+ (figure 14), thus forming a vertical PNP bipolar junction transistor.
Figure 14: IGBT device
28 B. J. Baliga, "Fast-switching insulated gate transistors", IEEE Electron Device Letters, Vol. EDL-4, pp.
452-454, 1983.
~ 22 ~
2. Aim of research
Thermal dissipation plays an important role in integrated circuits: temperature is a critical parameter for the good performance of any electronic device. Temperature increases a series of device failure mechanisms, such as leakage current, electromigration, "hot electrons"30 , etc…
When electricity passes through a power module, generates a temperature increase due to Joule effect; this increase may damage device according to Dakin-Arrhenius equation31:
Equation 1
with L length of device life, A and b are constants depending on material and stress, T is temperature and ε is emissivity.
The temperature of a device increases when it dissipates power according to:
Equation 2
With TA temperature of contact between device and surrounding environment, Tj-max is temperature that generates device break, Pd is dissipated power and θJA is thermal resistance.
Each device has a maximum operability temperature, Tj-max correlated to a maximum dissipated power, P max. If there isn’t a good heat transfer from device to outside, when T = Tmax, a further power and temperature increase breaks device.
From Equation 2, by varying the temperature, it is possible to draw a derating curve (Figure 15) for each device. 32
30 “Hot electrons”: it’s a phenomenon occurs when electrons device reach so high kinetic energies as to
generate a charge space that can cause device degradation.
31 DAKIN, T.W.: ‘Electrical insulation deterioration treated as a chemical rate phenomenon’, AIEE
Trans., 1948,67, pp. 113–122
32 R.K. Singh, Ashish Dixit: “Basic Electronics Engineering & Devices”, LAXMI publication 2007, pp.
~ 23 ~
Figure 15: Derating curves for some devices
Derating curves shows how it is possible to enhance power dissipated improving package thermal efficiency. Because all surrounding chip constitutes package (soldering, gel insulation, heat sink, package case, Figure 16), it is possible to act on each of these components.
Figure 16: Power module components
Therefore there are different levels on which act in order to improve package thermal properties: we focused on case thermal efficiency which depends both on materials and geometry. In particular, degradation temperature and thermal conductivity are related to
~ 24 ~
material forming package, while ability to transfer heat to the cooling fluid regards its geometry.
Considering that heat dissipation propagates in three different modes: conduction, convection and radiation, package thermal efficiency depends on:
material and contact with die (thermal conductivity); material and dimensions (thermal resistance);
geometry, ventilation conditions and mounting position (cooler fluid convection);
color (effect of "black body" and irradiance efficiency); ability to electrically isolate die.
~ 25 ~
2.1 State of the art
Commonly, chips are packaged in epoxy molding compounds filled with silica powder.33 As previously it was seen, only for some special uses are applied metal or ceramic package.
Furthermore, marketing needs to obtain devices more and more advanced, able to work at higher power densities, frequency, current and voltage . Particularly, due to the limit of silicon power device at high voltage level (600–700 V), the technological advancement has pushed the development of new materials for power devices, such as SiC, gallium nitride (GaN), and other semiconductor materials34.
Silicon carbide (SiC) is having enormous interest for applications in high power density devices which require high temperature resistance. In Table 1 is reported a comparison between silicon (Si) and 4H-SiC properties.35
Table 1: Comparison between SiC and Si properties
33 National Research Council (U.S.): “Materials for high-density electronic packaging and
interconnection”, Washington, D.C, National Academy Press; 1990, p.18
34 Yong Liu “Power Electronic Packaging Design, Assembly Process, Reliability and Modeling”, New
York, Springer, 2012, p. 5
35 A. K. Agarwal, R. Singh, S. H. Ryu, J. T. Richmond,D. C. Capell, S. Schwas, B. Moore, and J. W.
Palmour, “600 V, 1-40 A, schottky diodes in SiC and their applications” available: http://www.cree.com/products/pdf/PWRTechnicalPaper1.pdf
~ 26 ~
The high value of electrical breakdown makes SiC well suited to the development of high-voltage (HV) devices: we report recent examples of PIN diodes and MOSFETs in SiC with a blocking voltage of 10 kV3637.
Furthermore, the very high thermal conductivity of SiC reduces the thermal resistance of the device die.
The incremental use of SiC requires significant improvements in packaging properties: low resistance interconnections, less noise, less parasitic oscillations, increased reliability, insulation capacity of HV and improved thermal management because the encapsulated itself is more capable of dissipating (SiC has higher thermal conductivity than Si)38.
An example of new package materials to support heat transfer and electrical performance are thermosetting composites containing nano-silica particles as filler39 in order to dissipate heat quickly.
At present, a lot of semi-conductor devices encapsulants are based on thermosetting epoxy resin and sealings, currently, are PbSnAg alloys or sometimes without Pb40: the choice to use various materials is mainly based on their thermal stability41.Moreover, in some devices it is also necessary the presence of an electrically insulating gel, usually based on silicones42.
36 R. Singh, K. G. Irvine, D. C. Capell, J. T. Richmond, D. Berning, A. R. Hefner, and J. W. Palmour,
“Large area, ultra-high voltage 4H-SiC p-i-n rectifiers,” IEEE Transactions on Electron Devices, 2002. pp. 2308-2316 (vol. 49, no. 12)
37 T. H. Duong, A. Rivera-Lopez, A. R. Hefner, and J. M. Ortiz-Rodriguez, “Circuit simulation model for
a 100 A, 10 kV half-bridge SiC-MOSFET/JBS power module,” Proc. of the 23th Applied Power Electronics Conference and Expostion (APEC), Austin, Taxes, 2008, pp. 913-917.
38 R. R. Tummala, E. J. Rymaszewski and A. G. Klopfenstein, “Microelectronics Packaging Handbook”,
Part II, Semiconductor Packaging, Chapman & Hall, 1996, p. 12.
39 Sun, Yangyang; Zhang, Zhuqing; Wong, C. P. “Influence of nanosilica on composite underfill
properties in flip chip packaging"Proceedings - International Symposium on Advanced Packaging Materials: Processes, Properties and Interfaces, 9th, Atlanta, GA, United States, Mar.24-26, 2004, pp 253-259
40 Kim, Hyoung Il; Tian, Jun; Gupta, Vijay: “In-situ measurement of solder joint strength in
board-mounted chip-scale packages using a quantitative laser spallation technique”, Journal of Adhesion Science and Technology (2013), 27(7), 719-730
41 Bolannos M.A: “Semiconductor IC packaging technology challenges”. In: EMAP 2005, Tokyo, Japan 42 M. T. Do, J.-L. Auge, O. Lesaint: “Partial discharges in silicon gel in the temperature range 20-150°C”
From Annual Report - Conference on Electrical Insulation and Dielectric Phenomena 2006, pp. 590-593 (Vol. 2)
~ 27 ~
2.2 Know-how
For a preliminary check on polymeric materials currently used for package of commercial electronic devices, and the type and amount of filler (often patented), it was initially designed, within activity of doctorate, an investigation on some commercial package transistors (BD139 and BD791).
In particular, thermogravimetric analysis has highlighted the presence of inorganic and organic residual, whose chemical nature is clarified by FT-IR spectrophotometry. These analysis were conducted both in air or nitrogen atmosphere.
Thermograms of BD139 and BD791 packages, are reported respectively in Figure 17 and 18, the relevant data are shown in Table 2.
~ 28 ~
BD 139
Thermogravimetric Curves
Derivative Curves
Figure 17: Thermogravimetric curves (a) and derivative curves (b) of BD139
0 100 200 300 400 500 600 700 800 900 65 70 75 80 85 90 95 100 105 W ei gh t % T (°C) BD139 in aria BD139 in azoto 0 100 200 300 400 500 600 700 800 900 -0,08 -0,07 -0,06 -0,05 -0,04 -0,03 -0,02 -0,01 0,00 0,01 % / mi n T (°C) BD139 in aria BD139 in azoto
a
b
--- air atmosphere --- nitrogen atmosphere --- air atmosphere --- nitrogen atmosphere~ 29 ~
BD 791
Thermogravimetric Curves
Derivative Curves
Figure 18: Thermogravimetric curves (a) and derivative curves (b) of BD791
0 100 200 300 400 500 600 700 800 900 86 88 90 92 94 96 98 100 102 W ei gh t % T (°C) BD791 in aria BD791 in azoto 0 100 200 300 400 500 600 700 800 900 -0,6 -0,5 -0,4 -0,3 -0,2 -0,1 0,0 0,1 0,2 % / mi n T (°C) BD791 in aria BD791 in azoto
a
b
--- air atmosphere --- nitrogen atmosphere --- air atmosphere --- nitrogen atmosphere~ 30 ~
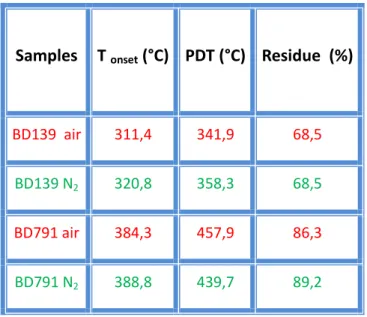
Table 2: Data relative to thermogravimetric analysis shown in figure 17 and 18.
Samples T onset (°C) PDT (°C) Residue (%)
BD139 air 311,4 341,9 68,5
BD139 N2 320,8 358,3 68,5
BD791 air 384,3 457,9 86,3
BD791 N2 388,8 439,7 89,2
In particular, analysis conducted in air flow are useful to know content of inorganic residue, corresponding to amount of package filler.
Data reported shows that the package of BD139 begins to degrade in air at about 311.4 °C, ie at a lower temperature than in a nitrogen atmosphere (320.8 °C); also the residual percentage is the same both in air and in nitrogen, therefore it is principally of inorganic nature. BD791 package has similar behavior: it begins to degrade in air at 384.3 °C, while in a nitrogen atmosphere at 388.8 °C. These systems reach a maximum degradation rate between 350 °C and 500 °C.
At the end of air thermal treatment, sample residues appear essentially white in color. These composites were analyzed by means of FT-IR analysis, shown in Figure 19, the signals are indicated in Table 3.
~ 31 ~
Figure 19: FT-IR spectra of BD139 and BD791
Table 3: FT-IR signals of BD391 and BD791 packages (s = strong signal; m = medium; w = weak; sh = sharp; br = broad)
It’s possible to observe the strong Si-O signal, confirming the presence of silica-based inorganic fillers in both samples, and CH aromatic and aliphatic signals.
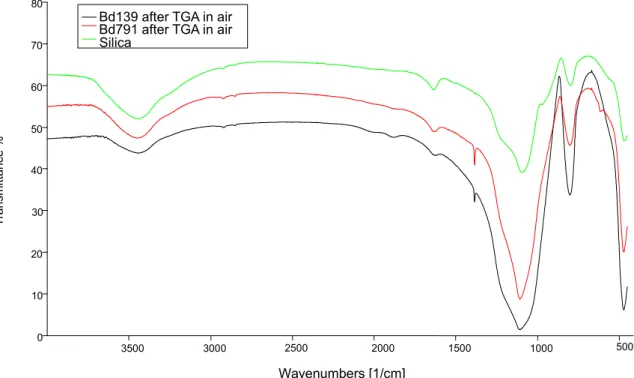
In the end, FT-IR spectrum of packages residues after thermogravimetric analysis until 800°C, in air flow (figure 20), points out silica signals:
O-H bond stretching: 3447 cm-1; Si-O stretching: 1093 cm-1.
Bond Bd139 (cm-1) Bd791 (cm-1)
Aryl C-H (stretching)
Aryl C-H aryl (bending) ________
3074.07 w (a) 697.97 w sh (a’) Alkyl CH (stretching) 2922.1 w (b) 1384.4 w (b’) 2967.80 w (c) 1430.94 w (c’)
O-H (stretching) 3436.1 w br (d) 3436.78 w br (e)
Si-O (stretching) 1106.5 s br (f) 1106.9 s br (g) 500 1000 1500 2000 2500 3000 3500 0 10 20 30 40 50 60 70 80 BD139 BD791 Wavenumbers [1/cm] T ra n sm itt a n ce %
~ 32 ~
Spectra shows characteristic Si-O and OH bonds stretching of silanol groups; furthermore, by a comparison with the spectra in Figure 19, there is the disappearance of aliphatic and aromatic signals.
Figure 20: spectra of BD139 and BD791 after thermogravimetric analysis in air flow
Evaluations on commercial packages have allowed us to get a background on which to design research, concerning synthesis of new composite materials; ie the choice of polymeric matrix and type and percentage of filler used for final composites.
In particular, we focused on new materials suitable for power packaging and capable of dissipate heat better than commercial package. At the beginning, as upon described, research activity was investigation on actual materials used for commercial package, then move on to testing of new composite materials based on polymeric matrix properly filled and/or functionalized.
500 1000 1500 2000 2500 3000 3500 0 10 20 30 40 50 60 70 80
Bd139 after TGA in air Bd791 after TGA in air Silica Wavenumbers [1/cm] T ra ns mi tta nc e %
~ 33 ~
3. Polymeric Matrix
Composites matrix used was a thermosetting polymers based on epoxy resins43; they are cross-linked polymers having high rigidity due to the large number of crosslinking points, generated by bonds formation between chains. They differ from other polymer systems cause impossibility of changing its shape once obtained, because their irreversible chemical modifications due to bonds formation between chains of prepolymers. Prepolymers are usually organic compounds with low molecular weight, multifunctional and chemically active. Prepolymers react trough a polyaddition obtaining three-dimensional cross-linked structures insoluble in solvents, infusible and degradable only at very high temperatures. In order to crosslink the resin at least one of comonomers must have than of two functional groups (hardening agent); crosslinking event may also occur with UV radiation44. Crosslinking reaction begins with chains oligomeric formation which immediately begin to ramify. With the progress of polymerization, molecular weight and molecular size increase, until is obtained a complex network as a result of covalent bonds between chains.
During initial step of synthesis (Figure 21), oligomeric chains interact with each other by Van der Waals forces: it forms an elastic soluble gel (gelation), from which depend three-dimensional network structure.
Figure 21: Cross-link Beginning
43 Associazione Italiana di Scienza e Tecnologia delle Macromolecole A.I.M. , “Macromolecole. Scienza
e Tecnologia”, 2007
44 Hyun-Sung Do1, Jin-Hee Park, Hyun-Joong Kim “UV-curing behavior and adhesion performance of
polymeric photoinitiators blended with hydrogenated rosin epoxy methacrylate for UV-crosslinkable acrylic pressure sensitive adhesives”, European Polymer Journal Volume 44, Issue 11, November 2008, Pages 3871–3882.
~ 34 ~
With reaction progress covalent bonds are formed (Figure 22): now it is formed a covalent gel. When curing events end it is formed a three-dimensional structure.
Figure 22: Curing events
Epoxy resins45 may be defined as those materials in which chain extension and cross-linking occurs through reactions of the epoxy group (Scheme 2):
C
H CH2
O *
Scheme 2: Epoxy group
These resins where first developed in the 1940s and, although a number of different types are now commercially available, the major share of the market is still held by systems based upon the reaction products of epychloridrin and 2,2-bis(4’-hydroxyphenyl)propane (Bisphenol-A)46: C H CH2 O C H2 Cl HO CH3 CH3 OH CH3 CH3 O C H2 CH C H C H2 O O CH3 CH3 O C H2 CH OH C H2 O C H2 n CH2 O + NaOH
Scheme 3: Reaction between epychloridrin and Bisphenol-A, where n = 0 to 12.
45 P.M. Hergenrother, H.H. Levine, Journal of Polymer Science Part A / 5 (1967) p.1453.
46 J. P. Critchley, G. J. Knight, W.W. Wright, “Heat-Resistant Polymers”, Plenum Press New York, 1983,
~ 35 ~
Depending upon the value of n, the resins are either liquids or low-melting-point solids. The products with low values of n are the most widely used because, as n increases, melt viscosity also increases and solubility decreases, thus making processing more difficult. Cross-linking under the influence of heat alone is not sufficiently rapid, and hence a curing agent must be added: the epoxy system is very versatile and various types of curing agent may be used.47
The properties of epoxy resin are very much governed by the curing agent used; but generally they have some common peculiarity48:
Mechanical and thermal resistance. Good flexibility.
Chemical inertia.
High adhesion. Waterproofing.
All this properties make epoxy resins an excellent polymer matrix for composites to be used in microelectronic packaging (cf. chap. 2).
Thermal resistance of resins depends on type of curing agent: in general amines give thermal resistance above 250 °C in air49. This is acceptable, whereas the maximum operating temperatures of the power module are approximately 150 °C.
Epoxy resin chosen as polymer matrix for composites of this research, is obtained by crosslinking of DGEBA (Di-GlycidylEther of Bisphenol-A, Scheme 4), with different types of aliphatic or aromatic amines50.
CH3 CH3 O O O O
Scheme 4: DGEBA structure
47 J. P. Critchley, G. J. Knight, W.W. Wright, “Heat-Resistant Polymers”, Plenum Press New York, 1983,
p 44.
48 Pascault, J.P., Sautereau, H., Verdu, J., Williams, R.J.J.: “Chemistry of Crosslinked Polymer Synthesis”,
CRC Press, 2002, Chapter 2.
49 J. P. Critchley, G. J. Knight, W.W. Wright, “Heat-Resistant Polymers”, Plenum Press New York, 1983,
p 47.
~ 36 ~
DGEBA Characterization
DGEBA is often used as precursor (prepolymer) because allows to obtain a wide range of polymers. Polymerization mechanism is based on the addition reactions involving epoxy rings, especially reactive due to the tension ring51, by the hardeners.
DGEBA was characterized by means of FT-IR Spectrophotometry, 1H-NMR
spectroscopy and MALDI-TOF(+) mass spectrometry.
FT-IR spectrum is shown in Figure 23 and characteristic signals are shown in Table 4.
Figure 23: DGEBA FT-IR spectrum
51 Antonio Moroni, Jovan Mijovic, Eli M. Pearce, Cheu Ching Foun: “Cure kinetics of epoxy resins and
aromatic diamines”, 1986, Journal of Applied Polymer Science,Vol. 32, pages 3761–3773.
0 500 1000 1500 2000 2500 3000 3500 10 20 30 40 50 60 70 DGEBA Wavenumbers [1/cm] T ra n sm itt a n ce % a b c d g f e
~ 37 ~
Table 4: DGEBA FT-IR signals
(s = strong signal; m = medium; w = weak; sh = sharp; br = broad)
To confirm DGEBA chemical structure, methyl (2873-2967 cm-1) and methylene aliphatic (2928 cm-1), aromatic (866-724 cm-1) , hydroxyl group (3445 cm-1) and epoxy ring (828, 1246 cm-1) FT-IR signals are evident.
DEGBA 1H-NMR spectrum is shown in Figure 24 with relative chemical structure.
Bond Wavenumbers (cm-1)
Methyl C-H (asymmetric stretching) Methyl C-H (symmetric stretching)
2967 w sh (b) 2873 w sh(c)
Methylen C-H (asymmetric stretching) 2928 w sh (d)
Epoxy ring (asymmetric stretching) (symmetric stretching) 828 s sh (e) 1246 s sh (f) Aromatic C-C ( stretching) 1608 m sh (g) Aromatic C-H (stretching) 3063-2997 Aromatic CH (bending) 866-724
Bonded OH (stretching) 3445 w br (a)
~ 38 ~
ppm (t1) 7.0 6.0 5.0 4.0 3.0 2.0 0 100 200 300 400 500 600 ppm (t1) 4.250 4.200 4.150 4.100 4.050 4.000 3.950 0 50 100 150 200 c b f g’ g d d’ a CH3 CH3 O O O O H H H H H H H H H H a a b b b b c c c c d f f d g g g' g' d' d'~ 39 ~
Figure 25 shows DGEBA MALDI-TOF (+) mass spectrum, which shows characteristic signal at m/z = 341 (DGEBA molecular peaks: MH+).
Figure 25: DGEBA MALDI-TOF (+) mass spectrum; Matrix: IAA, Solvent: THF.
Curing Agents
As curing agent, was used several aliphatic and aromatic amines. In general, they must have more than three active hydrogen atoms and two amino groups in a molecule so that the cured resin becomes crosslinked polymer.
Aliphatic amine rapidly reacts with epoxy prepolymer, is a representative room-temperature curing agent. Resins that have been cured using aliphatic amines are strong, and are excellent in bonding properties. They have resistance to alkalis and some inorganic acids, and have good resistance to water and solvents, but they are not so good to many organic solvents.
340 350 360 0 500 1000 1500 2000 2500 3000 3500 4000 4500 5000 C o u n ts Mass (m/z) CH3 CH3 O CH2 O O CH2 O DGEBA MH+: 341 uma
~ 40 ~
Aromatic amine has weaker basicity than aliphatic amine and slowly cures: normally, the curing of aromatic amine requires higher temperature than aliphatic. 52
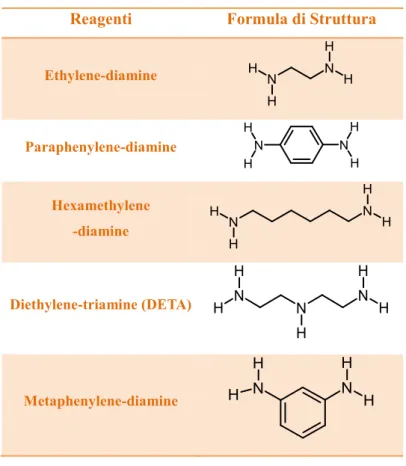
Table 5 shows amines used as curing agents for epoxy resins.
Table 5: Curing agents used
Reagenti Formula di Struttura
Ethylene-diamine Paraphenylene-diamine Hexamethylene -diamine Diethylene-triamine (DETA) Metaphenylene-diamine
3
.1 Epoxy resins synthesis
Resins produced are:
DGEBA + Diethylene triamine (DETA); DGEBA + Ethylenediamine;
DGEBA + Hexamethylenediamine; DGEBA + Para-phenylene diamine; DGEBA + Meta-phenylene diamine
In order to understand best conditions in which to operate for the synthesis of resins and composites (following described), was synthesized a resin model DGEBA: DETA (3: 2) by means of DTA (Differential Thermal Analysis), obtaining curve shown in Figure 26.
52 https://www.threebond.co.jp/en/technical/technicalnews/pdf/tech32.pdf H N H N H H N H H N H H H N H N H H N H N N H H H H N N H H H H
~ 41 ~
Figure 26: DTA curve of resin model DGEBA: DETA 3:2.
DTA curve shows that branching takes place with heating, in fact it is an exothermic peak. Branching event finish at a temperature of 145 °C. Referring to this analysis, all resin polymerizations are conducted at 150 °C, to ensure the end of crosslinking.
To obtain 1 g of these resins, it is always operated in the same way: DGEBA was weighed, stored in a vial and weakly heated. Later was added amine, shaking and flushing with nitrogen (to limit amine groups oxidation). Then vial is inserted in a thermoblock (figure 27) at 150 °C, for 2 hours.
Figure 27: Thermoblock used to cure resins
0 50 100 150 200 250 300 e n d o (W /g ) Temperatura (°C)
~ 42 ~
Molar ratio between DGEBA and amines was 3:2, to maximize crosslinks. All obtained resins are infusible and insoluble.
Table 6 shows molar quantities of reagents.
Table 6: Obtained resins
Resins
DGEBA
Amines
DGEBA:DETA 0,8021g (0,00235 mol) DETA: 166,52 µl (0,00154 mol) DGEBA:Ethylendiamine 1,0082g (0,00290 mol) Ethylendiamine: 120,31 µl (0,00193 mol) DGEBA: Hexamethylendiamine 0,9077g (0,00261 mol) Hexamethylendiamine: 0,1887 g (0,00162 mol)
DGEBA: Para-phenylen diamine 0,8067g
(0,00232 mol) Para-phenylen diamine: 0,1557 g (0,00144 mol) DGEBA:Meta-phenylen diamine 0,8242g (0,00237 mol) Meta-phenylen diamine: 0,1766 g (0,00163 mol)
~ 43 ~
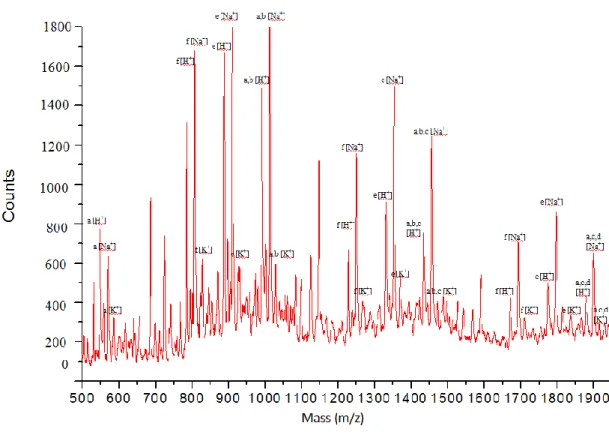
A Molecular ModelIn addition to resins described above, it was prepared a model system DGEBA: DETA (1: 1) in order to study the progress of the branching by means of MALDI-TOF (+). It was used 0.49316 g (1.42 mmol) of DGEBA placing in a vial, heated weakly until melting point (40-44 °C). Later were added 153.10 μl (1,42 mmol) of DETA, stirring. Finally, mixture was put on a Teflon mold for 24 hours, and was obtained a gluey liquid system.
It was verified sample solubility in THF (Tetrahydrofuran) and proceeded with MALDI-TOF(+) analysis, obtaining mass spectrum shown in Figure 28; structural assignment is reported in Table 7.
Figure 28: MALDI-TOF spectrum of molecular model DGEBA/DETA (1:1). Matrix: IAA, Solvent: THF
~ 44 ~
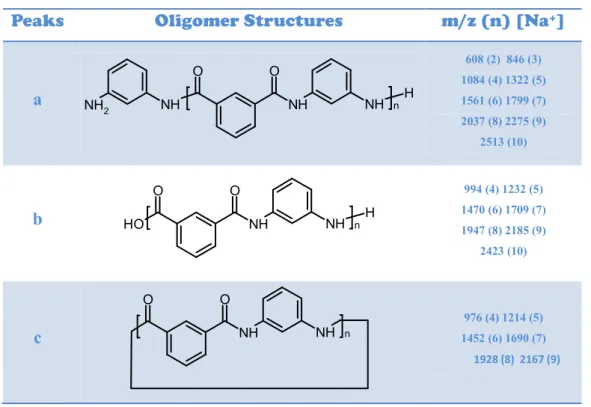
Table 7: Structural peak assignment relative to mass secrum in fig.28
Series Oligomeric Structures H
+ (n) Na+ (n) K+ (n)
a
546 (1) 989 (2) 1431 (3) 1874 (4) 568 (1) 1011 (2) 1453 (3) 1896 (4) 584 (1) 1027 (2) 1469 (3) 1912 (4)b
989 (1) 1431 (2) 1011 (1) 1453 (2) 1027 (1) 1469 (2)c
1431 (2) 1873 (3) 1453 (2) 1895 (3) 1469 (2) 1911 (3) N N N H H H H N N N H H H O OH CH3 CH3 O OH H n N N N O H H OH CH3 CH3 O OH N H N N N O H H O H CH3 C H3 O O H H n H n H N H N H H N N N O H H OH CH3 CH3 O OH N H N N N O H H O H CH3 C H3 O O H H 1 H n H N H N H H~ 45 ~
d
1873 (1) 1895 (1) 1911 (1)e
885 (1) 1327 (2) 1769 (3) 907 (1) 1349 (2) 1792 (3) 923 (2) 1365 (3) 1808 (3)f
782 (0) 1224 (1) 1666 (2) 804 (0) 1246 (1) 1688 (2) 820 (0) 1262 (1) 1704 (2)In mass spectrum can be observed:
The presence of an oligomeric distribution with 1 to 4 number of repeating units, centered on dimer.
Both linear and branched oligomers.
The presence of terminal epoxy and amino groups.
H H N N O OH CH3 CH3 O OH N H N N N O H H OH CH3 CH3 O OH N H H N N H N N N O H H O H CH3 C H3 O O H H * n H N N N O H H O H CH3 C H3 O O H H * n H n H H O OH CH3 CH3 O N N N H H H N N N H H H O OH CH3 CH3 O OH H n O O CH3 CH3 O O OH O OH CH3 CH3 O N N N H H H N N N H H H O OH CH3 CH3 O OH n O
~ 46 ~
3
.2 Epoxy resins characterizations
Thermal Analysis
Thermogravimetric analysis of synthesized resins were conducted in air or nitrogen atmosphere. Thermograms are shown in Figures 29-30 and relative data in Table 8.
Air atmosphere analysis
Thermogravimetric curves
Derivative curves
Figure 29: thermograms and relative derivative curves in air atmosphere
0 100 200 300 400 500 600 700 800 900 -18 -16 -14 -12 -10 -8 -6 -4 -2 0 2 % /m in T (°C) --- DGEBA/DETA ---DGEBA/Hexamethylendiamine ---DGEBA/Ethylendiamine ---DGEBA/1,4-phenylendiamine ---DGEBA/1,3 phenylendiamine 100 200 300 400 500 600 700 800 900 0 2 0 40 60 80 100 W ei g ht % T (°C) --- DGEBA/DETA ---DGEBA/Hexamethylendiamine ---DGEBA/Ethylendiamine ---DGEBA/1,4-phenylendiamine ---DGEBA/1,3 phenylendiamine
~ 47 ~
N
2atmosphere analysis
Thermogravimetric curves
Derivative curves
Figure 30: thermograms and relative derivative curves in air atmosphere
0 100 200 300 400 500 600 700 800 900 -22 -20 -18 -16 -14 -12 -10 -8 -6 -4 -2 0 2 4 % / mi n T (°C) DGEBA+DETA DGEBA+ESAMETILENDIAMMINA DGEBA+ETILENDIAMMINA DGEBA+1,4FENILENDIAMMINA DGEBA+1,3FENILENDIAMMINA 100 200 300 400 500 600 700 800 900 0 20 40 60 80 100 W e igh t % T(°C) --- DGEBA/DETA ---DGEBA/Hexamethylendiamine ---DGEBA/Ethylendiamine ---DGEBA/1,4-phenylendiamine ---DGEBA/1,3 phenylendiamine --- DGEBA/DETA ---DGEBA/Hexamethylendiamine ---DGEBA/Ethylendiamine ---DGEBA/1,4-phenylendiamine ---DGEBA/1,3 phenylendiamine
~ 48 ~
Table 8: Datasheet concerning resins thermogravimetric analysis
Resins Atmosphere Tonset (°C) PDT (°C) %Char
3 DGEBA + 2 DETA air 349,6 372,8 7,2
nitrogen 353 376,8 7,2
3 DGEBA + 2 Hexamethylendiamine air 346,2 384,8 0,2
nitrogen 360,5 380,3 11,6
3 DGEBA + 2 Etylendiamine air 348,9 363 0
nitrogen 350,6 372,6 9,1
3 DGEBA + 2 1,4-phenylendiamine air 342,5 355 1,2
nitrogen 346,7 356,7 18,5
3 DGEBA + 2 1,3-phenylendiamine air 368,2 379,6 0,3
nitrogen 370,6 383,1 18,6
Thermogravimetric analysis shows that resins, in air, begin to degrade at 342.5 °C to 368.2 °C; while in nitrogen between 346.7 ° C to 370.6 ° C. In air, cause oxidative events, they tend to degrade at lower temperature. These resins also reach the maximum degradation rate at temperatures between 355 °C and 385 °C. In general their decomposition temperature would permit the use such as packages in power devices, where temperatures, generally, are lower than 275 °C53.
In addition to the thermogravimetric analysis, were performed DTA characterizations; obtained graphs are shown in Figure 31.
53 http://www.precisionresistor.com/SM063-.5W-Wire-Wound-Precision-Power-Axial Resistor.html
3. Polymeric Matrix
~ 49 ~
Figure 31: DTA thermograms of resins
DTA curves of resins do not show particular events, with the exception of those related to DGEBA:DETA (3:2) and DGEBA:ethylenediamine (3: 2), in which glass transitions (Tg) are observed.
During the curing process (discussed at the beginning of this chapter) may be that macromolecular structure contains amounts of oligomers, free or aggregates, and soluble branched molecules. The system, therefore, is defined as a biphasic system sol-gel. In the course of the reaction may occur another phenomenon, the vitrification: conversion process of a viscous liquid or an elastic gel in a glassy solid. This phenomenon is characterized by the variation of the kinetics of reaction mechanism, passing from chemical to diffusive type: in fact, the increase of density, due to the presence of cross-links between the chains, the monomer reactivity will be lower and dependent on diffusion through the polymer mass.
The follow diagram (figure 32), called TTT (Time-Temperature-Transformation) diagram, describes chemical-physical phenomena during crosslinking reaction.
50 100 150 200 250 300 en do W /g T (°C) --- DGEBA/DETA ---DGEBA/Hexamethylendiamine ---DGEBA/Ethylendiamine ---DGEBA/1,4-phenylendiamine ---DGEBA/1,3 phenylendiamine
~ 50 ~
Figure 32: TTT isothermal cure diagram for generic epoxy systems 54
This diagram shows experimental time to reach various events depending on the temperature of curing. In particular, it can observe three temperatures relating to crosslinking event:
Tg0: below this temperature there is no reaction between prepolymer and
hardener.
Tggel: for ideal systems gelation and vitrification occur simultaneously and the
corresponding temperature is indicated as Tggel. At a temperature comprised
between Tg0 and Tggel, the liquid resin reacts until begins the vitrification. After
that, reaction speed will be strictly dependent on diffusion processes of the reactant species.
Tg∞ is the treatment temperature to which the degree of reaction reaches the maximum value; it is theoretically equal to one but experimentally very difficult to obtain.
The presence of amorphous portions in DGEBA:DETA (3:2) and
54 http://thermosets.wordpress.com/category/ttt-diagram/
~ 51 ~
DGEBA:ethylenediamine (3:2) resins is, probably, due to reduced segmental mobility of gel system that restricts diffusion of sol phase. Therefore the presence of these amorphous portions makes necessary the use of higher curing temperatures or times to complete crosslinking event.
Structural Analysis
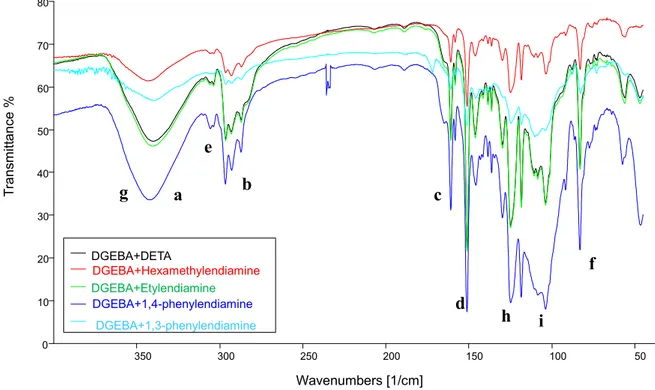
Finally, the resins were characterized by means of FT-IR spectroscopy. Comparative spectra are shown in Figure 33 and the relative signals are indicated in Table 9.
Figure 33: FT-IR spectra of resins DGEBA+DETA, DGEBA+Hexamethylendiamine, DGEBA+Etylendiamine, DGEBA+1,4-phenylendiamine (3:2), DGEBA+1,3-phenylendiamine
50 0 100 0 150 0 200 0 250 0 300 0 350 0 0 10 20 30 40 50 60 70 80 DGEBA+DETA DGEBA+Hexamethylendiamine DGEBA+Etylendiamine DGEBA+1,4-phenylendiamine DGEBA+1,3-phenylendiamine Wavenumbers [1/cm] g a b e c d h i f T ra n sm itt a n ce %
~ 52 ~
Table 9: resins FT-IR signals
(s = strong signal; m = medium; w = weak; sh = sharp; br = broad)
Bond Wavenumbers (cm-1)
O-H (stretching) 3426-3401 m br (a)
C-H(methyl stretching) 2874-2867 w (b)
C-C (aryl stretching) 1608 m sh (c)
1510 s sh (d)
C-H (aryl stretching) 3102-3036 w br(e)
C-H (aryl bending) 824-831 m sh(f)
N-H (amino stretching) O-H overlying (g)
C-O-C (arylalkyll ether asymmetric stretching) 1247-1238 s sh(h)
C-O-C (arylalkyl ether symmetric stretching) 1037-1026 s br (i)
Spectra show a strong signal relative to hydroxyl due to epoxy rings of DGEBA opening and traces of water (3426-3401 cm-1 ). Aromatic, aliphatic and ether systems belong to DGEBA. We also observed disappearance of epoxy ring stretching signal, typical of the DGEBA prepolymer.
~ 53 ~
4. Fillers
Fillers are, generally, additives in solid form, and differ from polymer matrix in both structure and composition. The union between polymer and fillers has a synergistic effect: each material contributes to compensate for defects of other. This effect depends on various factors: polymer and filler nature, their shape, size and distribution in polymer matrix. Fillers can be inorganic or organic compounds and, according to their behavior, can be inert or active fillers (reinforcing)55.
Inert fillers, such as talc and CaCO3, are currently employed also to increase the mass of
product and consequently decrease price. Active fillers produce specific improvements in mechanical, thermal, physical, and are therefore known as reinforcing fillers. The presence of a filler having a high thermal conductivity and/or high thermal resistance, could improve thermal efficiency of polymer matrix56, that is the aim of our research. For this purpose, it was used various types of fillers: organic or inorganic, synthetic or commercial.
In particular, as organic fillers were used polyamidic (poly(meta-phenylene isophthalamide), poly(para-phenylene terephthalamide), Kelin 13057), polyimidic (poly(para-phenylen-pyromellitimide) and polycyclic (Grafenoxide) compounds. As inorganic fillers were used SiO2 and MoS2.
SiO2, MoS2, and Kelin 130 are commercial products, while all the others have been
specially synthesized.
55 G. Vittorio Villavecchia “Nuovo dizionario di merceologia e chimica applicata”, Vol. 2, p. 805
56 E.R. Egan, C.H. Amon, “A Study on the Thermal Conductivity Enhancement of Several Polymer
Composites for Embedded Electronics Applications” - ASME-PUBLICATIONS-HTD, 1997 - ASME
~ 54 ~
4.1 Polyamidic fillers
Polyamides are macromolecules characterized by amino group (Scheme 5) from which depend their properties.
O
R N
R'' R'
Polyamides can be synthesized by condensation polymerization of a dicarboxylic acid (or their derivatives) and a diamine58 or via ring-opening polymerization of a lactam59. Polyamides have a lot of inter-chain hydrogen bonds giving intense forces of molecular cohesion, reinforced by significant percentages of crystallinity due to structural chains regularity.60 This generates excellent mechanical properties with a high elastic modulus, hardness and abrasion resistance.
Polyamides can be classified in aliphatic and aromatic; particularly, aromatic polyamide have higher thermal efficiency than aliphatic, in fact they have a maximum rate degradation higher than 700 °C 61, while aliphatic polyamide at 400-500°C.62
In addition, some aromatic polyamides have a high thermal conductivity (10-30 W/mK63,64).
For this reason, as polyamidic filler for package composites, we have chosen aromatic polyamides:
poly-(meta-phenylene isophthalamide), poly-(para-phenylene terephthalamide), Kelin 130.
58M. I. Kohan, S. A. Mestemacher, R. U. Pagilagan, K. Redmond, “Polyamides”, Ullmann's Encyclopedia
of Industrial Chemistry, 2003.
59C. Brisi, Chimica applicata, 3th ed., Levrotto & Bella, Torino, 1997, p. 448
60 K. Weissermel, H. J. Arpe, C. R. Lindley, “Industrial organic chemistry”, 4th ed., Wiley-VCH, 2003,
pp. 239-266
61 Mark J.E., “Polymer Data Handbook”, Oxford Univ. Press, 1999, p.140. 62 Mark J.E., “Polymer Data Handbook”, Oxford Univ. Press, 1999, pp. 172-229. 63 Choy, C. L., et al., J. Polym. Sci., Part B: Polym. Phys., 33(14), 1995.
64 Poulaert, B., et al. Polym. Commun. 26(5), 1985.
~ 55 ~
4.1.1 Synthesis and characterization of Poly(meta-phenylene isophthalamide)
Poly(meta-phenylene isophthalamide) is commercially known as “Nomex” (Scheme 6), Du Pont registered trademark65, that indicates a meta-aramid66 developed in 1967.
O O N H * NH * n
Scheme 6: Poly-(meta-phenylene isophthalamide)
Nomex is heat-resistant, flame-retardant and electrical insulator. It have high extensibility relative to other aromatic polyamide, high degradation and glass transition temperature, excellent dielectric property, and good spinnability.67
To obtain approximately 6 g of Poly(meta-phenylen isophthalamide) having a polymerization degree of about 12, were used 2.4 g of 1,3-Phenylenediamine (0.022193 mol) and 4 .3 g of isophthaloyl chloride (0.019542 mol), in a molar ratio 13:12.
This molar ratio was chosen on Equation 3:
Equation 3
Where
( ).
are isophthaloyl chloride moles and are 1,3 phenylen diamine moles.
Polymer was obtained in two steps (Scheme 7). At first, 120 ml of a mixture THF/DMF (70:30) were dried and degassed. Subsequently, the mixture was divided into equal portions: one portion was used to solubilize 1,3-phenylen diamine and 6 ml of
65 Stamatoff, G. S. U.S. Patent 3,228,910 (to E. I. du Pont), 1966.
66 “Aramid” is contraction of “Aromatic Amides”.
67 Lewin, M., and J. Preston, eds. Handbook of Fiber Science and Technology. Marcel Dekker, New
~ 56 ~
anhydrous Triethylamine (TEA, protons acceptor). Then this solution was placed in ice bath (T = 0 °C).
The second portion of THF/DMF mixture was used to solubilize isophthaloyl-dichloride; this second solution was slowly added to diamine solution placed on ice. N2
was flushed and the reaction was carried on for one hour.
O O Cl Cl H2N NH2 N H2 NH2 CH3COOH aq O O N H * NH * m O O NH O O N H N H N H NH2 m NH2 O O NH O O N H N H N H NH3 m NH3 + 12 13 T=0°C TEA m: 0-15 m: 0-15 excess 1st STEP 2nd STEP m: 0-15 + +
Scheme 7: Synthesis of poly(meta-phenylen isophthalamide)
Second step concern the addition of 2.4 g (22.19 mmol) of 1,3-Phenylenediamine, to ensure amino as end groups. After 30 minutes, products reaction was precipitate in acidified H2O (acidification was obtained with acetic acid until a pH of about 2-3) to
~ 57 ~
remove amine excess and protect terminal amino groups; precipitate was several times washed with deionized water.
Finally, obtained product was placed in oven at 40 °C for one hour, and then under vacuum for 3 days.
Poly(meta-phenylen isophthalamide) obtained as above described, was thermally and
structurally characterized by means of TGA, DTA, FT-IR, MALDI-TOF and 1H-NMR.
Thermal Analysis
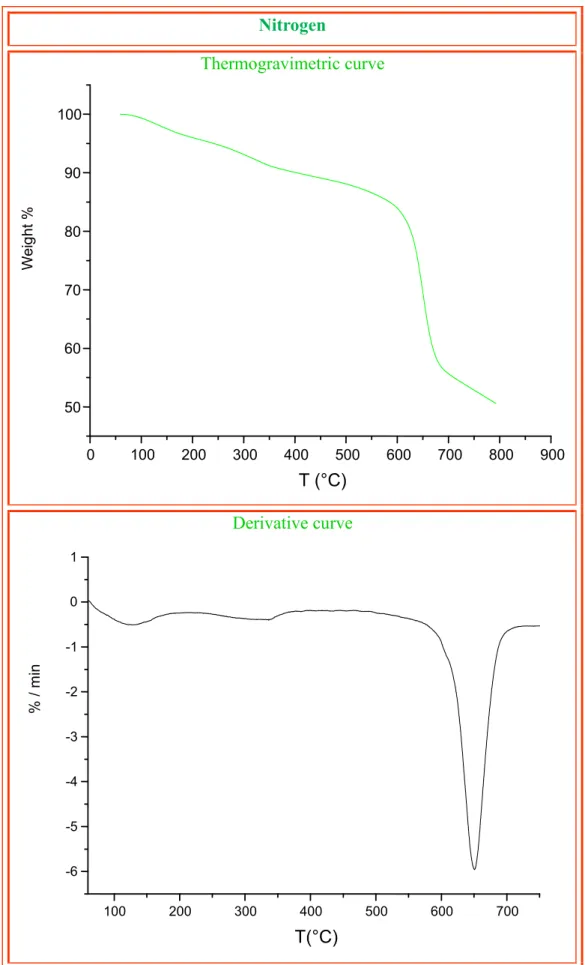
Figures 34 and 35 shows respectively TGA analysis in air atmosphere (black curves) and nitrogen atmosphere (red curves) of Poly(meta-phenylen isophthalamide) and relative derivative curves.
Figure 34: Thermogravimetric curves of Poly(meta-phenylene isophthalamide)
100 200 300 400 500 600 700 800 900 0 20 40 60 80 100 W e igh t % T (°C)
~ 58 ~
Figure 35: Derivative curves of Poly(meta-phenylene isophthalamide)
TGA shows that Nomex, in air flow, starts to degrade at 532 °C, while in nitrogen, at 432 °C. This difference is a consequence of synthesis impurities (free amine, water, and amine salts); in particular TGA analysis under nitrogen flow, avoiding oxidation of free amino groups, favors aminolysis of polyamide chains. Rate of degradation for this system reaches a maximum at about 500 °C.
Residual percentage in air is equal to zero, because everything is oxidized.
Overall, thermal behavior of this synthesized compound, more oligomeric than polymeric, is close to literature.68
DTA in nitrogen atmosphere of Poly(meta-phenylene isophthalamide) is shown in figure 36.
68 Mark J.E., “Polymer Data Handbook”, Oxford Univ. Press, 1999, p.709.
0 100 200 300 400 500 600 700 800 900 -12 -10 -8 -6 -4 -2 0 % /mi n T (°C)