https://doi.org/10.5194/nhess-18-2969-2018 © Author(s) 2018. This work is distributed under the Creative Commons Attribution 4.0 License.
Local-scale post-event assessments with GPS and
UAV-based quick-response surveys: a pilot case
from the Emilia–Romagna (Italy) coast
Enrico Duo1, Arthur Chris Trembanis2, Stephanie Dohner2, Edoardo Grottoli1, and Paolo Ciavola1
1Department of Physics and Earth Sciences, University of Ferrara, Ferrara, Italy
2School of Marine Science and Policy, University of Delaware, Newark, DE 19716, USA
Correspondence: Enrico Duo ([email protected])
Received: 19 September 2017 – Discussion started: 10 October 2017
Revised: 19 September 2018 – Accepted: 14 October 2018 – Published: 12 November 2018
Abstract. Coastal communities and assets are exposed to flooding and erosion hazards due to extreme storm events, which may increase in intensity due to climatological fac-tors in the incoming future. Coastal managers are tasked with developing risk-management plans mitigating risk during all phases of the disaster cycle. This necessitates rapid, time-efficient post-event beach surveys that collect physical data in the immediate aftermath of an event. Additionally, the in-clusion of local stakeholders in the assessment process via personal interviews captures the social dimension of the im-pact of the event. In this study, a local protocol for post-event assessment, the quick-response protocol, was tested on a pi-lot site on the Emilia–Romagna (Italy) coast in the aftermath of an extreme meteorological event that occurred in February 2015. Physical data were collected using both real-time kine-matic Geographical Positions Systems and unmanned aerial vehicle platforms. Local stakeholders were interviewed by collecting qualitative information on their experiences be-fore, during, and after the event. Data comparisons between local and regional surveys of this event highlighted higher data resolution and accuracy at the local level, enabling im-proved risk assessment for future events of this magnitude. The local survey methodology, although improvable from different technical aspects, can be readily integrated into re-gional surveys for improved data resolution and accuracy of storm impact assessments on the regional scale to better in-form coastal risk managers during mitigation planning.
1 Introduction
Extreme storm events have the potential to produce coastal flooding and erosion, reshape coastlines, impact infrastruc-tures, and expose populations to hazardous conditions. The most damaging events consist of a combination of extreme wave heights, storm surge, wind direction, and tidal stage that interact with the morphology of the beach and adjacent infrastructures generating direct and indirect impacts (Van Dongeren et al., 2018; Viavattene et al., 2018). Given the ex-pectation of increasing storm intensities and occurrence (Ba-son et al., 2007), accurate and rapid field data collection must occur to best inform risk management and policy decisions (Casella et al., 2016). To ensure that appropriate (risk) man-agement plans are implemented, precise and high-resolution field measurements are crucial to understand storm effects on exposed communities, providing input data sets for nu-merical modelling for future event impacts (Lee et al., 1998; Stone et al., 2004; Nicholls et al., 2007). Additionally, the inclusion of local stakeholder interviews is essential to ap-propriately address group values, create risk-reduction plans supported by locals, and implement proposed plans within the community (Martinez et al., 2018). Coastal managers must determine which management protocols are appropri-ate during all phases of the risk cycle including prevention, preparedness, response, and recovery while balancing needs on local, regional, and country scales. Europe recognizes the value of standardized protocols for risk management as an ef-fective way to coordinate field efforts, improve hazard maps, and enhance risk-reduction plans (Poljanšek et al., 2017).
However, post-storm assessments require capturing the morphologic signature of the event using rapid, quantitative mapping as soon as safe conditions allow, following the event but before recovery processes begin (i.e. natural or human-driven) (Morton et al., 1993; Bush et al., 1999; Morton, 2002). This data can be difficult to obtain as traditional post-storm survey techniques are expensive or time consuming on large scales. To properly quantify impacts, pre-storm quanti-tative mapping of the area is necessary before impacts can be attributed to a single storm. In recent years, autonomous plat-form methodologies for coastal mapping and extreme event impact assessment were proposed and tested to improve tra-ditional, expensive, or time-consuming mapping approaches on both the emergent beach (Mancini et al., 2013; Casella et al., 2016; Turner et al., 2016) and the submerged nearshore area (Trembanis et al., 2013).
Real-time kinematic Geographical Positions Systems (RTK GPS) for ground-based surveys (Morton et al., 1993; Theuerkauf and Rodriguez, 2012) are the traditional method for topographic data, requiring highly accurate (sub-decimetre) positioning measurements. These systems are uti-lized in the coastal environment for temporal and spatial monitoring of many coastal morphologic features through periodic monitoring and post-event surveys (Larson and Kraus, 1994; Benedet et al., 2007; Hansen and Barnard, 2010; Theuerkauf and Rodriguez, 2012). Since the sam-pling point density of the RTK GPS survey affects the ac-curacy of beach morphology representation, insufficient res-olutions (e.g. representing the beach with traditional pro-file spacings of more than 100 m) can lead to imprecise or misleading morphological interpretations of storm impacts (Swales, 2002; Berstein et al., 2003; Pietro, et al., 2008; Theuerkauf and Rodriguez, 2012). The ideal resolution of the RTK GPS survey depends on the scale of the study and on its location. Terrestrial laser scanners or total stations im-prove point density but require similar time and physical ef-fort as RTK GPS, particularly when surveying large areas (Saye et al., 2005; Theuerkauf and Rodriguez, 2012; Lee et al., 2013). Improvements in remote-sensing technology have increased data resolution through airborne lasers (lidar) and satellite imagery but the high costs of operations and in-frequent surveys render these options impractical for local scales and rapid or frequently repeated surveys (Stockdon et al., 2002; Young and Ashford, 2006; Anderson and Gaston, 2013). Phillips et al. (2017) proposed a high-frequency lidar surveying methodology by fixing a laser system to a hous-ing structure on a beach to continuously measure topographic profiles. The system provided unique, temporally dense mor-phological recovery results but only of a single cross-shore profile, thereby limiting the scope of data and ignoring the varied, three-dimensionality of coastal response.
Unmanned aerial vehicles (UAVs), known informally as “drones”, attempt to address temporal and spatial sampling issues on local scales thanks to rapid deployment, eco-nomic feasibility, and accurate high-resolution topographic
data when monitoring hydro-morphological changes in the coastal zone (Berni et al., 2009; Westoby et al., 2012; Casella et al., 2016; James et al., 2017). Moloney et al. (2018) com-pared surveying methods for coastal dune monitoring in New Zealand and concluded that, compared to total station, RTK GPS and terrestrial laser scanner methods, the UAVs proved to be the cheapest option while being more accurate than to-tal station and RTK GPS methods. The UAVs were ideal for monitoring short- and long-term coastal dune systems with elevation data and aerial images. Seymour et al. (2018) com-pared terrestrial laser scanner and a UAV equipped with an RTK GPS system for coastal monitoring and management in North Carolina (US). This study provided additional insights into field implementation and post-processing, including lim-itations of UAV data related to the environment (e.g. texture of the surveyed surface, solar angle). The study presented specific operational guidelines and demonstrated that UAVs provide affordable, frequent coastal environment monitoring on local scales.
Beyond the pure physics of coastal risk management lies the often overlooked and unquantified social dimen-sion of the local community affected daily by these hazards and management plans. Previous researchers documented that the inclusion of local communities in assessing coastal risk and creating reduction plans, improves the quality of the plans while having a positive feedback on the popu-lation through increased risk awareness and preparedness (Pescaroli and Magni, 2015; Becu et al., 2017; Gray et al., 2017; Martinez et al., 2018). In this sense, interview-ing local people in the immediate aftermath of an extreme coastal event provides important information on the local evolution of the storm, on the effectiveness of the imple-mented emergency preparedness, and response phases (Mar-tinez et al., 2018).
Building on the foundations of the aforementioned work, this study presents a pilot field case focused on applying a quick-response methodology for local post-storm coastal change assessment. This method relies on a combination of traditional RTK GPS surveys coupled with UAV aerial imagery and qualitative data (i.e. interviews of local stake-holders). The aim of combining these approaches is creation of a rapid and holistic coverage of the field site and storm event. Implementation of the assessment approach was car-ried out in the Emilia–Romagna region of Italy. At the re-gional level, managers have adopted effective protocols for coastal risk management, early-warning systems, and post-storm hazard and risk assessments (Ligorio et al., 2012; Perini et al., 2015b, 2016). The pilot study of the current pa-per demonstrates how the proposed approach provides local-scale high-resolution data capable of capturing individual storm-induced coastal changes. Furthermore, this integrated approach provides detailed insights into physical and social aspects that can be applied at the local, as well as at re-gional and national levels, for effective, coordinated cross-disciplinary management purposes.
2 Case study
2.1 Regional settings and study site 2.1.1 Regional settings
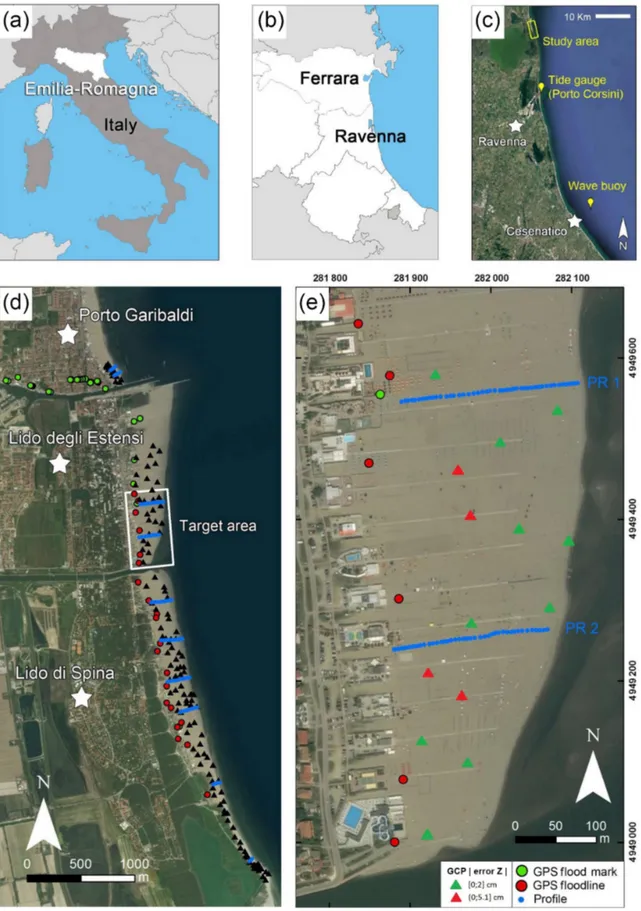
A stretch of approximately 7 km of coast within the Fer-rara province (Emilia–Romagna region), located on the Ital-ian side of the northern Adriatic Sea (Fig. 1a, b), was sur-veyed immediately following an extreme (low-frequency and high-impact) storm event (hereafter called the St Agatha storm; see Sect. 2.3) that occurred on 5–7 February 2015. The coastal landscape in Emilia–Romagna is generally com-prised of low-lying sandy beaches with limited topographi-cally elevated areas usually in the form of either relict beach ridges or artificial embankments (Armaroli et al., 2012). The shore is comprised of alternating spaces of natural areas with native dunes intermixed with urbanized areas consisting of buildings, roads, and walkways. Much of the sandy coast is currently occupied by tourist facilities, residential buildings, and bathing structures, as a consequence of 60 years of con-tinuous development and urbanization on relict coastal ridges (Sytnik and Stecchi, 2015). Touristic beaches contain private concessions (i.e. properties located on public beach areas, granted to private individuals for commercial/tourism activ-ities) that has provided sunbathing and food services since the 1970s. Immediately behind the concessions, small resi-dential towns developed and nowadays accommodate many second homes, hotels, and restaurants. These factors combine to increase the area’s exposure to coastal hazards (i.e. flood-ing and erosion), particularly in the Ferrara and Ravenna provinces, where some elevations are below mean sea level (MSL) (Perini et al., 2010). Since the end of World War II, a sediment deficit has affected the littoral budget due to de-creased sediment transport load of local rivers, mainly caused by anthropogenic controls on the rivers and their basins (Pre-ciso et al., 2012) and the reforestation of the Apennines (Billi and Rinaldi, 1997). This problem has been exacerbated over the last few decades by land subsidence, most likely caused by groundwater and gas extraction activities (Teatini et al., 2005; Taramelli et al., 2015). These issues prompted action in the form of defence structures (groins, breakwaters, etc.) being built along the coast in an effort to mitigate shore-line retreat due to sediment starvation (Armaroli et al., 2012). The wave climate for the region is dominated by low wave energy (mean Hs≈0.4 m, Tp≈4 s) with a semi-diurnal
microtidal regime (neap tidal range = 0.30 m; spring tidal range = 0.8 m). Storm significant wave heights with a 1-year return period range up to 3.3 m (Armaroli et al., 2009) and storm surges with a 2-year return period reach up to 0.6 m (Masina and Ciavola, 2011). These storm events mainly occur in the autumn and winter months (October–March). Storms are mainly characterized by ENE waves associated with bora (NE) winds or by SE waves when caused by scirocco (SE) winds. Storm-surge events predominantly
oc-cur during scirocco winds, which coincide with the main SE–NW orientation of the Adriatic Sea. Bora storm waves are generally large and steep, whereas scirocco waves are smaller in height but with a longer wave period due to the increased fetch of lower winds speeds across the Adriatic (Harley et al., 2016).
Several methods for storm characterization have been de-veloped and implemented in recent years for the Mediter-ranean coast. Mendoza et al. (2011) proposed a five-class intensity scale, defining a storm as an event in which the significant wave height exceeds 1.5 m for at least 6 h (Men-doza and Jiménez, 2006). Moving to a more local perspec-tive, Armaroli et al. (2012) adopted the same physical def-inition of storm events for the northern Adriatic Sea. Two storms are considered independent when the significant wave height decreases below the 1.5 m threshold for 3 or more con-secutive hours. By analysing the events and their impacts to-gether, Armaroli et al. (2012) classified a storm as “poten-tially damaging” when it exceeded the critical wave and total water level (TWL = surge + tide) thresholds of Hs≥2 m and
TWL ≥ 0.7 m for urbanized beaches, and Hs≥3.3 m and
TWL ≥ 0.85 m for natural beaches. 2.1.2 Case study site and target area
The pilot case study site is located between Porto Garibaldi and Lido di Spina and is characterized by highly urbanized, low-lying sandy beaches, with touristic concessions (con-crete and/or wood buildings) directly facing the sea. The width of the beach ranges from ∼ 20 to ∼ 150 m. The pre-dominant sediment transport (longshore drift) is directed northward. The southern jetty of the canal harbour (Porto Canale) in Porto Garibaldi traps longshore sediment, result-ing in widenresult-ing of the beach at Lido degli Estensi and ero-sion of the Porto Garibaldi beach. Eroero-sion appears again in the southern part of Lido di Spina (Nordstrom et al., 2015), as shown in Fig. 1d. The southernmost concession at Lido di Spina defines the southern boundary of the case study. In the whole area, the concessions are affected by coastal storm impacts during extreme events (Nordstrom et al., 2015). The pilot case study site presents areas that are coastal risk prone at the regional level (Perini et al., 2016; Armaroli and Duo, 2018; Sanuy et al., 2018). The main analysis focuses on the target area on the southernmost portion of the beach at Lido degli Estensi (Fig. 1e) in the municipality of Comacchio, east of Ferrara and north of Ravenna.
2.2 Coastal alerts and monitoring in Emilia–Romagna The Emilia–Romagna region (RER) developed a protocol for coastal storm alert and monitoring, within the framework of a wider system for hydro-geological risk alert, and a con-glomerate of agencies and regional services are involved in the process (Ligorio et al., 2012). The daily forecasting of waves, surge, and coastal impacts, provided by the Servizio
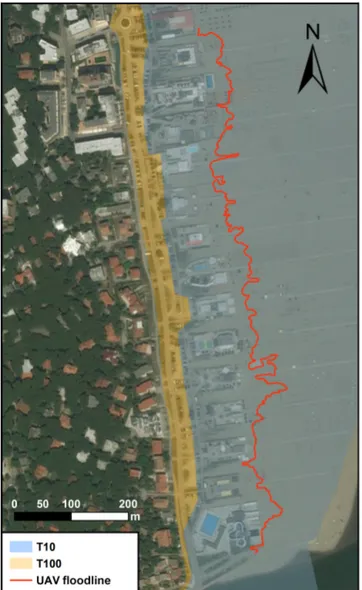
Figure 1. Field study site locations: (a) Emilia–Romagna region, (b) coastal regional domain, (c) locations of the nearest tide gauge and wave buoy, (d) pilot case study site, and (e) target area for data comparison.
IdroMeteoClima of the Agenzia Regionale per la Preven-zione, l’Ambiente e l’Energia (ARPAE-SIMC) are evaluated, along with the weather forecast, by the regional geologi-cal service (Servizio Geologico Sismico e dei Suoli, SGSS), the Centro Funzionale of ARPAE (ARPAE-CF), the regional Servizio Difesa del Suolo della Costa e Bonifica (SDSCB), the technical services (Servizi Tecnici di Bacino, STB), the interregional agency of the Po river (Agenzia Interregionale Fiume Po, AIPO) and the civil protection.
The forecasting of coastal hazards and impacts is pro-vided through the Emilia–Romagna early-warning system (E-R EWS), developed in the framework of the EU FP7 MICORE project (www.micore.eu, last acecess: 25 October 2018), with the objective of predicting the imminent arrival of a storm as a tool to be used by civil protection agencies and local communities (Ciavola et al., 2011; Harley et al., 2012, 2016; Jiménez et al., 2017). The E-R EWS is operational and maintained by ARPAE-SIMC and the University of Ferrara (UNIFE) through running a sequence of numerical models daily (COSMO, SWAN, ROMS, and XBeach). The model chain aims to reproduce the hydro-morphodynamic response of the beach for 22 representative cross-shore profiles dis-tributed along the regional coast. The final output of the chain is transformed into a format suitable for decision makers and end users (Harley et al., 2012). The EWS tool is based on storm impact indicators (SIIs) (Ciavola et al., 2011) focusing on the magnitude of water ingression and type of exposed assets, which are described as natural or urbanized beaches (Harley et al., 2016). The daily outputs are published online at http://geo.regione.emilia-romagna.it/schede/ews/ (last ac-cess: 25 October 2018).
From 2017, the RER activated an online portal (https: //allertameteo.regione.emilia-romagna.it/, last access: 25 Oc-tober 2018), where the alerts are published in a GIS-based interface. In case of forecasted over-threshold events, or un-expected ones, the alert is issued to the civil protection, who forwards it to the local technical services and municipalities. At this point, the monitoring phase begins, and updates are issued based on further observations (i.e. waves, water lev-els, wind, and rains) and forecasting updates. If necessary, the emergency response is activated and implemented by the civil protection.
The SGSS oversees data collection and elaboration for coastal risk-management purposes (Perini et al., 2015b; Armaroli and Duo, 2018). The geological service collects all available information from forecasting, observations, online pictures, webcam movies and news during and after a coastal event. After significant coastal events, the STBs are activated and implement on the ground surveys, documenting local impacts and measuring the water ingression. The SGSS also surveys (with DGPS techniques) 18 beach profiles in 13 locations along the coast, belonging to the regional beach monitoring network. After particularly damaging events, the civil protection flies over the impacted areas taking oblique aerial pictures.
However, this is not a regular procedure and is infrequently implemented. All the information is elaborated and archived by the SGSS in the public GIS-based coastal information system (Sistema Informativo del Mare e della Costa, SIC; http://ambiente.regione.emilia-romagna.it/geologia/temi/ costa/sistema-informativo-del-mare-e-della-costa-sic, last access: 25 October 2018), in the in_Risk and in_Storm platforms (Perini et al., 2015b).
2.3 Storm event
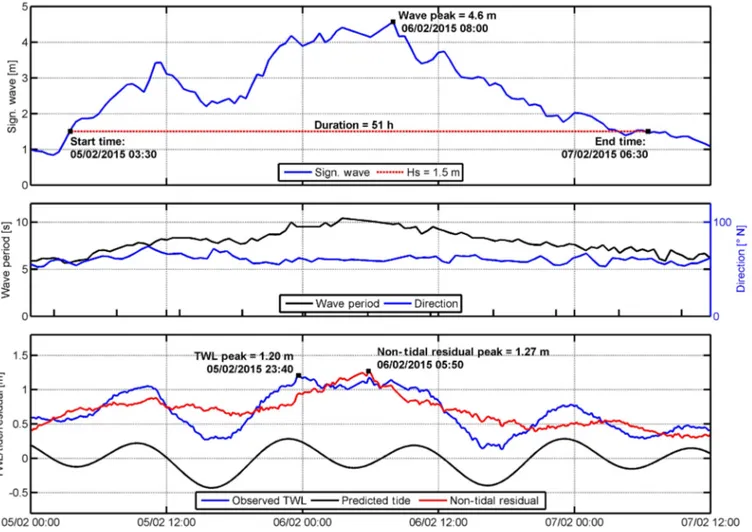
During the period 5–7 February 2015, an extreme storm hit the Emilia–Romagna coast and the whole of the northern Adriatic Sea, causing extensive flooding of urban and nat-ural areas. The storm occurred in extreme regional weather conditions, which included heavy snow in the Apennines and rain in the alluvial plain of the Emilia–Romagna (ARPA E-R SIMC, 2015; Perini et al., 2015a, b). The recorded water level was collected from the tide gauge of ISPRA (Istituto Supe-riore per la Protezione e la Ricerca Ambientale) located in Porto Corsini, Ravenna (Fig. 1c). Wave data were recorded by the ARPA-ER (Agenzia Regionale per la Prevenzione e l’Ambiente dell’ Emilia–Romagna) offshore wave buoy lo-cated at 10 m depth, 5.5 km offshore from the town of Cese-natico. The event, referred to here by the colloquial name of the St Agatha storm, was identified following the Armaroli et al. (2012) storm definition. It began at night and lasted for 51 h, making it one of the longest storms recorded by the local wave buoy offshore of Cesenatico (Fig. 1c) since its deployment in May 2007. The maximum water level (surge +tide) of 1.20 m was measured at 23:40 GMT on 5 Febru-ary. The non-tidal residual time series was assessed based on tidal predictions (calculated for Porto Corsini using data for the period 2007–2015 with t_tide; Pawlowicz et al., 2002) and showed a peak of 1.27 m in the morning of 6 Febru-ary (Fig. 2). The skew surge for the tidal cycle that included the peak of the total water level was calculated and resulted in 0.92 m. The significant wave height (4.6 m) and period (9.9 s) at the peak were recorded in the morning of 6 Febru-ary (Fig. 2). The wave direction was consistently from the ENE sector for the entire event duration.
According to the Mediterranean storm classification of Mendoza et al. (2011), the St Agatha storm is assigned to the severity class IV (severe). The storm consequences were magnified by the combination of high waves, high water level, and intense rainfall, culminating in massive local river discharge (Perini et al., 2015a, b). Furthermore, according to the classification of Armaroli et al. (2012), the St Agatha storm was expected to have a strong impact on the coast, exceeding the combined wave and water level hazard thresh-olds.
Perini et al. (2015b) reported that the event was forecasted by the regional forecasting chain and the E-R EWS. An alert of level 1 (out of 3 levels) was issued at regional level already on 4 February. The following day it was increased to level 2.
Figure 2. St Agatha storm hydrodynamic data including significant wave height (m), wave period (s), direction of waves (nautical degrees), total water level (m), predicted tide (m), and non-tidal residual (m). The start and end times of the storm are referenced to the local storm threshold condition of Hs=1.5 m and referenced to GMT.
The regional protocol allowed to monitor the evolution of the event with the support of measuring stations (i.e. weather, waves, water levels), webcams, waves, and surge forecasts and the EWS alerts (updated every day). Damage monitor-ing began on 6 February, consistmonitor-ing of the STBs visitmonitor-ing the impacted locations from the ground, while the civil protec-tion implemented a first helicopter flight. This flight provided oblique aerial pictures used later to map storm impacts. Two other flights were launched on 8 and 10 February to com-plete the survey. In that period, the SGSS collected online material such as pictures, movies, and news. All the infortion was archived in the regional database, although the ma-terial is currently not available online. However, information on the storm and its impacts are available at the RISC-KIT Storm Impact Database (http://risckit.cloudapp.net/risckit/#/, last access: 25 October 2018) (Ciavola et al., 2018).
The whole data set was used to evaluate the impacts along the coast, and the observed ingression line (elaborated from aerial pictures and local measurements, where available) was compared with the risk maps produced for the Floods
Direc-tive (2007/60/EC) (Perini et al., 2016). Based on this analy-sis, Perini et al. (2015b) showed that the inundation exten-sion was similar to the inundation scenario defined by an event with a representative return period of 100 years (e.g. Cesenatico). In specific locations, however, the inundation exceeded the 100-year scenario limit (e.g. Lido di Savio) or aligned with the 10-year flooding scenario.
Severe damages to several concession properties and urban areas were recorded along the coast (Perini et al., 2015a, b). In the Ferrara province, the impacts were mainly confined to the exposed beach, causing significant damage to the concessions (urbanized beaches), the dune systems (natural areas), and smaller harbours (e.g. flood-ing of the Porto Canale in Porto Garibaldi). In the Ravenna province, several coastal towns experienced extensive flood-ing of residential areas (e.g. Lido di Dante, Classe, and Savio, where a flood water depth of 2 m was recorded; Perini et al., 2015b).
As part of the quick-response effort, the research team carried out post-event assessments at several locations in
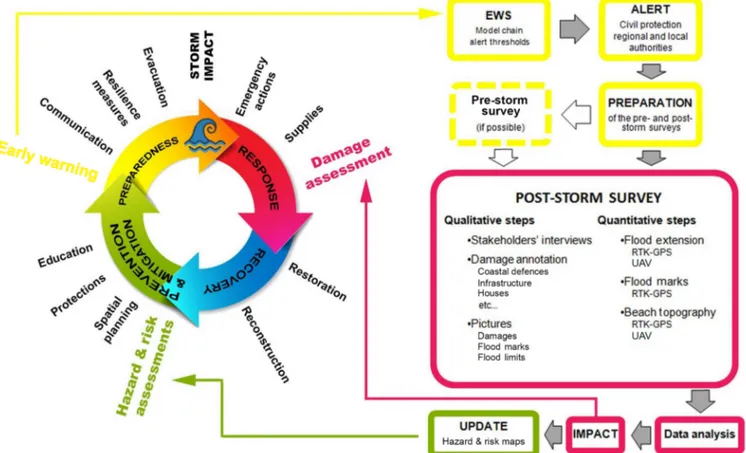
Figure 3. The quick-response protocol in the framework of the disaster management cycle.
the Ferrara and Ravenna provinces within 2 weeks after the event. In this work, the analysis of the survey is presented for Lido degli Estensi (i.e. the target area in Fig. 1e) in the Ferrara province.
3 Methods
3.1 Quick-response protocol
A local approach for coastal post-storm field surveys, here-after called quick-response protocol (QRP), was developed and its application within the study area (Sect. 2) is pre-sented. The approach was implemented by a team of survey-ors, known as the quick-response team (QRT), by integrat-ing E-R EWS input, RTK GPS and UAV survey techniques, interviews with local stakeholders, and damage observation. In the framework of the risk management cycle, the QRP is shown in its general form in Fig. 3.
Ideally, the response phase of data collection must be ac-tivated and completed as soon as possible, prior to initiation of beach recovery processes (natural or human-driven). In this study, the online regional forecasting system and the E-R EWS (see Sect. 2.2) provided guidance to the QE-RT by indicating the specific coastal areas within the regional
do-main that were likely to be impacted by the approaching storm and when conditions allowed for safe survey activities ground-based and airborne. Thus, the QRT knew prior to the storm impacting the coast where the quick response would most likely be needed and prepared in advance for personnel scheduling and survey equipment.
To detect morphological changes, a baseline of the pre-storm conditions needs to be defined. Typically, the pre-storm survey, consisting of a topo-bathymetric survey through both RTK GPS and UAV techniques, should be car-ried out whenever possible, given enough time and resources. However, it is most critically necessary (i) in case stud-ies where important morphological changes take place over short timescales and/or (ii) when other sources of informa-tion are not available on the pre-storm condiinforma-tion in the likely impacted area. In all other cases, it is possible to assume that the baseline is represented by the most recent available topo-bathymetric data set, accounting for the limitations linked to this kind of assumption, as it was done for this study (see Sect. 3.2).
The implementation of the QRP included a number of field activities to acquire both qualitative and quantitative infor-mation on the St Agatha storm in the immediate aftermath
of the event. The critical tasks of the approach included the following activities:
– conducting interviews of citizens, shopkeepers, restau-rant owners, and other local stakeholders;
– annotating the visible damage to coastal defences, buildings, infrastructures;
– taking pictures of the horizontal flood limits and vertical flood marks;
– mapping and measuring the vertical elevation of flood marks on buildings and defence structures;
– mapping the horizontal flood limit;
– surveying the beach by means of RTK GPS (profiles and control points) and UAV flights.
In this application, the survey tasks focused on the emerged portion of the beach since the UAV system was not capable of measuring bathymetric data in the submerged area. Typically, the RTK GPS technique can be used to survey the intertidal area of the cross-shore profiles at most micro-tidal environ-ments such as this pilot site. This information could be used in comparison with the pre-storm data set, when covering the same area. However, these data would not be suitable to perform a reliable 2-D morphological analysis. Possible im-provements of this aspect are given in Sect. 6.
The QRP steps enabled collection of necessary data for an integrated analysis of the storm effects on the coast. The need to conduct rapid field survey activities in this study required the contribution of several people: at least 2 to 3 skilled oper-ators were necessary to accomplish all the tasks in the field, every day. Depending on the alongshore extent and width of the coast that needs to be covered, the implementation of the protocol could last from a few days to a few weeks. In this study, 7 days were sufficient to complete the tasks along a total beach extent of approximately 7 km for the case study site (Fig. 1d), resulting in the integrated assessment rate of 1 km day−1. In total, 10 profiles and more than 40 flood limits and flood marks were surveyed with the RTK GPS technique. Six kilometres of beach were surveyed with the UAV and more than 50 GCPs (ground control points) were surveyed on the ground with the RTK GPS for use in the photogram-metric processing, error analysis, and data comparison.
The data processing and analysis of the acquired informa-tion is further described in the next secinforma-tions, focusing on the target area (Fig. 1e). The integrated information will help to understand the overall effect of the storm in the surveyed area. The scientific aim of the QRP is to provide useful input to coastal managers for hazard and risk assessment purposes (Fig. 3), integrating the post-storm information collected at the regional level.
3.2 Pre-storm conditions
The pre-storm conditions of the subaerial beach and back-shore were assumed to be represented by the available lidar-derived DTM from October 2014, with 1 m × 1 m resolution. The data set was used as a reference for the morphological variations of the emerged beach due to the storm impact, as no major events occurred between October 2014 and the St Agatha event.
3.3 Stakeholder interviews
Local stakeholders were interviewed by the QRT on the morning of 7 February 2015. The interviews were mainly based on informal questions of their recent experiences dur-ing the St Agatha storm. Questions focused on the timdur-ing and evolution of the flood event; what the people were doing be-fore, during, and after the event; whether they were alerted and prepared. They were also requested to give an interpre-tation of the causes of the impacts of the event to gauge their education and experience with storm impacts. Ten stakehold-ers were interviewed in Porto Garibaldi (Fig. 1d), the town in the north of Lido degli Estensi. The group included owners of commercial or touristic services (e.g. concessions, restau-rants, and shops), one resident, one fisherman, and one fire-man. In this work, the interviews were mainly used to derstand which local areas were impacted the most, to un-derstand the temporal evolution of the storm impacts, and to better organize the field activities.
3.4 RTK GPS survey
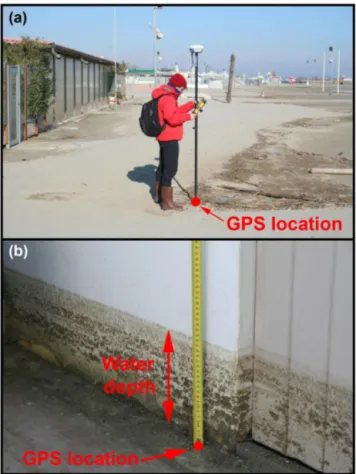
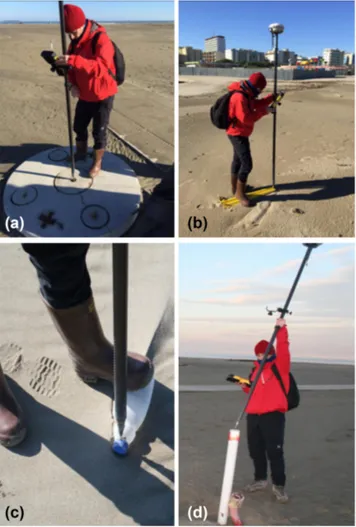
Field measurements relative to flood limits, flood marks, and beach profiles were taken using an RTK GPS (Trimble R6). All measurements were referenced to WGS84 UTM33N co-ordinates and the national geoid Italgeo99 for elevation. The flood limit denotes the maximum water progression on the plan view and it is evidenced by the presence of objects and debris moved inland by the water during the storm (see Fig. 4a). These points are hereafter called GPS floodlines and were mapped with an RTK GPS. A flood mark denotes the maximum water depth at a specific location where the wa-ter level was clearly visible, for example, walls, buildings, trees, or dunes (e.g. Fig. 4b). These points, hereafter called GPS flood marks, were associated with a GPS location and a water depth measured with a simple metre (see Fig. 4b).
Cross-shore beach profiles were also surveyed to have a comparison (i.e. a posteriori) with the post-storm dig-ital surface model (DSM) generated from the UAV pho-togrammetric analysis (see Sect. 3.5). Ten cross-shore pro-files were measured throughout the surveyed area highlighted in Fig. 1d. The measurements were taken on the bare ground and thus excluding variation in the elevation due to debris, wood, or other objects. Two profiles belong to the case study target area (profiles 1 and 2 in Fig. 1e). These profiles were
Figure 4. Examples of GPS floodline (a) and GPS flood mark (b) measurements.
used to provide a quantification of error (i.e. RMSE) of the processed UAV data.
3.5 UAV survey and photogrammetric process
A commercial off-the-shelf UAV, the DJI Phantom Vi-sion 2+, was used to conduct the aerial surveys capturing digital imagery of the pilot case study site. The survey was conducted manually in a lawnmower pattern (e.g. boustro-phedon flight pattern), back and forth across the beach. Man-ual flights were launched because, at the time of the sur-vey, the team did not have automatic flight tools and soft-ware at its disposal. This approach influenced the results (as expected) and this aspect will be emphasized and dis-cussed in the following sections. Photos were automatically collected every 3 s from elevations between 40 and 60 m, at speeds of less than 4 m s−1. The UAV camera utilized a fixed focal length and constant exposure. The resulting ground-sampling distance and image overlap were estimated to be ∼ 2.5 cm pixel−1 and ∼ 70 %, respectively. The UAV approach enabled a survey of the target area (∼ 0.15 km2; Fig. 1e) within a 10 min flight collecting more than 550 im-ages. GCPs were measured using an RTK GPS (Trimble R6) for use within the photogrammetric process. The GCPs were
selected by identifying objects on the beach (e.g. coloured plastic objects, wood, or concrete platforms) that were con-sidered easily detectable from the images. However, the res-olution of the acquired images allowed detection of 14 GCPs for the target area (Fig. 1e) that were used in the photogram-metric process.
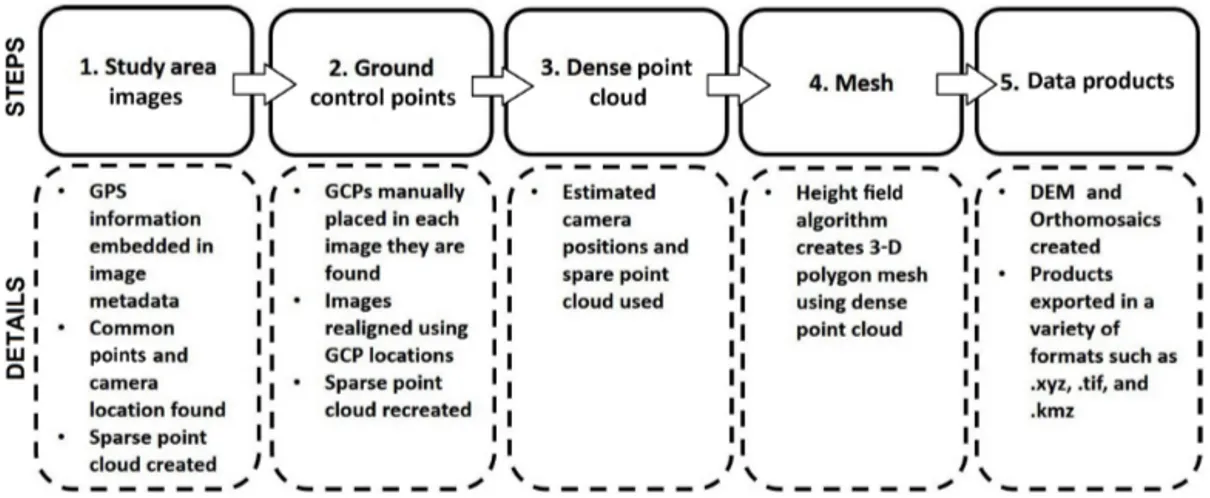
A commercially available photogrammetry software pack-age, specifically Pix4D Pro (Version 3.0.13), was used to stitch the collected UAV photos into one continuous ortho-mosaic by matching points within overlapping images uti-lizing structure-from-motion (SfM) algorithms. The appli-cation of UAV-based SfM photogrammetry for coastal mor-phology assessment has been recently demonstrated by the studies of Casella et al. (2014, 2016), Turner et al. (2016), Dohner et al. (2016), and Scarelli et al. (2017). The process followed the stepwise procedure illustrated in Fig. 5. Images were initially matched using embedded GPS metadata from the UAV, characterized by poor accuracy (a few metres). A sparse point cloud was created based on the identified match-ing points and the calculated initial image camera positions. Then, GCPs were manually identified on the pictures and their GPS information were used to reduce error in georefer-encing, as their position was measured with higher accuracy (a few centimetres) than the images. A dense point cloud was therefore generated by densification of the corrected sparse cloud. The DSM and orthomosaic were then created from the dense point cloud. The dense cloud was not manually cleaned during the process, meaning that points representing debris, wood, or other objects were not removed and there-fore included in the final products. This limitation, presented in other published works such as Casella et al. (2014), will be stressed and discussed in the following sections and specific remedies will be proposed in Sect. 6. The DSM and ortho-mosaic were then exported for the analysis (see Sect. 4). A summary of the information of the Pix4D report is given in Table 1, while the distribution of the GCP vertical errors as-sessed by the photogrammetric software is shown in Fig. 1e.
4 Results
The results of the post-event assessment are presented in the following sections. First, a summary of the interviews is given. Then, the results of the RTK GPS and UAV surveys are presented (and compared) for the target area (Fig. 1e) of the pilot case study (Fig. 1d).
4.1 Summary of the interviews
Many of the stakeholders reported that the water level inside the Porto Canale of Porto Garibaldi (Fig. 1d) was approach-ing the level of the embankments (∼ 1.8 m a.m.s.l.) due to the combined effect of the canal discharge and the sea con-ditions on the evening of 5 February (Thursday). On this same evening, the emerged beaches were impacted by high
Figure 5. Sequence of processing steps used in the photogrammetric workflow of UAV images. Main details of each step are given in the dashed boxes.
Table 1. Pix4D report summary.
Key points Median of 17 344 per image Calibrated images 581 out of 583
Optimization Relative difference initial vs. optimized parameters: 0.08 % Matches Median of 1198.54 per calibrated image
3-D GCPs 14 GCPs; mean rms error = 0.026 m Overlapping images for pixel >5
water levels and waves. The overflow of the canal started between 01:00 and 02:00 GMT and continued until 04:00, mainly because of the oscillations of the water surface fol-lowing wave propagation inside the canal. Early on Friday morning, the situation was still critical but improved in the early afternoon, when the stormy sea conditions began to subside. Some stakeholders stated they did not remember a similar event in the last 30, 50, or even 60 years.
It became evident to the local people in Porto Garibaldi on 5 February 2015 that a strong coastal event was approach-ing. However, several stakeholders claimed that no clear lo-cal alert was issued to the population and none of those inter-viewed knew about the regional E-R EWS. Basically, local know-how and experiences were their only instruments for understanding and preparing for the situation (e.g. deploying sand bags). They also reported that the civil protection ar-rived at the location on 6 February (Friday) at approximately 13:00 GMT, bringing sand bags and assistance.
4.2 Elevation data
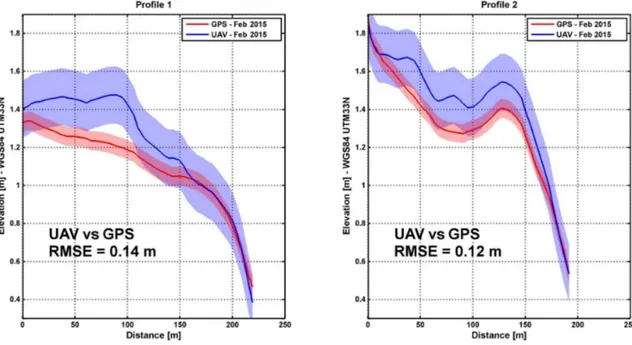
An indication of the quality of the DSM produced from the analysis of the UAV images was derived by comparing it with the RTK GPS cross-section points (see Fig. 1e). The compar-ison is shown in Fig. 6 for both profiles. For both data sets the assumed (i.e. a priori) vertical uncertainty is shown, namely ±15 cm for UAV-derived data and ±5 cm for RTK GPS data
illustrated by the shaded outlines. Outliers were deleted from the DSM data extracted for profiles 1 and 2 when they were visually determined to be clearly not representative of the terrain surface. However, it was not possible to correct the variations induced by debris or other small objects affecting the DSM in a similar manner; therefore they were retained at the surface. Profiles were smoothed using a moving aver-age for the DSM and RTK GPS-derived data to reduce noise. The root mean square errors (RMSEs) of the vertical eleva-tion between the RTK GPS and DSM data were 14 and 12 cm for profiles 1 and 2, respectively. Note that Profile 2 is located in the central portion of the target area, where more precision was expected due to greater image overlap and GCP control targets, while Profile 1 is closer to the edge of the domain where the DSM is expected to be less accurate. Since the DSM data come from a commercial software and thus rely on GCPs for positioning accuracy, the UAV surveys are there-fore not wholly independent of the GPS system. Neverthe-less, the UAV-derived DSM provided a useful and efficient data set alongside the traditional RTK GPS measurements.
This comparison gave an indication of accuracy and reli-ability of the UAV-derived DSM. The DSM, while overesti-mating the elevation in the higher portion of Profile 1, with the strongest difference of the order of 25–30 cm, converged with the RTK GPS profile in the lower portion of Profile 1 near the swash zone. For Profile 2, many of the
morpholog-Figure 6. Comparisons between the February 2015 post-storm observed RTK GPS profile survey and post-storm UAV-derived DSM for profiles 1 and 2. The error bands are shown, defined a priori (±15 cm for UAV and ±5 cm for GPS) for visualization purposes. The RMSEs calculated a posteriori between the RTK GPS and UAV-derived data are reported.
ical features were captured, including the storm berm (with a vertical error on the berm top of ∼ 15 cm). The slopes of the emerged foreshore are comparable for both profiles: for Profile 1 the calculated slope was 0.016 for the UAV-derived profile, while it resulted in 0.014 for the RTK GPS profile. The same slopes calculated for Profile 2 resulted in 0.021 and 0.018. This profile convergence is implemented in fur-ther morphological change analysis as shown in Sect. 4.4.
Thus, the foreshore slope, berm shape, and berm crest lo-cations are well captured by the UAV-derived DSM in Fig. 6. The largest disagreement between the DSM and RTK GPS profiles occurs landward of the berm in the back portion of the beach (around 30 cm for Profile 1 and 20 cm for Pro-file 2). A combination of factors possibly contributed to this difference, including lower sampling resolution of the RTK GPS compared to the UAV, manual flight controls which did not maintain constant flight altitude and image overlap, the inclusion of non-terrain elevations such as wood and debris in the DSM, and other factors such as the texture of the beach surface and the position of the sun (see Sects. 5 and 6 for the discussion of these limitations and proposed remedies). 4.3 Erosion and sedimentation patterns
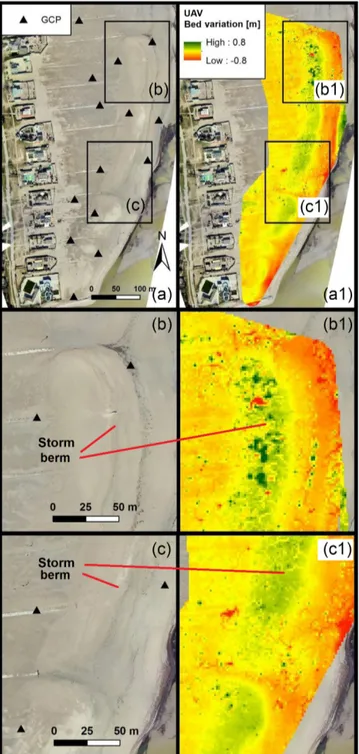
Erosion and sedimentation patterns are shown in Fig. 7. The morphological variations (Fig. 7a1, b1 and c1) were obtained from the comparison between the DTM of October 2014 and the post-event UAV-derived DSM. The DSM included non-terrain objects and buildings; thus the analysis of the mor-phological features only focused on the emerged beach. The
results are only presented for the area limited by the GCPs. The inclusion of non-beach features in the DSM, mainly be-cause of the presence of different-sized debris, affected the non-uniformity of the shown patterns.
Figure 7a1 shows that the formation of a storm berm is clearly visible running alongshore with a varying width of 20 to 50 m. The vertical deposit is interrupted by erosion scour channels due to water return flows (Fig. 7a1). Sea-ward of the depositional area (i.e. the storm berm), a neg-ative variation pattern highlights the erosion of the ordinary berm, which intensifies just in front of the scour channels (Fig. 7a1). Thus, the berm vertically grew and moved land-ward during the storm as a result of sediment transport in the breaker zone (Fig. 7a1). At the same time, a small portion of deposition in the intertidal area potentially corresponded to the development of a low-tide terrace, at the edge of the analysed domain. However, the domain does not include the lower intertidal area. Therefore, it is not possible to evaluate the morphological variation of the lower limit of the fore-shore. A general lowering landward of the storm berm can be noted (Fig. 7a1), which corresponds to the area where the differences between the RTK GPS profiles and the UAV-derived DSM were higher (see Sect. 4.2 and Fig. 6). Thus, this variation can be subjected to error or even represent an artefact. Focusing on the selected frames (Fig. 7b, b1, c, c1), visible scour channels are highlighted, which possibly devel-oped along pre-existing footpaths, essentially providing pref-erential pathways for water retreat seaward following storm conditions. This highlights the UAV’s ability to map finer-resolution features such as scour channels.
Figure 7. Morphological variations: (a) the UAV-derived orthomo-saic of the target area, where morphological features are visible along with the position of the GCPs; (a1) the difference between the post-event UAV-derived DSM and the pre-storm lidar-derived DTM. In (b, b1) and (c, c1) enlargements of the main features are given. The morphological variations are only shown for the area surrounded by the GCPs.
4.4 Coastal flooding
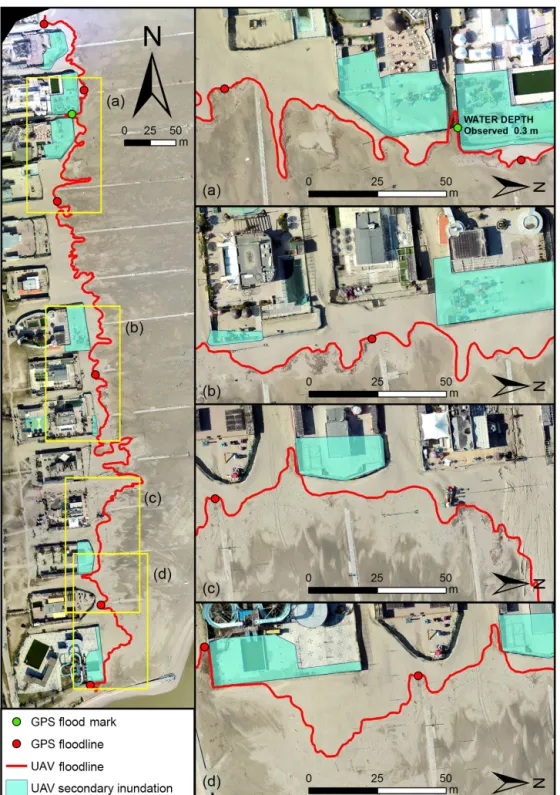
Figure 8 compares the results obtained for the flood exten-sion from the UAV-derived data with the RTK GPS observed
flood limits and marks. Flood lines were extracted from the orthomosaic by observing the debris that deposited on the beach defining the main flooded area (i.e. UAV floodline in Fig. 8). It was observed that several areas that were not in-cluded in the main flooded areas were reached by small paths through the water. Those spots, hereby defined as UAV sec-ondary flood areas, are reported in Fig. 8.
The agreement seen between the UAV floodline and the RTK GPS-derived floodline (GPS floodline) can be con-sidered as validation of the orthomosaic. The flooding was mainly limited to the beach in front of the concessions (Fig. 8). Some of them, however, experienced secondary flooding where the limit of the flood reached the border of the concessions and the water found a path to flow in to the properties (Fig. 8a, b, c, d). These impacts were also observed during the collection of picture and damage observation, but it was not possible to understand the extension of the flood-ing from the ground, as the private concessions were fenced, and admission was not allowed.
The maximum elevation reached by the water was calcu-lated using the RTK GPS measurements (i.e. GPS floodline and GPS flood mark points) and extracting the elevation of the UAV-derived DSM along the UAV floodline. The cal-culated average elevations reached by the water resulted in 1.634 and 1.645 m for RTK GPS and UAV data, respectively. The associated standard deviations were 0.079 and 0.196 m. The same analysis using the UAV floodline was performed on the pre-storm DTM and it resulted in an average elevation of 1.663 m, with standard deviation equal to 0.093 m. A wa-ter depth of 30 cm was measured in the location of the flood mark (Fig. 8a).
5 Discussion
In this section the results are discussed, along with their lim-itations, with focus on the summary of the local interviews and the comparisons between RTK GPS and UAV-derived data. A focus on the integration of the regional assessment with the local information is given.
5.1 Interviews
Interviews with local stakeholders provided details on what happened during the night between 5 and 6 February 2015 (see Sect. 4.1). The evolution of the St Agatha storm de-scribed by people was consistent with the observed hydrody-namic data (see Sect. 2.3 and Fig. 2). The interviews focused on impacts in Porto Garibaldi, which were mainly caused by the overflow of the canal harbour. However, the interviewed could give indications on the surrounding impacted areas (i.e. Lido degli Estensi and Spina) and thereby helping the re-search team to better organize the field activities. An inter-esting aspect highlighted through interviews was a lack of alerts to the population concerning the approaching storm.
Figure 8. Observed GPS floodline and GPS flood mark (green and red circles), UAV (solid red line and light-blue polygons) flood extension comparisons: the box on the left shows an overview of the target area while on the right (a, b, c, d) some spot focuses are given.
However, coastal managers reported that several alerts were issued to municipalities and civil protection agencies before the event (Perini et al., 2015b). The fact that the civil protec-tion reached the locaprotec-tion only on 6 February (Friday), after the peak of the event, supports the hypothesis that, even if the alert was issued from the regional to the municipality level,
there was a communication problem between the regional and local managers, the emergency proactive responders, and the local population. This was also indirectly confirmed by the interviewed fireman, who claimed that they were not even prepared to act on coastal locations. It appeared that the population of the area was not aware of the online
E-R EWS platform, where alerts and warnings could be read-ily found. These aspects support the idea that more effort should be spent improving the preparedness and response of the civil protection and the awareness of the local population, especially through improvement of communication channels and local coastal risk knowledge. These aspects were also reported by Martinez et al. (2018) for the same event and the same locations, in the wider framework of the aims of the EU FP7 RISC-KIT project (GA 603458; www.risckit.eu, last access: 25 October 2018) (Van Dongeren et al., 2018). Pescaroli and Magni (2015) also highlighted the importance of these aspects based on the analysis of local community interviews in Cesenatico (Fig. 1c). The limitations of the in-terviews presented here are mainly related to the lack of a standardized methodology, as the questions were mainly in-formal, and a limited number of people were involved. A standard approach (e.g. using prepared questionnaire) can produce more relevant information that can be statistically analysed when the number of interviewees is large enough. Several examples of methodological approaches for stake-holder interviews and analysis of their outcomes exist in the literature, for diverse purposes, which could be adapted for application during a post-storm assessment (Pescaroli and Magni, 2015; Becu et al., 2017; Gray et al., 2017; Martinez et al., 2018).
5.2 RTK GPS and UAV-derived data
RMSEs of 14 and 12 cm between the DSM and RTK GPS data (see Sect. 4.2 and Fig. 6) are similar for both analysed profiles and comparable with the lidar-derived data uncer-tainty. In comparison with error estimates of UAV products reported by recent studies, the RMSE values calculated in this study are comparable (Casella, 2014, 2016; Dohner et al., 2016) or higher (Turner et al., 2016; James et al., 2017; Scarelli et al., 2017). The low accuracy of the DSM prod-uct is attributed to aspects related to both the field imple-mentation and the photogrammetric process. A recent study by James et al. (2017) provides practical suggestions to im-prove the quality of the field survey (e.g. modifications to UAV flight characteristics, the number and spacing of GCPs). Overall, DSM improvement is achieved through increased image overlap, which can be properly controlled with au-tomated flights, constraining the variability of the flight al-titude as well. GCPs play a major role in the quality of the photogrammetric products, as increased DSM accuracy of 1 order of magnitude occurs when properly used (e.g. Moloney et al., 2018). In addition, the UAV-derived DSM should only be considered valid in the area limited by the GCPs. The number, position, and accuracy of the measured GCPs detectable from the images are thus extremely impor-tant. In this application, the selected GCPs (i.e. 14 GCPs for 0.15 km2) were not uniformly distributed and, because of the ground sampling distance, not always detectable from the images. Following Seymour et al. (2018), it is possible to
assume that the inaccuracy of the final product can also be due to the (combined effect of the) homogeneous texture of the beach surface and the high position of the sun during the flight (that in this study was launched at 12:00 GMT). Over-exposure and smooth (in elevation and colour) surfaces can indeed undermine the SfM processing. Regarding the pho-togrammetric reconstruction, non-terrain objects (i.e. human structures and debris) were not removed or filtered from the point cloud during processing and remained in the data set as was also seen in a similar storm response study by Casella et al. (2014). Thus, objects such as wood, litter, and buildings locally affected the represented surface. This, consequently, influenced the comparison with the post-storm RTK GPS ob-servations, which only represented the terrain surface. The quality of the products can be further improved (see Sect. 6 for proposed improvements); however, the DSM was still able to capture key morphologic features (i.e. storm berm and scour channels).
The morphological patterns (see Sect. 4.3) derived from the UAV data gave an opportunity to assess the morphologi-cal response of the beach at a detailed resolution. The results showed the erosion of the ordinary berm and the formation of a storm berm. The scouring channels highlighted in Fig. 7 were potentially triggered by the presence of concrete path-ways concentrating and accelerating the return water flow during the waning phase of the storm. To reduce the forma-tion of these scouring channels and the consequent worsen-ing of beach erosion, a reasonable option would be to re-move, or at least retreat landward, the pathways during the winter season (Nordstrom et al., 2015). The level of detail of the outcomes suggests that it is possible to use UAV-derived products to calculate volume variations, as already confirmed by the literature on the topic (e.g. Turner et al., 2016).
The UAV-derived orthomosaic offered a rapid, accurate approach to mapping the flood extension (see Sect. 4.4). The general agreement with the RTK GPS ground-based obser-vations confirmed the close geopositioning of the images and provided a validation of the assessed flood extension. The op-portunity to observe the flood extension from the UAV data made it possible to define a detailed and continuous floodline. To obtain the same results with an RTK GPS survey, the op-erator should increase the point sampling (or even use a con-tinuous sampling method). This prolongs the field activities on the beach and increases operational costs. Also, the aerial point of view is essential to having a complete view of the floodline evolution while, from the RTK GPS viewpoint, the random distribution and spreading of the debris can mislead the operator. The maximum elevations reached by the wa-ter, separately assessed considering RTK GPS measurements and the UAV-derived data, were comparable (∼ 1.65 m), al-though the second one was characterized by higher uncer-tainty. As the maximum total water level measured during the storm was 1.20 m (P. Corsini tide gauge, Fig. 1c; see Sect. 2.3), a component of ∼ 0.45 due to wave run-up and set-up must be considered for the water to reach the
esti-mated average elevations on the emerged beach. This value is comparable to the same component calculated using the formula proposed by Suanez et al. (2015) for storm condi-tions (i.e. 0.40 and 0.53 m), considering the average slopes of 0.015 and 0.02 (which are representative of those calculated for the profiles 1 and 2 analysed in this study; see Sect. 4.1) and the hydrodynamics of the storm (see Sect. 2.3). On the other hand, it is lower than the component calculated with the traditional formula by Stockdon et al. (2006), which re-sulted in 1.14 m for both slopes (i.e. dissipative conditions). To improve the number and detail of mapped flood marks it is possible, during the survey, to use the UAV system to col-lect oblique aerial images of specific (urban and non-urban) flooded areas to derive dense 3-D clouds, following the ap-proach proposed by Giordan et al. (2018). Indeed, the dense cloud can be analysed to retrieve, measure, and map mor-phological evidence of the water level on dunes or building facades.
5.3 Local and regional assessments
Compared to the post-storm regional assessment reported in Perini et al. (2015b), based on the analysis of oblique aerial images collected from a helicopter (see Sects. 2.2 and 2.3), the proposed survey approach for local assessments can pro-duce very detailed and accurate data. Indeed, the flood in-gression extracted from the data set of Perini et al. (2015b) is not as accurate and detailed as the information that can be captured with UAVs flying at ∼ 50 m altitude. Moreover, the regional analysis of the flood ingression was not imple-mented in this case study because the civil protection flight was launched too late, when the markers of the limit of the in-undation were no longer identifiable from the helicopter (Ar-maroli Clara, personal communication, 2018). Thus, a direct comparison between the two observed flood extensions was not possible. It was possible, however, to compare the UAV floodline with the regional flood maps (T10 and T100; Perini et al., 2016). This comparison is shown in Fig. 9, for the tar-get area. In this location, the inundation extension was less than the one calculated for the 10-year return period event (T10). This is in contrast with the evidence from Perini et al. (2015b) highlighted at regional level (see Sect. 2.3) and, specifically, for the two reported examples by Cesenatico and Lido di Savio that showed more similarity with the 100-year (T100) and the less frequent (> 100 years) scenarios, respec-tively. This difference can be attributed to the fact that the regional maps are calculated with a static approach, which is not grounded in process-based formulas or models, applies a constant total water level (1.49 and 1.81 m for T10 and T100, respectively) at the shoreline and propagates the inundation with a modified bathtub-based approach (i.e. including cost-distance and damping effects as surrogates of hydrodynam-ics) over a 2 m resolution lidar DTM from 2008 (more de-tails in Perini et al., 2016). Thus, site-specific processes (e.g. wave run-up and set-up) are not properly considered,
poten-Figure 9. Comparisons between the observed UAV floodline and the flood scenarios (T10 and T100) computed by Perini et al. (2016).
tially leading to the differences highlighted above. This hy-pothesis is also supported by the fact that the assessed max-imum elevation reached by the water is close to the average between the levels used to calculate the T10 and T100 sce-narios. Therefore, the observed floodline should have been located between the T10 and T100 flood limits.
Regarding the morphological analysis, the variations cap-tured from the UAV can be used to calculate more accurate volume changes at local level than those calculated on rep-resentative beach profiles along the coast. The regional ap-proach indeed focuses only on a limited number of beach profiles along the coast.
The regional protocol does not include any attempt to in-volve local communities through interviews or other methods because the STBs, activated after the event, mainly collect qualitative information through direct observations and pic-tures (see Sect. 2.2). This represents a serious limitation of
the regional approach that could benefit from involving the local coastal communities in the assessment.
5.4 Towards an integrated multi-scale assessment framework
Nowadays, several techniques are available for coastal sur-veys providing various types of maps and models. In many cases, different sensors can provide similar products. As an example, very high-resolution orthomosaics can be produced with UAVs. Laser scanners can provide 3-D coloured dense point clouds that can be used to derive this kind of product, while with RTK GPS and lidar systems this is not possible. To understand what the best approach is, efficiency in the field must be considered. Indeed, the level of detail of the shown UAV-derived products as well as the efficiency of field surveying make the presented approach highly effective for post-storm assessment when compared with pure RTK GPS or terrestrial laser scanner-based approaches, as confirmed by the literature. For example, Moloney et al. (2018) esti-mated that to complete the survey (including set-up time) of the same area (i.e. a coastal dune test area of 85 m × 65 m) the RTK GPS technique required ∼ 13.45 h, the laser scan-ner ∼ 3.66 h, and the UAV only ∼ 1.15 h. The field efficiency of the UAV was also higher (104and 25 times faster than the RTK GPS and laser scanner ones) in terms of rate of mea-sured points per hour. Even considering that RTK GPS sur-veys can be completed by one skilled person, while the UAV needs 2–3 people as does the laser scanner, the proposed ap-proach results in more efficient and comprehensive data ac-quisition. Focusing on costs, adopting low-cost UAVs such as the one used in this study or in Moloney et al. (2018) and a licensed photogrammetric software, the RTK GPS survey method is less expensive. However, the higher costs of UAV-based surveys are balanced by the efficiency and the speed of the field activities. It must be noted that the UAV platform used for this study needs additional data collected with a GPS RTK system.
Considering (i) the above-mentioned advantages of UAV-based approaches for surveying; (ii) the benefits of a more social-based approach that provides detailed, local informa-tion important for the proper organizainforma-tion of the field tasks and the assessment; and (iii) the limitations of the regional-scale assessments highlighted in Sect. 5.3, it is conceivable that procedures adopted at the regional level can be improved with local actions to provide more reliable and detailed infor-mation. In this sense, the proposed QRP can be very helpful for integrating and completing the regional protocol for post-storm assessment with more local, qualitative, and quantita-tive information. It is advisable to integrate local protocols (such as the QRP) in the regional one through adoption of UAV-based and social-based approaches. As the regional au-thorities do not have sufficient manpower and instruments to make such local detailed assessments along the whole coast, the proposed approach can be realized at the local level by
academic and private survey teams (such as the QRT), which were activated similarly to STBs (see Sect. 2.2), after the coastal event. By properly organizing the efforts at differ-ent locations on the coast (i.e. the most impacted areas), it will be possible to activate a quick, multi-scale, coordinated protocol in the immediate aftermath of an event acting at re-gional and local levels. This will provide more holistic data coverage and increase the details and reliability of the as-sessments, as demonstrated by Giordan et al. (2018), who proposed and tested a multi-scale, multi-sensor approach for riverine flood assessments. That study provided a multi-step framework, successfully combining satellite data collected before, during, and after the event, with post-event aerial, UAV, and RTK GPS surveys for flood and damage mapping on the regional, basin, and local scales. The framework repre-sents a good example, from a methodological point of view, on how to integrate data sets collected on different scales.
6 Suggestions for possible improvements
In order to improve the data quality, the following sugges-tions are presented and should be implemented in the QRP.
The use of automatic flight planning will considerably im-prove the quality of the survey though controlled flight al-titude and image overlap. To make such local-scale assess-ments, ground sampling distances from 2 to 5 cm pixel−1 should be obtained (e.g. Giordan et al., 2018) and im-ages captured with overlap of ∼ 70 %–80 % (e.g. Dohner et al., 2016; Turner et al., 2016). The UAV survey should be planned on a larger domain (∼ 10 % buffer) than needed for data collection as edges have lower image overlap, higher uncertainty, and potential data loss.
The GCPs should be uniformly distributed throughout the survey domain and near boundaries to prevent skewing within the DSM product. The GCPs should be easily de-tectable, considering the ground sampling distance, as play-ing an important role in maximizplay-ing the accuracy of pho-togrammetric products. This depends on both the quality of the images (related to the camera system, the type, flight speed, and altitude of the flight) and of the type of GCPs. An example of GCPs used during the survey can be found in Fig. 10 with images of good- (a, b) and poor- (c, d) qual-ity targets. Proper GCPs can be prepared using flat wood panels painted with two contrasting colours (e.g. red and white, yellow and black). In this case, however, the surveyors must bring them into the field, while in this application the GCPs were selected using objects found on the beach. On the ground, photos of GCP locations should be taken to have an idea of exactly where the RTK GPS points were taken on the target objects and within the context of the survey domain.
As suggested in Sect. 5, environmental conditions (e.g. texture of the beach surface and sun conditions; Seymour et al., 2018) can influence the accuracy of the products, and the
Figure 10. Photos (a) and (b) at the top demonstrate practical GCPs based on unique shapes, colours, and the ability to see from a high altitude. Photos (c) and (d), on the bottom, demonstrate error-inducing GCPs due to their height off the ground and indistinguish-able shape, size, and colour in aerial images.
operators should consider these aspects when planning the field activities.
The photogrammetric process can also be improved, for example, by spending more effort on cleaning and filtering the point cloud, thus minimizing the effect of debris and other objects on the final products.
The post-storm survey did not include the submerged area. To extend the protocol to this part of the beach, other in-novative approaches should be adopted, such as nearshore low-cost autonomous surface systems (e.g. Hampson et al., 2011). However, it is beyond the aim of this work to in-clude these aspects in the protocol.
Qualitative observations and interviews are also significant and should be conducted as soon as possible and in as much detail as possible during the implementation of the QRP. It is important to adopt standard approaches for stakeholder in-volvement and interview a large number of people in order
to allow a statistical analysis of qualitative information and increase representativeness.
The larger the number of surveyors involved in the post-event survey, the faster the data can be collected. In addi-tion, the team can be divided into groups with specific tasks (e.g. interviews, RTK GPS or UAV surveys), speeding up the survey process. Planning the activities is crucial for efficient and high-quality performance of the QRT. This can be sup-ported by activities completed during the non-storm season, such as instrument maintenance and preparation, monitoring the warning system performances, and planning tasks and as-signments.
To provide more accurate qualitative flooding and mor-phologic results (see Sect. 5), further analyses should be per-formed. This paper only presents the analysis of a small por-tion (Fig. 1e) of the whole case study (Fig. 1d) and deeper investigations (e.g. including forcing, sediment, and volume change analysis, possibly supported by numerical models, in-cluding more detailed socio-economic aspects for precise im-pact assessments) are needed to provide more robust hazard and risk assessments. However, the QRP has been demon-strated to properly and quickly assess the storm effects at lo-cal level in the immediate aftermath of an event, through its combination of technologies and planning approaches. Thus, in the framework of coastal management (Fig. 3), a proper application of the QRP can produce useful information that can be used at local, regional, and national levels in order to (i) update hazard and risk maps, (ii) provide detailed infor-mation for calibration of flood-damage curves (see, as an ex-ample, the study of Scorzini and Frank, 2017), and (iii) pro-vide insights into risk mitigation and management plans. Fi-nally, as suggested in Sect. 5, the QRP can be integrated into regional protocols to improve the reliability of the regional hazard and risk assessments.
7 Conclusions
This case study illustrates the potential and benefits of an in-tegrated approach combining UAVs with on the ground RTK GPS surveys and qualitative data collection through stake-holders’ interviews for coastal storm impact assessments at local level. The presented protocol was applied to a pilot case study in the Emilia–Romagna coast after the impact of an ex-treme coastal storm. Results were presented and discussed, for demonstration purposes, on a small portion of the pilot case study site.
As a general remark, (i) interviewing local stakeholders and people in charge of emergency response tasks is ex-tremely useful for supporting the field activity organization, as well as at detecting flaws in the alert chain, preparedness, and response emergency phases; (ii) the UAV approach was found to be effective for erosion and flooding assessments by providing detailed, continuous 2-D (and 3-D) information,
with less time spent in the field in comparison with tradi-tional RTK GPS surveys and other approaches.
The main limitation of the analysis of the interviews was due to the lack of a standardized approach that could be adopted and adapted from the literature. The main limitation of the UAV products was linked to field implementation and flaws in the photogrammetric process. Specific suggestions for improvements were given, such as the use of automated flights, proper GCPs, and the cleaning of the point cloud dur-ing the photogrammetric process.
Regarding the proposed QRP, further applications can di-rectly support hazard and impact assessment at local and re-gional levels, and thus address coastal management needs. Indeed, the outcomes of the analysis were compared with the post-event assessment by the regional authorities, highlight-ing that the proposed protocol for local assessment can be readily integrated into the regional ones, improving the accu-racy and reliability of the regional assessments.
Data availability. Wave data are freely available and can be down-loaded from the ARPAE-SIMC online database (http://www.smr. arpa.emr.it/dext3r/; last access: 25 October 2018). Water level data are freely available and can be downloaded from the archives of the national tide-gauge network (Rete Mareografica Nazionale; www.mareografico.it; last access: 25 October 2018). Details of data analyses can be provided after request to the main author.
Author contributions. ED, EG, ACT and PC were part of the quick-response team performing the post-storm surveys. ED, SD and EG performed the data processing, analysis and interpretation. ED and ACT led the preparation of the article. EG and SD contributed to the preparation and review of the manuscript. PC and ACT supervised the work and critically revised the manuscript.
Competing interests. The authors declare that they have no conflict of interest.
Special issue statement. This article is part of the special issue “The use of remotely piloted aircraft systems (RPAS) in monitor-ing applications and management of natural hazards”.
Acknowledgements. Enrico Duo and Paolo Ciavola were supported by the EU FP7 RISC-KIT (“Resilience-increasing Strategies for Coasts – Toolkit”; GA 603458; www.risckit.eu, last access: 25 Oc-tober 2018) project during field activities and data analysis, and the EU H2020 ANYWHERE (EnhANcing emergencY management and response to extreme WeatHER and climate Events; GA 700099; www.anywhere-h2020.eu, last access: 25 October 2018) project during the manuscript preparation and review process. The work was facilitated by a sabbatical grant to Arthur C. Trembanis. Acquisition and utilization of the UAV system was made possible through funding from the UNIDEL foundation and from NOAA
Sea Grant project NOAA SG-2016-18 RRCE-8 TREMBANIS. The authors are also thankful to Clara Armaroli, Duccio Bertoni, Mohammad Muslim Uddin, and Sarah Trembanis for their help in gathering data in the field and to Marc Sanuy, Ap Van Dongeren, and Tom Spencer for their valuable comments and suggestions during the preparation of the manuscript.
Edited by: Paolo Tarolli
Reviewed by: three anonymous referees
References
Anderson, K. and Gaston, K. J.: Lightweight unmanned aerial vehi-cles will revolutionize spatial ecology, Front. Ecol. Environ., 11, 138–146, https://doi.org/10.1890/120150, 2013.
Armaroli, C. and Duo, E.: Validation of the coastal storm risk assessment framework along the Emilia-Romagna coast, Coast. Eng., 134, 159–167, https://doi.org/10.1016/j.coastaleng.2017.08.014, 2018. Armaroli, C., Ciavola, P., Masina, M., and Perini, L.: Run-up
com-putation behind emerged breakwaters for marine storm risk as-sessment, J. Coastal Res., Special Issue No. 56, 1612–1616, available at: http://www.jstor.org/stable/25738062 (last access: 25 October 2018), 2009.
Armaroli, C., Ciavola, P., Perini, L., Calabrese, L., Lorito, S., Valentini, A., and Masina, M.: Critical storm thresholds for sig-nificant morphological changes and damage along the Emilia-Romagna coastline, Italy, Geomorphology, 143–144, 34–51, https://doi.org/10.1016/j.geomorph.2011.09.006, 2012. ARPA E-R SIMC: Rapporto dell’evento meteorologico
del 5 e 6 febbraio 2015, Bologna, available at: http://www.arpa.emr.it/cms3/documenti/_cerca_doc/meteo/ radar/rapporti/Rapporto_meteo_20150205-06.pdf (last access: 25 October 2018), 2015.
Bason, C., Jacobs, A., Howard, A., and Tymes, M.: White Paper on the Status of Sudden Wetland Dieback in Salt-marshes of the Delaware Inland Bays, Delaware Department of Natural Resources and Environmental Control, available at: http://www.dnrec.delaware.gov/Admin/DelawareWetlands/ Documents/swdwhitepaper07final.pdf (last access: 25 October 2018), 2007.
Becu, N., Amalric, M., Anselme, B., Beck, E., Bertin, X., De-lay, E., Long, N., Marilleau, N., Pignon-Mussaud, C., and Rousseaux, F.: Participatory simulation to foster social learning on coastal flooding prevention, Environ. Model. Softw., 98, 1–11, https://doi.org/10.1016/j.envsoft.2017.09.003, 2017.
Benedet, L., Finkl, C. W., and Hartog, W. M.: Processes Controlling Development of Erosional Hot Spots on a Beach Nourishment Project, J. Coastal Res., 23, 33–48, https://doi.org/10.2112/06-0706.1, 2007.
Berni, J. A. J., Zarco-Tejada, P. J., Suárez, L., and Fer-eres, E.: Thermal and Narrowband Multispectral Remote Sensing for Vegetation Monitoring From an Unmanned Aerial Vehicle, IEEE T. Geosci. Remote, 47, 722–738, https://doi.org/10.1109/TGRS.2008.2010457, 2009.
Billi, P. and Rinaldi, M.: Human impact on sediment yield and chan-nel dynamics in the Arno River basin (central Italy), in: Human Impacts on Erosion and Sedimentation: Proceedings of Rabat