EDITED BY : Filippo Geraci, Indrajit Saha and Monica Bianchini
PUBLISHED IN : Frontiers in Genetics and Frontiers in Plant Science
immediate and permanent online open access to all its publications, but this alone is not enough to realize our grand goals.
Frontiers Journal Series
The Frontiers Journal Series is a multi-tier and interdisciplinary set of open-access, online journals, promising a paradigm shift from the current review, selection and dissemination processes in academic publishing. All Frontiers journals are driven by researchers for researchers; therefore, they constitute a service to the scholarly community. At the same time, the Frontiers Journal Series operates on a revolutionary invention, the tiered publishing system, initially addressing specific communities of scholars, and gradually climbing up to broader public understanding, thus serving the interests of the lay society, too.
Dedication to Quality
Each Frontiers article is a landmark of the highest quality, thanks to genuinely collaborative interactions between authors and review editors, who include some of the world’s best academicians. Research must be certified by peers before entering a stream of knowledge that may eventually reach the public - and shape society; therefore, Frontiers only applies the most rigorous and unbiased reviews.
Frontiers revolutionizes research publishing by freely delivering the most outstanding research, evaluated with no bias from both the academic and social point of view. By applying the most advanced information technologies, Frontiers is catapulting scholarly publishing into a new generation.
What are Frontiers Research Topics?
Frontiers Research Topics are very popular trademarks of the Frontiers Journals Series: they are collections of at least ten articles, all centered on a particular subject. With their unique mix of varied contributions from Original Research to Review Articles, Frontiers Research Topics unify the most influential researchers, the latest key findings and historical advances in a hot research area! Find out more on how to host your own Frontiers Research Topic or contribute to one as an author by contacting the Frontiers Editorial Office: [email protected]
parties. In both cases this is subject to a license granted to Frontiers.
The compilation of articles constituting this eBook is the property of Frontiers. Each article within this eBook, and the eBook itself, are published under the most recent version of the Creative Commons CC-BY licence. The version current at the date of publication of this eBook is CC-BY 4.0. If the CC-BY licence is updated, the licence granted by Frontiers is automatically updated to the new version. When exercising any right under the
CC-BY licence, Frontiers must be attributed as the original publisher of the article or eBook, as applicable. Authors have the responsibility of ensuring that any graphics or other materials which are the property of others may be included in the CC-BY licence, but this should be checked before relying on the CC-BY licence to reproduce those materials. Any copyright notices relating to those materials must be complied with. Copyright and source acknowledgement notices may not be removed and must be displayed in any copy, derivative work or partial copy which includes the elements in question. All copyright, and all rights therein, are protected by national and international copyright laws. The above represents a summary only. For further information please read Frontiers’ Conditions for Website Use and Copyright Statement, and the applicable CC-BY licence. ISSN 1664-8714 ISBN 978-2-88963-705-8 DOI 10.3389/978-2-88963-705-8
Topic Editors:
Filippo Geraci, Institute for Informatics and Telematics, CNR, Pisa, Italy Indrajit Saha, Department of Computer Science and Engineering,
National Institute of Technical Teachers Training and Research, Kolkata, India Monica Bianchini, DIISM, University of Siena, Siena, Italy
Citation: Geraci, F., Saha, I., Bianchini, M., eds. (2020). RNA-Seq Analysis: Methods, Applications and Challenges. Lausanne: Frontiers Media SA.
Filippo Geraci, Indrajit Saha and Monica Bianchini
SECTION 1
RNA-SEQ ANALYSIS
08 Assessment of a Highly Multiplexed RNA Sequencing Platform and Comparison to Existing High-Throughput Gene Expression Profiling Techniques
Eric Reed, Elizabeth Moses, Xiaohui Xiao, Gang Liu, Joshua Campbell, Catalina Perdomo and Stefano Monti
22 Read Mapping and Transcript Assembly: A Scalable and High-Throughput Workflow for the Processing and Analysis of Ribonucleic Acid Sequencing Data
Sateesh Peri, Sarah Roberts, Isabella R. Kreko, Lauren B. McHan, Alexandra Naron, Archana Ram, Rebecca L. Murphy, Eric Lyons, Brian D. Gregory, Upendra K. Devisetty and Andrew D. L. Nelson
31 Integrative Differential Expression Analysis for Multiple EXperiments (IDEAMEX): A Web Server Tool for Integrated RNA-Seq Data Analysis
Verónica Jiménez-Jacinto, Alejandro Sanchez-Flores and Leticia Vega-Alvarado
47 DREAMSeq: An Improved Method for Analyzing Differentially Expressed Genes in RNA-seq Data
Zhihua Gao, Zhiying Zhao and Wenqiang Tang
61 CircCode: A Powerful Tool for Identifying circRNA Coding Ability
Peisen Sun and Guanglin Li
SECTION 2
SINGLE CELL RNA SEQUENCING
67 Single-Cell RNA-Seq Technologies and Related Computational Data Analysis
Geng Chen, Baitang Ning and Tieliu Shi
80 Benchmark and Parameter Sensitivity Analysis of Single-Cell RNA Sequencing Clustering Methods
Monika Krzak, Yordan Raykov, Alexis Boukouvalas, Luisa Cutillo and Claudia Angelini
99 Reproducibility of Methods to Detect Differentially Expressed Genes From Single-Cell RNA Sequencing
Tian Mou, Wenjiang Deng, Fengyun Gu, Yudi Pawitan and Trung Nghia Vu
111 McImpute: Matrix Completion Based Imputation for Single Cell RNA-seq Data
Zhaoping Wu and Xingjun Jiang
135 Co-expression Network Analysis Identifies Four Hub Genes Associated With Prognosis in Soft Tissue Sarcoma
Zhenhua Zhu, Zheng Jin, Yuyou Deng, Lai Wei, Xiaowei Yuan, Mei Zhang and Dahui Sun
145 Long Noncoding RNA RAET1K Enhances CCNE1 Expression and Cell Cycle Arrest of Lung Adenocarcinoma Cell by Sponging miRNA-135a-5p
Chang Zheng, Xuelian Li, Yangwu Ren, Zhihua Yin and Baosen Zhou
156 Analysis of Key Genes Involved in Potato Anthocyanin Biosynthesis Based on Genomics and Transcriptomics Data
Edited and reviewed by: Richard D. Emes, University of Nottingham, United Kingdom *Correspondence: Filippo Geraci [email protected] Monica Bianchini [email protected] Specialty section:
This article was submitted to Bioinformatics and Computational Biology, a section of the journal Frontiers in Genetics
Received: 03 February 2020 Accepted: 24 February 2020 Published: 17 March 2020 Citation:
Geraci F, Saha I and Bianchini M (2020) Editorial: RNA-Seq Analysis: Methods, Applications and Challenges. Front. Genet. 11:220. doi: 10.3389/fgene.2020.00220
Editorial: RNA-Seq Analysis:
Methods, Applications and
Challenges
Filippo Geraci1*, Indrajit Saha2and Monica Bianchini3*
1Institute for Informatics and Telematics, CNR, Pisa, Italy,2Department of Computer Science and Engineering, National Institute of Technical Teachers Training and Research, Kolkata, India,3DIISM, University of Siena, Siena, Italy Keywords: RNA-seq, algorithm, software pipeline, method assessment, differenial analysis
Editorial on the Research Topic
RNA-Seq Analysis: Methods, Applications and Challenges
1. INTRODUCTION
RNA-seq has revolutionized the research community approach to studying gene expression. In fact, this technology has opened up the possibility of quantifying the expression level of all genes at once, allowing an ex post (rather than ex ante) selection of candidates that could be interesting for a certain study. The continuous drop in costs and the independence of library preparation protocols from the model species, have convinced the stakeholders to invest in this technology, by creating consortia able to produce large disease-specific datasets that, in turn, fostered transcriptomic research at a population level. Among many others, a virtuous example in this sense is The Cancer Genome Atlas. In a short time RNA-seq has moved from a technology to merely quantify the expression of genes to a powerful tool to: discover new transcripts (via de novo transcriptome assembly), characterize alternative splicing variants or new cell types (through single cell RNA sequencing). Leveraging on RNA-seq for daily diagnostic activities is no longer a dream but a consolidated reality.
Although established best practices exist, managing RNA-seq data is not easy. Before sequencing, it is essential to carefully plan library preparation in order to minimize downstream analysis biases. Budget optimization is another important factor. Sequencing multiple samples increases statistical power and reduces undesired side effects due to noise and variability. However, more samples imply higher costs. Multiplexing has proved to be an effective tool to limit the budget without sacrificing the number of samples. DNA barcoding enables combining up to 96 samples into a single line, trading a lower sequencing depth for a higher number of sequenced samples. The downside of this technique is the increased burden of data analysis to achieve the same accuracy that would be achieved with a richer input.
Downstream sequencing, fastq data must be validated and processed to distill raw reads into a quantitative measure of gene expression. While validation is somehow a standard procedure, read count depends on the type of RNA (microRNA, etc.) and on the target application. Usually reads are: subjected to adapter removal, aligned against a reference genome, grouped by functional unit (e.g., transcripts, genes, microRNA, etc.), normalized and counted. Subsequent analyses can vary dramatically according to the application. In the simplest setting, the subset of genes responsible for the differences on the phenotype between two populations should be discovered. In other cases, one may want to build the co-expression (or reverse expression) network in order to find interacting genes or a pathway related to a certain phenotype. Other applications involve the discovery of unknown cell types, the organization of cell types in homogeneous families, the identification of
2. RESEARCH TOPIC ORGANIZATION
This Research Topic is divided into three main sections: five articles cover the RNA-seq workflow, four papers discuss the most recent frontier of single cell RNA sequencing, while the last four contributions report on case studies, related to tumor profiling and plant science.
In the first part, we attempted to analyze the RNA-seq process (from experimental design to analysis and extraction of new knowledge) by highlighting the key choices of the state-of-the-art workflows. Although we have mainly focused on computational aspects, we believe that this Research Topic can catch the interest of those readers, specialized in the field of life science, who intend to become independent and autonomous in the analysis of their own data. Two papers of this section describe new methods: for the identification of differentially expressed genes and for the prediction of the circRNA coding ability.
The second section introduces a recent branch of RNA-seq data analysis: single cell sequencing (scRNA-seq). Although conceptually similar to sequencing cells in bulk, the single cell resolution of this technique introduces a lot of noise, that requires ad hoc analysis methods. Much of this section is dedicated to the introduction of basic single cell RNA sequencing concepts, from laboratory protocols to the most common analyses. In particular, the problems of assessing the results of clustering cell types and the reproducibility of differential expression experiments are discussed. Finally, this section concludes with the description of a new method to infer missing counts due to poor coverage of sequencing.
The last part of the Research Topic was dedicated to four case studies: three concerning tumors and one application in plant science. The rationale behind this choice was that of showing different types of analysis. In the conceptually simpler case, the goal of the analysis was to create a panel of genes prognostic of the onset of cancer. Next, an example of a co-expression network is shown. Finally, an example of interaction among different types of RNA (long non-coding, genes, microRNAs) has been reported, showing the complexity of the pathways that regulate the life of cells.
2.1. RNA-Seq Analysis
In Reed et al., the opportunity offered by Multiplexed RNA Sequencing is discussed. The study provides a comparison of several methods using real data from immortalized human lung epithelial cells.
In Peri et al., RMTA, an user-friendly analysis workflow, is proposed. RMTA was designed to provide standard pre-processing tools (i.e., read quality analysis, filters for lowly expressed transcripts, and read counting for differential expression analysis) in a scalable and easy to deploy environment. InJimenez-Jacinto et al., an integrative differential expression analysis web server (IDEAMEX) is described. The rationale
differentially expressed genes is reported. The key observation of this work is that the binomial distribution at the basis of the majority of the algorithms for differential expression analysis is unable to capture underdispersion characteristics of RNA-seq data.
InSun and Li, the problem of predicting whether a given circular RNA can be translated or not is investigated. Circular RNAs differ from other types of RNA in that they are arranged as rings joining 3′ and 5′ endpoints. This characteristic makes hard to decide about their translation potential. The manuscript provides an algorithm to identify the coding ability of circRNAs with high sensitivity.
2.2. Single Cell RNA Sequencing
In Chen et al., an overview of currently available single-cell isolation protocols and scRNA-seq technologies is provided. In addition, several methods for scRNA-seq data analysis, from quality control to network reconstruction, are discussed.
InKrzak et al., the use of clustering to study heterogeneity of cells is dissected. In particular, this work aims at providing new insights into the advantages and drawbacks of scRNAseq clustering, highlighting open challenges.
InMou et al., some issues connected to the reproducibility of differential expression studies is debated. The complexity of this type of analyses stands in the paucity of RNAs and in the consequent lower signal to noise ratio. The article shows pros and cons of standard and ad-hoc software for differential expression.
InMongia et al., a method to impute dropouts in single cell expression data is detailed. Experiments on real data show that the proposed software is able to discriminate the real absence of reads from dropout events.
2.3. Case Studies
InYin et al., differential expression analysis is used to pinpoint a small panel of genes potentially prognostic for the onset of Glioblastoma. The focus of the article is that of improving healthy/diseased classification regardless of the interaction among genes.
InZhu et al., co-expressed genes are identified in order to build a network of interactions. Subsequently, the network is analyzed to select hub genes associated with soft tissue sarcomas. In Zheng et al., the dynamics of the interaction among different molecules in lung adenocarcinoma is studied. The article reports on how the dysregulation of a long non-coding RNA triggers a sequence of dysregulations, causing the cell cycle arrest.
In Tengkun et al., genomics and trascriptomics data are integrated in order to identify the crucial genes that affect anthocyanin biosynthesis transforming quantitative traits into quality traits.
FUNDING
IS was supported by a grant (DST/INT/POL/P-36/2016) from the Department of Science and Technology, India.
Copyright © 2020 Geraci, Saha and Bianchini. This is an open-access article distributed under the terms of the Creative Commons Attribution License (CC BY). The use, distribution or reproduction in other forums is permitted, provided the original author(s) and the copyright owner(s) are credited and that the original publication in this journal is cited, in accordance with accepted academic practice. No use, distribution or reproduction is permitted which does not comply with these terms.
doi: 10.3389/fgene.2019.00150
Edited by: Filippo Geraci, National Research Council (CNR), Italy Reviewed by: Kashmir Singh, Panjab University, India Matteo Benelli, University of Trento, Italy Haibo Liu, Iowa State University, United States *Correspondence: Stefano Monti [email protected]
Specialty section: This article was submitted to Bioinformatics and Computational Biology, a section of the journal Frontiers in Genetics Received: 06 September 2018 Accepted: 12 February 2019 Published: 05 March 2019 Citation: Reed E, Moses E, Xiao X, Liu G, Campbell J, Perdomo C and Monti S (2019) Assessment of a Highly Multiplexed RNA Sequencing Platform and Comparison to Existing High-Throughput Gene Expression Profiling Techniques. Front. Genet. 10:150. doi: 10.3389/fgene.2019.00150
Assessment of a Highly Multiplexed
RNA Sequencing Platform and
Comparison to Existing
High-Throughput Gene Expression
Profiling Techniques
Eric Reed1,2, Elizabeth Moses2, Xiaohui Xiao2, Gang Liu2, Joshua Campbell1,2,
Catalina Perdomo2and Stefano Monti1,2*
1Bioinformatics Program, Boston University, Boston, MA, United States,2Section of Computational Biomedicine, School of Medicine, Boston University, Boston, MA, United States
The need to reduce per sample cost of RNA-seq profiling for scalable data generation has led to the emergence of highly multiplexed RNA-seq. These technologies utilize barcoding of cDNA sequences in order to combine multiple samples into a single sequencing lane to be separated during data processing. In this study, we report the performance of one such technique denoted as sparse full length sequencing (SFL), a ribosomal RNA depletion-based RNA sequencing approach that allows for the simultaneous sequencing of 96 samples and higher. We offer comparisons to well established single-sample techniques, including: full coverage Poly-A capture RNA-seq, microarrays, as well as another low-cost highly multiplexed technique known as 30digital
gene expression (30DGE). Data was generated for a set of exposure experiments on
immortalized human lung epithelial (AALE) cells in a two-by-two study design, in which samples received both genetic and chemical perturbations of known oncogenes/tumor suppressors and lung carcinogens. SFL demonstrated improved performance over 30DGE in terms of coverage, power to detect differential gene expression, and biological
recapitulation of patterns of differential gene expression from in vivo lung cancer mutation signatures.
Keywords: RNA sequencing, gene expression, microarray, multiplexing, platform comparison
INTRODUCTION
Since its inception in 2008, RNA sequencing has become the gold-standard for whole-transcriptome high-throughput data generation (Mortazavi et al., 2008). In addition to RNA transcript expression quantification, RNA-seq allows for more advanced analyses including de novo transcriptome assembly (Robertson et al., 2010) and characterization of alternative splicing variants (Bryant et al., 2012). Furthermore, RNA-seq is species agnostic, such that the same library preparation technique may be utilized for humans, mouse, rat, kidney bean, etc. These represent clear advantages over hybridization-based microarray platforms in which individual microarray platforms are designed to quantify specific transcripts for a specific species (Wang et al., 2009). However, one persistent drawback of RNA-seq has been its relatively high cost.
The use of classic RNA-seq techniques for experimental designs that require profiling of many samples – especially when the marginal information value of each sample is relatively low, such as in medium- and high-throughput screening applications – can thus present a disqualifying cost burden.
Large-scale projects based on transcriptional profiling of chemical exposure experiments include the Toxicogenomics Project-Genomics Assisted Toxicity Evaluation System (Open TG-GATEs) (Igarashi et al., 2015), the DrugMatrix database (Ganter et al., 2006), and the Connectivity Map (CMap) (Subramanian et al., 2017), among others. Both the TG-GATEs and the DrugMatrix projects used microarrays for expression profiling, which was at the time significantly less costly than full coverage RNA-sequencing, yet still requiring multi-million budgets. Alternatively, the CMap project utilizes the Luminex-1000 (L1000) profiling platform, a bead-based analog expression assay which quantifies 1,058 human transcripts, which are used to impute the expression of 11,350 additional transcripts (Subramanian et al., 2017). This technique is among the least expensive expression assays available, but it is restricted to human screens and it directly profiles only a limited panel of genes. Given the flexibility of RNA-sequencing platforms, highly multiplexed techniques represent a viable alternative for generating transcriptional data from exposure screens, as well as from other experiments that require a large sample size. Therefore, evaluation of the technical validity of specific techniques serves to inform research strategies for a variety of biological inquiries.
The need to reduce the per sample cost of RNA-seq has led to the adoption of barcoding technologies, where cDNA sequences from individual samples are tagged and their libraries are combined and multiplex sequenced in a single lane (Wang et al., 2011). More recently, these techniques have been optimized to allow multiplex sequencing of 96 samples per lane or higher (Hou et al., 2015;Shishkin et al., 2015). Here, we report the results of our effort at optimizing and evaluating one such technique denoted as sparse full length (SFL) sequencing (Shishkin et al., 2015), a ribosomal RNA depletion-based RNA sequencing approach that allows for the simultaneous sequencing of 96 samples and higher. We offer comparisons to well established single-sample techniques, including: full coverage Poly-A capture RNA-seq and microarray, as well as another low-cost highly multiplexed technique known as 30
digital gene expression (30
DGE) (Asmann et al., 2009). Assessments include comparisons of coverage between the three RNA-sequencing techniques, as well as signal-to-noise and biological recapitulation of gene-level differential signals between treatment groups for the same samples profiled across SFL, microarray, and 30
DGE. For this evaluation study, we generated a set of exposure experiments on immortalized human lung epithelial (AALE) cells (Lundberg et al., 2002) in a two-by-two study design, in which samples received both genetic and chemical perturbations of known oncogenes/tumor suppressors and lung carcinogens (Figure 1). The goal of this report is not only to assess the performance of our optimized highly multiplexed technique, but to inform future research in terms of the strengths and
pitfalls of available cost-effective high throughput transcriptomic profiling techniques.
MATERIALS AND METHODS
Samples
Exposure experiments were performed on immortalized human bronchial epithelial cells (AALE). Cells were exposed to both chemical and genotypic perturbations with three replicates per perturbation combination. Cells were thawed from liquid nitrogen and grown up in SAGM small airway epithelial cell growth media (Lonza, Portsmouth NH). Cells were subcultured using Clonetics ReagentPack subculture reagents (Lonza, Portsmouth NH). In preparation for exposure, cells were plated into 24-well plates and allowed to reach confluency for 24 h. Cell culture media was then replaced, and compounds added at a concentration of 24 µg/ml CSC, 173 µM BaP, 490 µM NNK or DMSO. NNK and BaP compounds were obtained from Sigma-Aldrich (St. Louis, MO, United States) and CSC obtained from Murty Pharmaceuticals (Lexington, KY, United States). Genotypic perturbations included CRISPR knockouts of FAT1, and CDKN2A, as well as overexpression of NRF2 (NFE2L2), FGFR1, NRG1, and PIK3CA. Cells transfected with a pSpCas9-EGFP (GFP) plasmid (PX458) in the absence of sgRNAs were used as controls for the CRISPR perturbations while overexpression of an empty vector containing the reporter HcRed served as control for the overexpression experiments. The same samples were profiled across SFL, microarray, and 30
DGE for a subset of combinations of exposures, though all samples were profiled by SFL. In addition, full coverage poly-A RNA-seq was performed on a separate set of samples for a subset of genotypic exposures, including CRISPR knockouts of FAT1, as well as overexpression ofNRF2, NRG1, and PIK3CA. These samples did not receive any chemical exposures (Figure 1). Note that in a few cases there was not enough material to perform 30
DGE, as indicated by the sample numbers of certain perturbation combinations.
Library Preparation
Library preparation for SFL sequencing was carried out based on the published protocol (Shishkin et al., 2015). An edited version of this protocol is available in the Supplementary
Material. RNA was isolated using a standard Qiazol and Qiacube protocol from Qiagen (Valencia, CA, United States). RNA purity was assessed using a NanoDrop spectrophotometer and no samples were excluded from downstream analysis. The dual-barcoded SFL libraries were pooled from 96 individual samples and then sequenced on the Illumina R
NextSeq 550 to generate more than 400 million single-end 75-bp reads. Poly-A RNA Sequencing libraries were prepared from total RNA samples using Illumina R
TruSeq R
RNA Sample Preparation Kit v2 and then sequenced on the Illumina R
HiSeq 2500 to generate more than 5 million single-end 50-bp reads per sample. Microarray procedures were performed as described in GeneChipTM WT PLUS Reagent Kit manual and GeneChipTM WT Terminal
FIGURE 1 | Design of cross-platform experiments and high-throughput data processing. Schematic of the number of each pair of genotypic and chemical perturbations, as well as a summary of preprocessing methods used to quantify gene-level expression for each platform. Note that “Unt.” is an abbreviation of “untreated,” denoting that the RNA-seq samples used in this experiment did not receive chemical perturbations. Numbers in each box represent biological replicates of each condition. The color scheme for each platform is consistent throughout this report.
Labeling and Controls Kit protocol (Thermo Fisher Scientific). The labeled fragmented DNA was generated from 100 ng of total RNA and was hybridized to the GeneChipTM Human Gene 2.0 ST Array. Microarrays were scanned using Affymetrix GeneArray Scanner 3000 7G Plus. 3’DGE library preparation was performed by Broad Institute, Cambridge, MA, United States, similar to (Soumillon et al., 2014). Final libraries were purified
using AMPure XP beads (Beckman Coulter) according to the manufacturer’s recommended protocol and sequenced on an Illumina NextSeq 500 using paired-end reads of 17 bp (read1) + 46 bp (read2). Read1 contains the 6-base well barcode along with the 10-base UMI. Across all platforms, the number of samples that were successfully profiled per perturbation combination is shown in Figure 1.
Data Pre-processing
Affymetrix GeneChip Human Gene 2.0 ST Microarray CEL files were annotated to unique Entrez gene IDs, using a custom CDF file from BrainArray (hugene20st_Hs_ENTREZG_21.0.0) and RMA-normalized. For SFL, adapter sequences were trimmed from raw sequence files usingCutadapt v1.12. Quality assessment of trimmed SFL sequence files as well as raw full coverage RNA-seq sequencing files was performed with FastQC v0.11.5. Both SFL and RNA-seq reads were aligned to human genome (UCSC RefSeq hg19) with STAR v2.5.2b with the non-defulat parameter, “–outSAMtype BAM SortedByCoordinate” (Dobin et al., 2013). Expression quantification in RefSeq genes was carried out with featureCounts (subread) v1.5.0 (Liao et al., 2014). For 3’DGE, pre-quantified gene expression count matrices were obtained from the Broad Institute, Cambridge, MA, United States. These reads had been aligned to the transcriptome (UCSC RefSeq hg19), using BWA aln v0.7.10 with the non-default parameter, “-l 24” (Li and Durbin, 2009). Considering that there are 410 (∼1.05∗
106) possible UMIs and the 3’DGE library sizes are on the order of 106 reads, it is highly unlikely for the same UMI to be added to multiple cDNA fragments from the same gene. Therefore, using a custom python program (Soumillon et al., 2014), reads with the same UMI and sample barcode were only counted once per gene. All further data processing and analysis were carried out inR.
Coverage Assessment
Read coverage across the 82 samples, shared between SFL and 30
DGE, as well as all 18 full coverage RNA-seq samples was assessed for library size as well as percentage of the library size that was aligned, uniquely aligned (i.e., reads that only align once in the genome), and counted in the 22,233 genes which were annotated across all three platforms, i.e., the intersection of annotated genes. The full set of counted reads is hereafter referred to as the counted library. Unlike SFL and full coverage RNA-seq, 30
DGE reads are aligned directly to mRNA sequences, such that the reported numbers of counted reads and uniquely aligned reads are the same. To assess the relative distribution of reads across the total set of shared genes, we plotted the cumulative proportion of the sum of reads aligning to individual genes per samples ranked by relative expression across all three platforms. Saturation analysis of the estimated minimum percentage of the counted library size to maximize the number of genes quantified by each platform was performed using a loess fit the gene discovery of 20 subsamplings of the per sample counted libraries. All subsampling analysis was performed usingSubseq v1.8.0.
Finally, we assessed the relative induction of noise introduced by subsampling progressively larger proportions of the original counted library sizes in each platform, as measured by the principal component error (Heimberg et al., 2016). In order to compare the three platforms assuming equally sized starting library, we repeated the assessment after first subsampling full coverage RNA-seq libraries and 30
DGE libraries to sizes matching that of SFL, the smallest library of the three platforms. This analysis was performed on the 18 samples of like genotypic
perturbations, with no chemical treatment in the case of full coverage RNA-seq samples and vehicle DMSO treatment in SFL and 30
DGE samples. Reported values reflect means across 20 iterations of the subsampling and principal component error calculation procedure.
Signal-to-Noise Assessment
Signal-to-noise was compared among SFL, 30
DGE and microarrays based on four-group ANOVA analysis and two-group differential analysis. In order to estimate signal-to-noise as a means for assessing expected performance when applying standard statistical methods to the data, rather than differential gene expression analysis packages, classic ANOVA was performed for each gene using normalized data across all three platforms, using the glm function in R. In this analysis, the signal-to-noise was assessed across like samples undergoing exposure to CSC or DMSO vehicle, as well as genotypic perturbations of NRF2 overexpression or HcRed control. Thus, the analysis included four independent groups of samples, receiving each combination of chemical (CSC or DMSO) and genotypic (NRF2 or HcRed) perturbations, with three replicates in each group. Only genes with mean expression ≥ 1 across all 12 samples in both SFL and 30
DGE were included in the analysis (9,813 total genes). Expression levels across SFL and 30
DGE were normalized via trimmed mean of M values (TMM) (Robinson and Oshlack, 2010) scaling and log2 counts-per-million transformation. Additionally, two-group differential gene expression analysis was performed for each stratified chemical and genotypic perturbation, using LIMMA v3.30.7. That is, differential expression of CSC- vs. DMSO-treated samples, within either HcRed orNRF2 treatment, as well as differential expression of NRF2- vs. HcRed-treated samples, within either DMSO or CSC exposure, was performed. The SFL and 30
DGE count data were transformed for linear modeling based on voom (Ritchie et al., 2015). Following modeling, results were restricted to the top 10,000 genes as ranked by median-absolute-deviation (MAD). This heuristic gene filtering procedure was adopted because quantification-based filtering is not applicable to microarray data. This approach follows recommendations detailed in the LIMMA manual (Ritchie et al., 2015). Allp-values reported from two-group differential analysis are two-sided. In both ANOVA and LIMMA analyses, nominalp-values for each gene were corrected for multiple comparisons using the Benjamini–Hochberg procedure (Benjamini and Hochberg, 1995).
Biological Signal Recapitulation
Two-group differential analysis signatures were compared by pre-ranked gene set enrichment analysis (GSEA) to gene sets derived from published signatures of smoking exposure in the airway from healthy volunteers (Spira et al., 2004;Beane et al., 2007), as well as to gene sets analytically derived from The Cancer Genome Atlas (TCGA) for patients with lung squamous cell carcinoma (LUSC) or lung adenocarcinoma (LUAD). The two smoking gene sets consist of genes reported as either up- or down-regulated in response to smoking in at least one of the two publications, while TCGA gene sets were
derived by probing differential expression of individual genes between patients with or without point mutations or copy number alterations (CNA) in genes of interest. These include mutations for the same panel of genes profiled for genotypic perturbations. In addition we include KEAP1 mutations, a repressor of NRF2 (Kansanen et al., 2013, 1). Specifically, point mutation signatures were derived from LUSC and LUAD, independently, by performing differential analysis of subjects with and without point mutations in genes of interest, matched for age, sex, and cancer stage. For NRF2 and PIK3CA point mutations were defined at specific mutation hotspots of along the gene body (Supplementary Figure S2) (Campbell et al., 2016). Likewise, CNA gene signatures were assessed for amplification and deletions of genes of interest by differential analysis, using subjects with zero, one, or two additional copies or deletions of a gene of interest, respectively. All models for mutations and CNA were adjusted for tumor purity, as reported (Campbell et al., 2016). Differential signatures were derived usingLIMMA. Genes associated with specific mutations or CNA were defined as those with significance and magnitude of the linear model’s genetic alteration coefficient at FDR Q-value< 0.05 and | log2 fold-change| > log2(1.5), respectively.
Each of our genotypic perturbation signatures was compared by GSEA to the corresponding TCGA-derived gene sets. For example, the PIK3CA overexpression signatures were compared to the gene sets derived from PIK3CA mutation and CNA in the TCGA data. To assess the effect of read counts on gene discovery and biological recapitulation of each platform, we compared the differential analysis and GSEA results to that derived from subsampled libraries across full coverage RNA-seq, SFL, and 30
DGE. Similar to coverage assessment, this analysis was performed starting with full libraries across all three platforms, as well as initially subsampling the full coverage RNA-seq and 30
DGE libraries to sizes matching that of SFL. Reported values reflect means from 20
iterations of the subsampling followed by differential analysis and GSEA procedures.
RESULTS
Coverage Assessment
Comparison of coverage of the three sequencing platforms, full coverage poly-A RNA-seq, SFL, and 30
DGE, is summarized in
Table 1, Figure 2, and Supplementary Figure S1. Comparison between SFL and 3’DGE included 82 samples each, while full coverage poly-A RNA-seq included all 18 available samples. None of the three platforms demonstrated differences in the library size variability (total number of assigned reads) across samples, although there was a notably high difference between the largest and smallest library size for the SFL samples, with a fold change of 4.3. Fold changes for full coverage RNA-seq and 30
DGE were 1.9 and 2.9, respectively (Table 1 and Figure 2A).
Unsurprisingly, full coverage poly-A RNA-seq generated the largest library size, while the SFL and 30
DGE libraries were of comparable size (Figure 2A). Furthermore, full coverage poly-A RNA-seq yielded the highest percentage of reads aligned to the genome, followed by SFL and 30
DGE (Table 1, Figure 2Ci, and Supplementary Figure S1A). The lower mapping rate of 30
DGE is most likely due to the lower read quality scores of 30
DGE compared to full coverage RNA-seq and SFL (Supplementary Figure S1B). The mean percentage of reads with Phred quality scores greater than 20 (Q20) was only ∼88% for 30
DGE, compared to ∼100% for both full coverage RNA-seq and SFL. The relative 50
–30
transcript coverage for each sample across all three platforms is shown in Supplementary
Figure S1F. As expected, reads alignments were skewed toward the 30
end of transcripts for 30
DGE, while we did observe relatively uniform coverage along the transcript for full coverage RNA-seq and SFL.
TABLE 1 | Comparison of read assignment between full coverage poly-A RNA-seq, SFL, and 30DGE.
Counts (million) Percent (value/library size)
Mean (SD) Median Minimum Maximum Mean (SD) Median Minimum Maximum
Poly-A RNA-seq (RNA-seq) Library size (total reads) 13.0 (2.3) 12.6 9.3 17.6
Aligned reads 12.4 (2.2) 12.0 9.0 16.9 95.9 (1.3) 96.0 92.4 97.9
Uniquely aligned reads 10.8 (1.9) 10.3 7.8 14.8 82.9 (1.5) 83.0 79.5 85.3
Counted reads 8.4 (1.5) 8.1 6.4 10.9 65.2 (2.7) 64.6 60.5 70.3
Sparse full length sequencing (SFL) Library size (total reads) 3.8 (1.1) 3.5 1.6 6.9
Aligned reads 3.3 (1.0) 3.1 1.4 5.9 88.5 (2.9) 88.8 73.0 92.5
Uniquely aligned reads 1.8 (0.6) 1.8 0.7 3.2 48.5 (8.0) 46.8 27.6 64.8
Counted reads 0.9 (0.3) 0.9 0.3 1.6 24.5 (4.0) 23.8 14.3 31.7
30digital gene expression (30DGE) Library size (total reads) 3.7 (0.7) 3.7 1.9 5.6
Aligned reads 3.0 (0.6) 3.0 1.5 4.5 80.6 (1.6) 81.0 73.5 82.2
Uniquely aligned reads
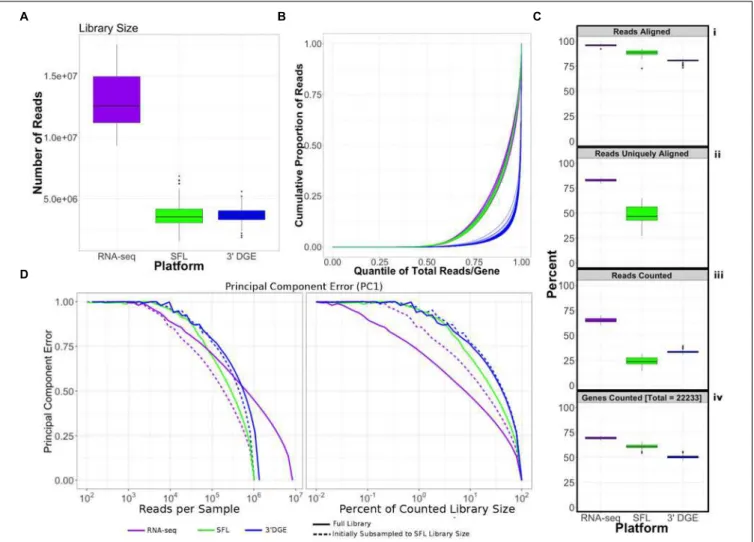
FIGURE 2 | Comparison of coverage between poly-A RNA-seq, SFL, and 30
DGE. (A) Boxplots of distribution of library size for each platform. (B) Cumulative distribution of reads assigned to individual genes per sample. The x-axis indicates the quantile for each gene in terms of ranking by relative expression. The y-axis shows the cumulative proportion of total counted reads assigned to these genes, i.e., the running sum of reads divided by the total number of reads across all genes. (C) The top 3 boxplots show the percentage of reads aligned (i), uniquely aligned (ii), and counted (iii) relative to the total library size for each platform. The bottom boxplot (iv) shows the proportion of genes with counts> 1, for protein-coding genes annotated across all 3 platforms (18,488). For (ii), “Reads Uniquely Aligned” is not shown for 30
DGE because “Reads Uniquely Aligned” and “Reads Counted” are the same values as a result of the data pre-processing protocol, specific to 30
DGE (see section “Materials and Methods”). Counts values for these percentages are given in Supplementary Figure S1A. (D) Analysis of the principal component error of subsampled counted library sizes for full coverage poly-A RNA-seq, SFL, and 30DGE for principal component 1. Results for principal component 2–5 is shown in Supplementary Figure S1D. Initial subsamples of Poly-A RNA-seq and 30DGE to the SFL library size are also given as dotted lines.
For SFL there was a clear drop-off when going from percentage of aligned reads to percentage of uniquely aligned reads due to ribosomal RNA (rRNA) contamination of the SFL samples (Figure 2Cii). The majority of reads aligning to ribosomal regions specifically align to RNA28S (Supplementary Figure S3). For 30
DGE, unique UMIs are aligned directly to transcript sequences and not to the whole genome, such that the number of uniquely aligned reads and reads counted in transcripts are the same (Figures 2Cii,iii) (Morrissy et al., 2009). The percentage of reads that are counted in transcripts is greatest for full coverage poly-A RNA-seq (mean percentage of total library size: 65.2%), followed by 30
DGE (33.3%), and SFL (24.5%). However, while the counted read library size is greater for 3’DGE than for SFL, more genes were quantified by SFL than by 30
DGE (Figure 2Civ) (counts > 0 across all samples for 22,233 genes shared across
all three platforms,). A median of 60.9 and 50.5% genes were quantified by SFL and 30
DGE, respectively. The number of genes quantified was near the saturation point for each platform, such that this discrepancy is not due to read depth of each platform (Supplementary Figure S1C). The reason for the low gene discovery of 30
DGE is further illustrated in Figure 2B, where it is shown that the reads are more evenly distributed across the 22,233 genes by SFL than by 30
DGE, with the cumulative distribution of reads counted in individual genes nearly identical in SFL and full coverage poly-A RNA-seq.
The principal component (PC) error was estimated for each platform for different subsamples of the full counted library size. The first PC is shown in Figure 2D, while the second through the fifth PCs are shown in Supplementary Figure S1D. We observe that as the counted library size increases, the PC error decreases
at the fastest rate for full coverage RNA-seq, followed by SFL, then 30
DGE. Although these differences are considerably more prominent when comparing full coverage RNA-seq to either SFL or 30
DGE, we do observe that when down-sampling from 10 to 100% of the counted library size, the PC error decreases at a consistently faster rate for SFL than for 30
DGE. Initially subsampling full coverage RNA-seq and 30
DGE to match the full SFL counted library size does not change the results. The same trend is also observed in the cumulative variance explained by each successive PC across full coverage RNA-seq, SFL, and 30
DGE (Supplementary Figure S1E).
In summary, despite lower overall counted library size due to ribosomal RNA contamination, SFL demonstrates greater coverage in low-to-medium expressed genes than 30
DGE, comparable to full coverage poly-A RNA-seq. Consequently, the transcriptional signal captured by the SFL libraries are more robust to subsampling of the data compared to 30
DGE as measured by the principal component error.
Signal-to-Noise Evaluation
Differential expression models comparing experimental groups of matched samples was performed in SFL, microarray, and 30
DGE and the corresponding signal-to-noise scores were compared pairwise between platforms (Figure 3). Samples shared across the three platforms include three replicates for each of four experimental groups, corresponding to NRF2 overexpression or HcRed vehicle, as well as CSC chemical exposure or DMSO vehicle (Figure 1). Signal-to-noise was assessed by a four-group comparison with classic ANOVA (Figures 3A–D), as well as by stratified two-group differential analyses using LIMMA (Figures 3E,F).
We compared the log10F-statistics between ANOVA models across all three platforms (Figure 3A). Overall, the distribution of F-statistics is most similar between SFL and microarrays, with a Pearson correlation of 0.291. Though statistically significant (p < 0.01), the corresponding mean difference between log10 F-statistics is only 0.026. The mean differences of the log10 F-statistics between SFL and 30DGE, and between 30
DGE and microarray are 0.328 and 0.302, respectively, and the corresponding Pearson correlations are 0.160 and 0.216, respectively. These results are consistent with the discovery rates estimated for different FDRQ-value thresholds (Figure 3B). For example, at the FDR Q-value threshold of 0.05, the discovery rates of SFL and microarray are almost identical, 0.214 (2083 genes), 0.209 (2038 genes), respectively, while the discovery rate of 30
DGE is much smaller 0.032 (310 genes).
Loess regression of the log10 F-statistics as a function of mean gene expression shows that the statistical signal increases with mean normalized expression. This trend is consistently positive for both SFL and 30
DGE, while leveling off at the most highly expressed genes in microarrays (Figure 3C). Furthermore, SFL signal is greater than 30
DGE signal at all levels of mean expression (Figure 3C). In agreement with the results from coverage comparison, the distribution of mean normalized expressions in 30
DGE is smaller than that of SFL, while SFL is comparable to that of microarray (Figure 3D). Adherence to assumption of normality, assessed through a Shapiro–Wilk
test, is also associated with higher mean normalized expression (Supplementary Figure S4).
The results of the comparisons of the two-group differential analyses across all three platforms were generally congruous with those of the four-group ANOVA analyses (Figures 3E,F and Supplementary Figures S5, S6). In all four two-group comparisons, the correlation of test statistics is closest between microarray and SFL results, followed by 30
DGE versus microarray results, and 30
DGE versus SFL. For example, in the DMSO-stratified,NRF2 versus HcRed analysis, estimates of the Pearson correlations of test statistics are 0.66, 0.45, and 0.43, respectively (Figure 3E). The discovery rate of 30
DGE is the lowest across all four differential analyses, while the discovery rate of SFL is higher in three out of four of these analyses (Figure 3F and
Supplementary Figures S5, S6).
In summary SFL demonstrated greater statistical power than 30
DGE to detect differentially expressed genes, and its results more closely matched those in microarrays.
Biological Signal Recapitulation
Evaluation
To evaluate the ability of each platform to recapitulate biologically relevant results, we utilized previously published signatures of smoking exposure in lung (Spira et al., 2004;
Beane et al., 2007), as well as differential signatures derived from the TCGA LUSC and LUAD datasets associated with mutations of the genes over-expressed in our experiments. From each of these signatures two gene sets were extracted, one of genes positively associated and one of genes negatively associated to the variable of interest. These gene sets were then tested via pre-ranked gene set enrichment analysis against each of our differential analysis results (CSC vs. DMSO, stratified by NRF2 or HcRed perturbation; NRF2 vs. HcRed, stratified by CSC or DMSO perturbation). The enrichment results with respect to both the smoking exposure signatures and the TCGA mutations are summarized in
Figure 4A, and further detailed in Supplementary Figure S7, and confirm the highest sensitivity of microarrays, followed by SFL and 30
DGE.
The set of genes up-regulated in “smokers vs. non-smokers” was found to be significantly (FDRQ-value< 0.05) enriched in all “CSC vs. DMSO” signatures, within both genotypic stratifications for all three platforms. Conversely, the set of down-regulated genes in “smokers vs. non-smokers” was only enriched in the microarray signature of “NRF2 over-expressed; CSC vs. DMSO” (Supplementary Figure S7).
The enrichment results of TCGA-derived gene sets with respect to differential signatures of genotypic perturbations were in agreement with the gene-level results, in that they consistently demonstrated smaller discovery rates by 30
DGE than by SFL or by microarrays (Figure 4A). For example, the significantly enriched gene sets in “DMSO-treated; NRF2 vs. HcRed” differential signatures across all three platforms are highlighted in Supplementary Figure S7. The number of gene sets enriched in microarray, SFL, and 30
DGE platforms are five, three, and zero, respectively.
FIGURE 3 | Signal-to-noise comparison between SFL, microarray, and 30DGE. (A) Scatterplots comparing the log10(F-Statistics) from ANOVA models comparing four n = 3 groups (HcRed:DMSO, HcRed:CSC, NRF2:DMSO, and NRF2:CSC). The gray line shows y = x. The platform with the higher mean log10(F-Statistic) is plotted on the y-axis. Also, included are the p-value and difference in mean between each bi-platform comparison from paired t-testing, as well as the squared correlation coefficient. P-values ∼ 0 are less than 0.01. Color of indicate genes discovered by individual platforms (green, orange, or blue), neither platform (gray), and both platforms (red). (B) Plot of the Discovery Rate versus FDR Q-Value from threshold for each platform from four group ANOVA models. The x-axis is plotted on a –log10 scale. The vertical line is indicative of a Q-value threshold of 0.05. (C) Loess fit of the log10(F-Statistic) versus median normalized expression from four group ANOVA models. (D) Distribution of mean normalized expression across all three platforms. (E) Comparison of gene discovery (FDR Q-Value< 0.05) by differential analysis with limma, comparing normalized gene expression between DMSO:NRF2 and DMSO:HcRed, including the raw discovery rates, discovered gene overlap, and linear fits, comparing test statistics from each platform. Genes that are discovered by more than 1 platform are shown in red in the scatterplots. Additional comparisons are shown in Supplementary Figure S5. (F) Plot of the Discovery Rate versus FDR Q-Value from threshold for each platform from two group differential analyses. The x-axis is plotted on a –Log10 scale. The vertical line is indicative of a Q-value threshold of 0.05.
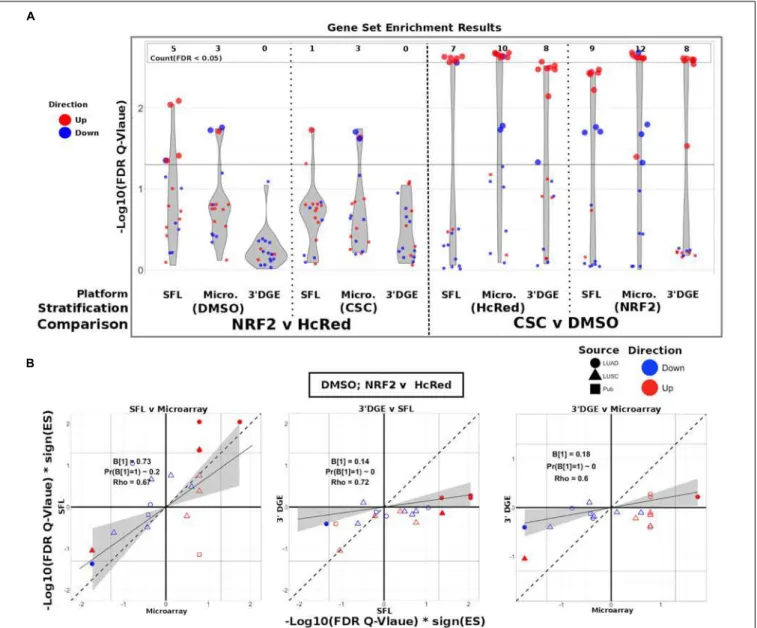
FIGURE 4 | Comparison of gene-set enrichment of smoking and gene mutation signatures across SFL, 30
DGE and microarray. (A) Violin plots of the –Log10(FDR Q-Value) from gene set enrichment analysis of TCGA-derived gene-sets with respect genotypic perturbations (left) and chemical perturbations (right) differential signatures across like samples within SFL, Microarray, and 30
DGE. Each column corresponds to differential signatures comparing genotypic or chemical perturbation groups, stratified by a single chemical or genotypic perturbation group, respectively, e.g., the left-most column shows the enrichment results with respect to the “DMSO-treated; NRF2 vs. HcRed” signature within the samples (stratum) in SFL data. Specific results for TCGA-derived genes sets are shown in Supplementary Figure S7. (B) Comparison of the gene set enrichment results between SFL, microarray and 30
DGE with respect to the “DMSO-treated; NRF2 vs. HcRed” differential signature. Shown are the transformed FDR Q-values of the TCGA-derived gene sets corresponding to mutations of NRF2 and CNA of KEAP1. The | –Log10(FDR Q-Values)| corresponding to the FDR< 0.05 significance thresholds are shown as vertical and horizontal gray lines for the y and x-axes, respectively. Points of gene sets whose enrichment meets this threshold in either of the two platforms are filled in. Colors and shape of points denote direction and source of the gene set, respectively. Additional results for chemical and genotypic perturbation signatures are shown if Supplementary Figure S8.
In addition to comparing which gene sets were significantly enriched in individual differential signatures, we compared the relative statistical signal of these enrichments. To this end, we transformed the permutation-based FDR Q-values by taking the negative Log10 and multiplying by the direction of the enrichment score (ES), −Log10(FDR Q-values)∗
sign(ES). For each two-platform comparison, we fit a regression model through the origin. Since consistent results across platforms would result in a model fit close to the identity line, y = x, we tested
whether the slope coefficient equaled 1 (i.e.,B1= 1). Figure 4B shows these results for each of the three comparisons of the NRF2 and KEAP1 mutation-based gene sets enrichment against the “DMSO-treated; NRF2 vs. HcRed” signatures. In all three comparisons, microarrays have the highest measured enrichment signal, followed by SFL and 30
DGE, however, the difference between microarray and SFL results is not significant,B1= 0.73; p-value = 0.2. The coefficients for both of the comparisons to 30
B1 = 0.18 and 0.14, respectively. Both of these comparisons are highly significant withp-values< 0.01. Comparison of the enrichment results for other differential signatures show similar trends (Supplementary Figure S8).
Next, we compared enrichment results with respect to all genotypic perturbation signatures between SFL and 30
DGE (Figure 5A and Supplementary Figure S9A). Each comparison (i.e., each point in the plot) denotes gene set enrichment results with respect to genotypic perturbations within each of the four chemical exposures, DMSO, CSC, BaP, and NNK. Gene sets were tested for enrichment against concordant differential signatures, e.g., thePIK3CA mutation-derived gene set was tested against the “PIK3CA vs. HcRed” signatures. As in the previous analysis, the permutation-based enrichment FDRQ-values were transformed by –Log10(FDR Q-values)∗
sign(ES). In the “DMSO-treated; genotypic perturbation vs. control” signatures, we observe that the gene set enrichment is generally more significant for SFL than for 30
DGE (B1 = 0.63;p-value< 0.01; Figure 5A). The results obtained in CSC- and NNK-treated signatures, demonstrate concordance to these results (B1 = 0.65; p-value = 0.03 and B1= 0.60;p-value = 0.01, respectively). The BaP-treated results are less comparable since only one genotypic perturbation signature, “FAT1 vs. GFP,” is available for this stratification (Supplementary Figure S9A).
Additionally, we compared our differential signatures to available full coverage poly-A RNA-seq genotypic perturbations (Supplementary Figure S9B), although these results are considered less comparable because of differences in experimental set-up. In particular, in the full coverage poly-A RNA-seq experiments the genotypic perturbations were performed on untreated rather than DMSO-treated cell lines (Figure 1).
The effect on discovery rate by subsampling the data across all three platforms is shown in Figure 5B. Generally, we did not observe a plateauing of discovery rate, where the number of detected genes plateaus near full counted library size. When comparing the correlation between GSEA results on subsampled data we observe similar trends across full coverage RNA-seq, SFL, and 30
DGE (Figure 5C). Initial subsampling of full coverage RNA-seq and 30
DGE to the SFL counted library size did not change the analysis results.
In summary, differential analysis of molecular and genotypic perturbations with SFL recapitulates biologically meaningful signal of gene sets derived from high coveragein vivo data sets. This performance is comparable to both 30
DGE and microarray.
DISCUSSION
The goal of this study was to evaluate the performance of SFL sequencing, a low-cost method for performing highly multiplexed RNA-seq, and to compare it to other high-throughput gene expression profiling platforms. The development of such methods would be instrumental to the generation of large-scale perturbation screens based onin vitro models. The reduction of the cost per profile would make it feasible to significantly increase the number of replicates
and conditions to be profiled, including multiple time points, concentrations, and biological models, and thus would support a more in-depth investigation of the heterogeneity of the biological response to different exposures. It would also support the development of more accurate predictive models of the adverse or therapeutic outcomes of various exposures. Finally, insights gained from our study will also inform the design of protocols for single cell RNA-sequencing (Eberwine et al., 2014), given their reliance on highly multiplexed libraries.
In addition to SFL, the platforms included in this analysis were 30
DGE, an alternative highly multiplexed sequencing platform, Affymetrix GeneChip Human Gene 2.0 ST Microarray, an analog expression platform, and full coverage poly-A capture RNA-seq. The cost per sample for SFL and 30
DGE was ∼$50, a 10-fold decrease from that of full coverage RNA-seq, $500, and a 7-fold decrease from that of the microarray, $350 USD. Throughout this analysis we demonstrate comparable performances of SFL and 30
DGE to these more expensive platforms. Furthermore, in this analysis we consistently find evidence that SFL outperforms 30
DGE.
Performance was assessed in terms of coverage, signal-to-noise, and recapitulation of expected biological signal derived from independently generated, publicly available data collected from human subjects. Coverage was assessed by comparing the three digital expression platforms, while signal-to-noise and biological recapitulation was assessed by comparing SFL, 30
DGE, and microarrays. Microarray expression quantification has been shown to be highly correlated with qRT-PCR, especially when processed with updated probe set annotations, utilized in this analysis (Sandberg and Larsson, 2007). Chemical and molecular perturbations were carried out in the same samples, and concurrently profiled by SFL, 30
DGE, and microarrays. We also leveraged previously generated full coverage poly-A RNA-seq profiles from similar perturbations of AALE cell lines.
For coverage assessment, performance was evaluated in terms of the distribution of total reads, or library size, that were aligned to the human genome, and further quantified in annotated genes. The best performance was expected in full coverage poly-A RNA-seq, given that this is the most well-established technique and has by far the highest sequencing depth. This was confirmed, as full coverage poly-A RNA-seq was measured to have the highest per sample library size, percentage of aligned reads, percentage of uniquely aligned reads, and percentage of counted reads (Figure 2 and Supplementary Figure S1). The coverage performance of SFL suffered as a result of rRNA contamination, where as many as 53% of the total library size per sample was assigned to ribosomal regions of the genome (Supplementary Figure S3).
30
DGE is a poly-A capture technique, therefore ribosomal depletion is not a possible pitfall. 30
DGE generates a short nucleotide tags from transposon-based fragmentation, which are enriched for 30
adjacent sequences of a given transcript (Soumillon et al., 2014). Since many transcripts of the same gene generate identical sequence tags, unique molecular identifiers (UMIs) are used to distinguish between unique reads and duplicate reads generated from PCR amplification. Although
mRNA fragment duplication occurs with any RNA-seq protocol, the impact of this artifact on downstream analyses is negligible for techniques, such as SFL, which generate more complex sequence libraries (Parekh et al., 2016).
30
DGE sequences were aligned directly to human mRNAs, rather than the whole genome. Therefore, percentages of reads aligned and reads counted (Figures 2Ci,iii) reflect the percentages of these non-unique UMIs that align to at least one
FIGURE 5 | Comparison of gene-set enrichment of gene mutation signatures across SFL and 30DGE. (A) Comparison of the gene set enrichment results between SFL and 30DGE with respect to the “DMSO-treated; genotypic perturbation vs. control” differential signatures. Points indicate gene set enrichment against concordant signatures, e.g., PIK3CA mutation and CNA gene sets against the “PIK3CA vs. HcRed” differential signatures. Shown are the transformed FDR Q-values from permutation-based testing by pre-ranked GSEA. | –Log10(FDR Q-Values)| corresponding to the FDR = 0.05 significance thresholds are shown as vertical and horizontal gray lines for the y- and x-axes, respectively. The names of the gene sets whose enrichment meets this threshold in either of the two platforms are shown and their points are filled in. Colors and shape of points denote direction and source of the gene set, respectively. Additional results for CSC, NNK, and BaP stratified genotypic perturbation signatures, as well as comparisons between full coverage RNA-seq and either SFL and 30DGE are shown in Supplementary Figure S9. (B) Discovery rates for genotypic perturbations across full coverage poly-A RNA-seq, SFL, and 30
DGE, for chemically untreated (full coverage RNA-seq) and DMSO treated (SFL and 30
DGE) samples. Results demonstrate full counted library size, as well as subsampled libraries. (C) Correlation between transformed FDR Q-values from gene set enrichment at different subsamples of each platform and the results from the full counted library size. Shown are the results from genotypic perturbations from untreated (full coverage RNA-seq)/DMSO treated (SFL and 30DGE), CSC, and NNK chemically treated samples.
gene and the number of unique UMIs that align to only one gene, respectively. We observe that the percentage of counted reads is greater for 30
DGE than SFL, which is explained by a loss of reads to rRNA contamination in SFL. However, we observe notably more genes quantified by SFL than by 30
DGE (Figures 2B,Civ), which indicates that more reads are assigned to fewer genes in 30
DGE compared to SFL, as well as to full coverage RNA-seq (Figure 2C). Although rRNA contamination is a potential drawback of any ribosomal depletion RNA-sequencing technique, the extent of ribosomal contamination is variable, and could be potentially improved by further optimization of the library preparation protocol.
The difference in distribution of reads across shared genes between SFL and 30
DGE likely explains the difference in information retained by subsampling as measured by principal component error. Although full coverage poly-A RNA-seq clearly outperforms both SFL and 30
DGE for principal component assessment, we consistently observe that, as the counted library size increases, the rate of principal component error decreases faster for SFL than 30
DGE (Figure 2D and Supplementary
Figure S1D). This is unsurprising considering that not only are considerably fewer genes quantified by SFL compared to 30
DGE, but there is also no discernable difference between the rate of genes counted as a function of counted library size between the two platforms (Supplementary Figure S1C). As we subsample the counted libraries, though we may lose the same number of genes between SFL and 30
DGE, the percent of genes lost, and consequently the information lost, will be greater for 30
DGE than SFL. Furthermore, this more even read distribution likely explains the improved performance of SFL over 30
DGE in statistical signal. In particular, our signal-to-noise evaluation shows consistently higher gene-level statistical signal from SFL and microarray experiments than from 30
DGE experiments (Figure 3). These differences appear to be driven by the differences in the relative quantification of genes, given that statistical signal is positively associated with mean gene expression for each platform, and 30
DGE experiments showed lower gene-level quantification than SFL and microarrays (Figures 3C,D). We observe similar cross-platform relationships in the two-group differential analyses (Figures 3E,F).
The gene set-based enrichment results are consistent with those from signal-to-noise analyses. In every comparison of enrichment scores between SFL and 30
DGE, we observe generally higher gene set enrichment with respect to the SFL-derived signatures (Figures 4, 5A and Supplementary
Figures S8, S9). The gene sets were selected to represent known biological responses to the profiled perturbations, and thus their enrichment with respect to the perturbation signatures are expected to be true positives.
The enrichment results confirm this expectation. For example, in the signatures ofNRF2 overexpression, we consistently observe enrichment of the gene sets derived fromNRF2 amplifications and KEAP1 deletions, each of which should increase NRF2 activity (Supplementary Figure S7) (Kansanen et al., 2013). Similarly, we observe significant concordant enrichment of the gene sets derived from NRF2 and KEAP1-dysregulated lung tumors in the signature of CSC exposure, suggesting
that the NRF2 pathway is activated by CSC exposure in vitro (Supplementary Figure S7), which has been previously reported (Adair-Kirk et al., 2008). Interestingly, these results demonstrate that the activation of the NRF2 pathway in normal airway epithelial cells in vitro (by ectopic expression of the gene or by CSC treatment) is concordant with the activation of NRF2 by somatic genome alterations in lung tumors, a finding that, to the best of our knowledge, has not been previously observed.
Possible sources of technical variability in this study are the different sequencing platforms, service providers, and read lengths. However, when subsampling the 30
DGE and SFL counted libraries, we generally observe higher discovery rates at all percentages of the full counted libraries, and even more so when the 30
DGE counted libraries are initially subsampled to full SFL counted library sizes (Figure 5B), demonstrating that SFL shows improvements independent of the mapping rate. This result confirms previous reports showing that increasing read length above 50-bp does not improve read quantification (Chhangawala et al., 2015). Furthermore, similar results have been reported even when the same sequencing platform is used. A recent study reported a greater number of genes detected, as well as higher differential analysis discovery rates, in conventional RNA-seq than in 3’DGE at identical counted library sizes, using the Illumina HiSeq 2500 platform to generate both libraries (Xiong et al., 2017).
In summary, in this study we observe higher performance of SFL than 30
DGE, as measured by coverage, signal-to-noise, and biological recapitulation of known signal, with the performance of SFL often matching that of well-established “gold standards” (full coverage RNA-seq or microarrays). On the other hand, the fact that 30
DGE is shown to allocate a large number of reads to relatively fewer, highly expressed genes, makes this platform more suitable for problems where high accuracy in the differential quantification of highly expressed genes is needed. Furthermore, the ready availability of 30
DGE as a core-provided option, which allows for the out-sourcing of library preparation, sequence read pre-processing and gene quantification, is an additional value-added of the platform. Ultimately, the best-suited platform for a specific project will depend on the study goals, design, and availability of different resources. We believe our study presents useful results to make a more informed choice.
The utility of highly multiplexed RNA-seq crucially depends on the trade-off between cost and data quality, and on the nature of the experiments for which the platform would be ideally suitable. These will in general be experiments where the marginal information content of a single profile is relatively low, and thus justifies trading-off some data quality for reduced cost.
DATA AVAILABILITY
Data for SFL, 30DGE, and Microarray experiments is available through the Gene Expression Omnibus (GEO) at accession numbers: GSE118797, GSE118798, and GSE118799. Reviewers