PhD in Clinical & Experimental Medicine
UNIVERSITÀ DEGLI STUDI DEL PIEMONTE ORIENTALE “AMEDEO AVOGADRO”
Dipartimento di Medicina Traslazionale
Corso di Dottorato di Ricerca in Medicina Clinica e Sperimentale ciclo XXVII
Optical Coherence Tomography, from bench to bedside: Shining the light during percutaneous vascular intervention
SSD MED 11
Coordinatore Tutor
Prof.ssa Marisa Gariglio Prof. Paolo Nicola Marino
Dottorando Gioel Gabrio Secco
INDEX
1. INTRODUCTION
2. EXPERIMENTAL RESULTS
2.1 Optical Coherence Tomography during coronary intervention.
2.1.1 Study 1: Optical Coherence Tomography for Guidance of Treatment of In-stent Restenosis with Cutting Balloons
2.1.2 Study 2: Long-term tissue coverage of a biodegradable polylactide polymer-coated biolimus-eluting stent: Comparative sequential assessment with optical coherence tomography until complete resorption of the polymer
2.1.3 Study 3: Time-related changes in neointimal tissue coverage following a new generation SES implantation: an optical coherence tomography observational study.
2.1.4 Study 4: ABSORB biodegradable stents versus second-generation metal stents: a comparison study of 100 complex lesions treated under OCT guidance 2.1.5 Study 5: Very High Pressure Dilatation for Undilatable Coronary Lesions: Indications and Results with a New Dedicated Balloon
2.2 Optical Coherence Tomography during renal denervation
2.2.1 Study 6: Safety and efficacy of saline infusion for optical coherence tomography evaluation of vascular lesion induced by renal nerve ablation
2.3 Optical Coherence Tomography during peripheral vascular intervention.
2.3.1 Study 7: Saline vs contrast infusion during optical coherence tomography imaging of peripheral percutaneous intervention
2.3.2 Study 8: Optical Coherence Tomography guidance during peripheral vascular intervention
2.4 Optical Coherence Tomography during carotid artery intervention
2.4.1 Study 9: Carotid artery stenting (CAS): an update. Optical Coherence Tomography during CAS: interaction between stent design and atherosclerotic plaque.
1. INTRODUCTION
In the past decades angiography has been the keystone tool to assess coronary anatomy, leading to the development of largely applied revascularisation techniques such as coronary bypass surgery and percutaneous transluminal angioplasty.
Despite the widespread dissemination and high reproducibility, angiography alone can only provide a limited analysis of lumen profile without the possibility to disclose vessel wall characteristics and composition of coronary lesions. In fact, coronary angiography depicts arteries as planar silhouette of the contrast-filled lumen and disease assessment is based on the comparison of the stenostic segment with the adjacent “normal appearing” artery, which is often an incorrect assumption due to the diffuse nature of atherosclerosis as shown by pathological studies. Moreover, angiography interpretation is flawed by large inter- and intra-observer variability and usually underestimates the severity of the disease and vessel dimension (1). Three-dimensional angiography may provide more accurate assessment of the luminogram but it still does not allow visualisation of the arterial wall and plaque composition.
Intracoronary imaging techniques have been developed to overcome these limitations.
Intravascular ultrasound (IVUS) was the first intracoronary imaging modality introduced in interventional cardiology in the early ‘90ies (2), followed more than a decade after by optical coherence tomography (OCT) a light based technology. OCT is similar to IVUS providing information about intravascular anatomy that far exceeds the level of detail obtained from conventional angiography. The use of near-infrared light rather than ultrasound reflectance allows OCT to have higher spatial resolution (with up to 10 to 15 µm of spatial resolution compared with the
100- to 200 µm resolution of IVUS) but lower penetration power (1 to 3 mm into vessel wall compared with the 4 to 10 mm of IVUS). Moreover, near-infrared light is scattered by red blood cells, and therefore OCT use for guidance of intervention was limited by the need of prolonged crystalloid infusion during imaging. In so forth, OCT has been initially employed as a research tool to investigate plaque morphology and stent strut endothelisation.
The Frequency domain OCT system (FD-OCT) has the advantage of a more rapid image acquisition due to the fast-scanning laser systems able to minimise the contrast use and to increase imaging speed while delivering an improved image quality than with the earlier time domain systems (TD-OCT). Thus this allows multiple acquisitions of the entire segment of interest with an amount of contrast only slightly greater than contrast required for the control angiogram (3).
Despite these features, the use of OCT as an additional imaging technique is still debated in daily clinical practice.
The aim of this thesis was to evaluate the role of OCT in contemporary vascular intervention enlarging its use not only during coronary revascularization but even in new field such as during peripheral vascular intervention, renal nerve denervation and carotid artery stenting.
2. EXPERIMENTAL RESULTS
2.1 OPTICAL COHERENCE TOMOGRAPHY DURING CORONARY INTERVENTION.
2.1.1 Study 1
Title: Optical Coherence Tomography for Guidance of Treatment of In-stent Restenosis with Cutting Balloons.
Background
The treatment of ISR remains a challenge with poor immediate results and higher restenosis rate than in de novo lesions. IVUS studies (4-5) have shown that, despite the use of larger balloons, higher pressure and new stents, the final minimal lumen cross sectional area (MLCSA) achieved was smaller than the minimal stent cross section area (MSCSA) after initial stent deployment. We hypothesized that this was due to the inability to apply direct pressure to the previously deployed stent due to the cushion-like protection of the neointima, precluding adequate stent expansion.
Aim
We tested an alternative treatment strategy based on the use of cutting balloons (CB) sized with Optical Coherence Tomography (OCT) to achieve effective cutting as close as possible to the struts, allowing subsequent better extrusion of the neointima outside the stent and direct transmission of the expanding force of the balloon to the stent struts.
Materials and Methods
We assessed 14 consecutive ISR lesions involving the right coronary artery (n.2), left circumflex (n.6), left anterior descending (n.4), first diagonal branch (n.1) and a saphenous vein graft to RCA (n.1). All the stents initially implanted in the restenotic segment were DES (Table 1).
Angiographic and Optical coherence tomography images acquisition ISR lesions were classified according to Mehran et al (14) in:
- Class I: (Focal ISR): lesion < 10 mm in length and positioned at the unscaffolded segment, the body of the stent, the proximal or distal margin (not both) or a combination of these sites;
- Class II: (Diffuse intrastent ISR): lesion > 10mm in length and confined to the stent, without extending outside the margins;
- Class III: (Diffuse proliferative ISR): lesion < 10 mm in length extending beyond the margins;
- Class IV: ISR with total occlusion”.
Subsequently OCT acquisition was performed with a frequency domain analysis system (C7, LightLab Imaging Inc., Westford, Massachusetts, USA). A motorized pullback at 2 cm/s was activated during injection of iodixanol 320 (Visipaque, GE Health Care, Cork, Ireland) via 6 or 7 Fr guiding catheter at a flow rate sufficient to have full substitution of blood with contrast with no streaming (non-occlusive technique). The position of the imaging probe at the time of the start of pull-back was documented angiographically. Frames were analyzed every 0.5 mm. Anatomical landmarks such as side branches, calcifications, or stent edges were used for longitudinal orientation.
Optical coherence tomography data analysis:
Qualitative and quantitative analysis of OCT images was performed offline using proprietary software (C7LightLab Imaging). MLCSA and MSCSA were measured
before and after each CB inflation and after stent deployment and high pressure post-expansion. Neointimal area was calculated by subtracting the luminal area from the stent area. The minimal distance between neointimal fissures created by the microatherotome blades and stent struts was calculated after each cutting balloon inflation. The first CB was selected by the operator according to the visual estimation of the angiographic reference diameter. In 3 patients a smaller conventional balloon had to be used for initial predilatation because of the impossibility to perform OCT in a total occluded vessel. In 2 patients a smaller conventional balloon had to be used for initial predilatation because the CB did not cross directly. In a tortuous RCA the CB could be used only in a proximal but not in the distal segment of ISR. The CB diameter was then upsized based on the OCT assessment of the stent diameter aiming at achieving a CB/ stent ratio of 1.1-1.2/1.0. New DES were implanted in all patients except two lesions with small diameter and multiple previously implanted stents in which the operator felt that a sufficient result was achieved with CB dilatation only (Figures 1 and 2). No dissections requiring new stent implantation were observed after the final OCT acquisition.
Clinical follow up
In-hospital, 30 days, and cumulative 6 months MACE were defined as death, myocardial infarction and repeat revascularization (CABG or PTCA). Twelve-lead electrocardiograms were recorded before, immediately after the procedure and at hospital discharge.
Figure 1: Lesion treated with only cutting balloon expansion. A: Angiogram and OCT pre-treatment: a thick, nearly concentric layer of hyperplasia is revealed by the OCT examination inside a double crown of struts due to the deployment of a 3.0 EES stent inside a 3.5 bare metal stent. B: Angiogram and OCT after 3.0×10 mm CB (16 ATM): the lumen is improved, but there is a filling defect inside the stent due to residual hyperplasia; the corresponding OCT image indicates that a deep cut approaching the struts is present only in one direction (4 o’clock); based on the stent diameter a larger CB is selected. C: Angiogram and OCT after 3.5×10 mm CB (16 ATM): the good angiographic result is explained by the second deep cut (struts in contact with the lumen at 4 o’clock and 9 o’clock) with MLCSA increased from 4.4 mm2 to 5.4 mm2.
Figure 2: OCT 3-D reconstruction of a plaque treated by cutting balloon expansion. A: Angiogram, OCT and OCT 3-D reconstruction pre-treatment: a thick layer of intimal thickening justifies the severe stenosis. Please note that the OCT image has been obtained after predilation with a 2.0 mm balloon while the angiogram is before treatment. B: Angiogram, OCT and OCT 3-D reconstruction after CB 3.0×10 mm (16 ATM): An acceptable and regular lumen has been created by the dilatation with some struts visible in the corresponding 3D reconstruction.
Results
Angiographic analysis (tab. 1)
Of the ISR lesions treated 6 were focal, 3 had diffuse ISR, 2 had diffuse proliferative ISR and 3 had a total occlusive restenosis.
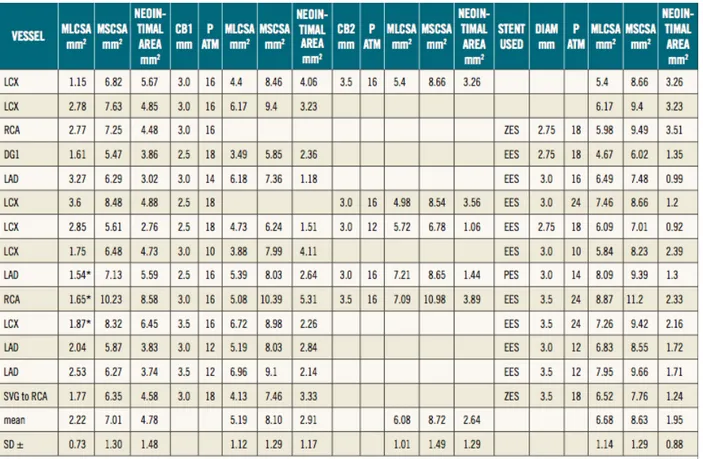
Table 1: Months after stent implantation, type of stent used and angiographic findings.
Optical coherence tomography analysis (tab. 2)
The mean MCSA of the lumen and stent pre treatment was respectively 2.22 + 0.73 mm^2 and 7.01 + 1.30 mm^2. The mean MCSA lumen after first and second cutting balloon inflation, were respectively 5.19 + 1.12 mm^2 and 6.08 + 1.01 mm^2 .The mean final MCSA lumen was 6.68 + 1.14 mm^2. In the patients with
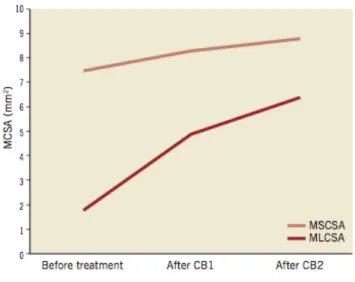
a two step strategy using a first CB guided by angiography and a second CB guided by OCT, the increase in CB diameter was 0.5 mm, achieving an increase in MLCSA area from 4.9 + 0.42 to 6.35 + 0.92 mm2 with a reduction from 41% to 27% of neointimal hyperplasia (Figure 3 and 4).
Table 2: OCT data analysis.
Clinical Follow Up
No in-hospital, no 30 days and no 6 months MACE (death, myocardial infarction and repeat revascularization CABG or PTCA) were reported.
Figure 3: Increase in MLCSA and MCSA of the stent in four patients treated with a two-step strategy: first CB guided by angiography and second CB guided by OCT (Please note that the increase in CB diameter was 0.5 mm, achieving an increase in MLCSA from 4.9±0.42 to 6.35±0.92 mm2)
Figure 4: Mean reduction in neointimal plaque area in 11 patients with FD-OCT examinations available both after CB expansion and stent deployment. (Two patients were excluded because they were treated only with CB and one patient was excluded because no OCT examination was performed after CB expansion). The neointimal area after stent implantation was considered the tissue located between the two stents layers.
Discussion
Cutting balloons are used for treatment of ISR mainly because of the practical advantage that they do not move during inflation due to the stabilising effect of the blades, preventing damage outside the stenting segment (watermelon seeding effect).
The lack of clinical benefit observed in the early studies of CB vs conventional PTCA in de novo lesions or after treatment of ISR have created scepticism on the potential mechanical advantage offered by a focal concentration of force on the intimal plaque. Hoop stress is a circumferential stress in the vessel wall that balances the intra-arterial pressure and prevents vessel expansion (6). In a pressurised vessel where r is the inner radius and R is the outer radius, the hoop stress can be estimated by the Laplace law : σ = P(R + r) / (R - r), where P is the pressure on the vessel wall (17). During PTCA, balloons are often inflated with pressure up to 20 ATM (2025 kPA), 150 times higher than the normal arterial wall’s pressure (approximately 100 mmHg =13 kPa = 0.13 ATM). The mechanical properties of the arterial wall are critically dependent on the thickness of the wall and the characteristics of the intimal plaque. Consequently, the balloon pressure necessary to achieve circumferential overstretch and a satisfactory lumen expansion is intrinsically dependent of the tissue property and wall thickness. Thick neointimal hyperplasia and the stent itself contribute to increase the hoop stress to the point that even high pressure non-compliant balloons might be insufficient to overcome the hoop stress and induct a persistent plastic deformation of the vessel wall (7).
CBs have been designed to relieve the vessel hoop stress by creating controlled small incisions in the vessel wall. CBs present several advantages for the treatment of ISR, allowing a larger luminal gain at lower pressure compared to PCTA alone and preventing the late elastic recoil due to the incisions created by the blades.
When CBs were compared with conventional balloons for treatment of ISR the advantages observed in registries (8) were not confirmed in appropriately sized randomised trials (9). These trials were performed in the BMS era and without systematic IVUS guidance, not allowing the distinction between ISR due to stent underexpansion, unlikely to respond better to CB, and ISR due to excessive neointimal proliferation, as in all cases in this case series where IVUS was already used in most cases before and after stenting. IVUS is seldomly used to check the adequacy of the effect of CB because of its inability to detect the cuts in most of the cases. Suzuki et al., studying animal and in vitro models of ISR, demonstrated that IVUS tends to overestimate lumen area and underestimate the signal-poor in-stent hyperplasia (10). The OCT measurements were closer to the histological measurements because of the better delineation of the neointima-lumen interface. Balloon angioplasty was the initial strategy for treatment of ISR and proved to be user friendly and associated with good initial results, low incidence of in-hospital complications but relatively high late repeat ISR . In an IVUS study investigating treatment of ISR, Mehran et al (11) demonstrated that when treating ISR with PCTA, luminal gain is achieved by a combination of additional stent expansion and neointimal tissue compression through the stent resulting in a displacement through the stent strut and compression of neointimal tissue. Although satisfactory initial clinical and angiographic results were obtained with balloon angioplasty, a significant early lumen loss was also observed shortly after ISR treatment due to recoil and re-intrusion of neointimal tissue in the lumen (12). This early phenomeon possibly influences the long-term outcome after POBA for ISR, affected by a high re-restenosis rate. CBs, compared with conventional angioplasty balloons, present the significant advantage that the incisions of the microblades reduce the recoil of neointimal tissue into the lumen and allow greater stent expansion by reducing the hoop stress in the neointimal tissue. This explanation is
based on a previous study that demonstrated a greater capacity of CB over PCTA to extrude fibrous plaque and residual neointimal tissue out of the stent struts. OCT has been shown to be a greatly valuable tool to identify pattern and severity of restenosis (13) and to study its mechanisms. Furthermore, due to its high resolution, OCT is able to provide detailed characteristics of restenotic lesions such as the presence of neovascular formation in the neointimal tissue and identify the changes induced by the thin cuts of the CB blades. In fact, using OCT we were able to guide the selection of the CB based on the distance between neointimal fissures created by the micro blades and stent struts in order to eventually upgrade the CB diameter when the result was unsatisfactory. We believe that this allows greater expansion of the DES implanted in most cases as final step of treatment and has the potential of an even greater advantage if drug eluting balloons are used. This can lead to a greater MLCSA in order to achieve the largest final lumen, providing a “safety margin” for possible reactive hyperplasia (“bigger-is-better”). In fact, in all of the 14 ISR lesions we were able to achieve a satisfactory final MLCSA, always greater than 5.0 mm2, considered to be a valuable predictor for the long-term stent patency (14).
Limitations
The major limitation of this pilot study is the small size of the study population, justified by the rarity of restenoses after DES and, especially, DES restenoses with significant intimal hyperplasia. However, while DES are implanted in more than 90% of our practice and second generation DES are likely to reduce even more the phenomenon, other countries still use a majority of BMS or do not have second generation DES available.
Another limitation of our study is the lack of angiographic follow up, however, initial clinical follow up data are encouraging.
The OCT was employed to guide a clinically oriented strategy, avoiding unnecessary passes and contrast overload when the angiographic result was grossly inadequate or there was no possibility to further increase in CB diameter. This can explain the frequent occurrence of missing values in the various procedural steps.
2.1.2 Study 2
Title: Long-term tissue coverage of a biodegradable polylactide polymer-coated biolimus-eluting stent: Comparative sequential assessment with optical coherence tomography until complete resorption of the polymer.
Background
Biolimus-eluting stents (BESs) with a biodegradable polymer in abluminal coating achieve more complete coverage at 9 months compared with sirolimus-eluting stents (SESs) with a durable polymer, as assessed by optical coherence tomography (OCT). Whether this advantage persists or augments after complete resorption of the polymer (n.12 months) is unknown.
Aim
The aim of this study was to assess whether this difference persists after complete resorption of the BES polymer.
Materials and Methods
Study population and design
The design and main results from the LEADERS trial have been published elsewhere (15). It was an international randomized multicenter noninferiority trial comparing the BES BioMatrix Flex stent (Biosensors International, Morges, Switzerland) with the SES Cypher SELECT stent (Cordis, Miami Lakes, FL), following an all-comers approach with minimal exclusion criteria: patients with symptomatic coronary heart disease or silent ischemia were eligible if they had at least one coronary lesion of 50% diameter stenosis in vessels with 2.25- to 3.50- mm reference diameters, amenable for percutaneous treatment. The primary end point was a composite of cardiac death, myocardial infarction, and clinically
indicated target vessel revascularization at 9 months of follow-up. Patients were randomly allocated on a 1:1 basis to receive either BES or SES using random computer-generated sequences, stratified according to center. In a factorial design, they were additionally randomized on a 1:3 basis to angiographic and clinical follow-up at 9 months or clinical follow-up alone. Patients allocated to angiographic follow-up in 2 of the study sites (Royal Brompton Hospital, London, UK, and Erasmus MC, Rotterdam, the Netherlands) were also included in the OCT substudy. Serum creatinine 200 mol/L and left ventricular ejection fraction < 30% were the exclusion criteria for the OCT substudy. The primary end point for the OCT substudy was the proportion of uncovered struts at 9 and 24 months. The study complied with the Declaration of Helsinki, was approved by all institutional ethics committees, and was registered at clinical-trials.gov (NCT00389220). All patients provided written informed consent for participation.
Intervention and study stents
Direct stenting was allowed, and full lesion coverage was pursued by implanting one or several stents, as required. Only 1 type of DES was used per patient. The BioMatrix Flex stent (Biosensors International) consists of a stainless-steel platform (Juno; Biosensors International) coated by an abluminal 11-µm layer of polylactide polymer. The polymer contains Biolimus-A9 (Biosensors International, Morges, Switzerland) at a concentration of 15.6 µg/mm of stent length. Polylactide is linearly degraded by surface hydrolysis to lactide during a period of 6 to 12 months, resulting in simultaneous release of the drug. The Cypher SELECT stent (Cordis) consists of a stainless-steel platform coated by a durable blend of poly(ethylene-vinyl-acetate) and poly(butyl-methacrylate) containing sirolimus at a concentration of 8.3 to 10.4 µg/mm, depending on the stent nominal diameter. The drug elution period is estimated to be 90 days. After the intervention, the patients
received at least 75 mg of acetylsalicylic acid indefinitely and dual-antiplatelet therapy with 75 mg of clopidogrel for 12 months.
OCT study and analysis
Optical coherence tomography pullbacks were obtained at 9 and 24 months of follow-up with M3 or C7 systems (Lightlab Imaging, Westford, MA), depending on availability, using a nonocclusive technique10 (Table I).
OCT pullbacks were analyzed offline in a core laboratory (Cardialysis BV, Rotterdam, the Netherlands) by independent staff blinded to allocation and to clinical or procedural characteristics of the patients using proprietary software (Lightlab Imaging). Cross sections at 1-mm intervals within the stented segment were analyzed. Lumen and stent areas were drawn in each cross section, and incomplete stent apposition (ISA) or neointimal hyperplasia (NIH) areas were calculated, as appropriate (16). Apposition was assessed per strut by placing a marker at the adluminal leading edge, in the midpoint of the strut's long axis, and by measuring the distance between this marker and the lumen contour, following a straight line directed to the center of gravity of the vessel (17). Struts were considered malapposed if the distance was 170 µm (for SES) or 140 µm (for BES), the thresholds resulting from rounding up the sum of the strut-polymer thickness of
each stent (SES 153 µm, BES 120 µm) plus the axial resolution of OCT (14 µm). Struts located at the ostium of side branches, with no vessel wall behind, were labeled as nonapposed side-branch struts and excluded from the analysis of apposition.
Struts were classified as uncovered if any part of the strut was visibly exposed to the lumen, or as covered if a layer of tissue was visible over all the reflecting surfaces. In covered struts, thickness of coverage was measured from the strut marker to the adluminal edge of the tissue, following a straight line connecting the strut marker with the center of gravity of the vessel.
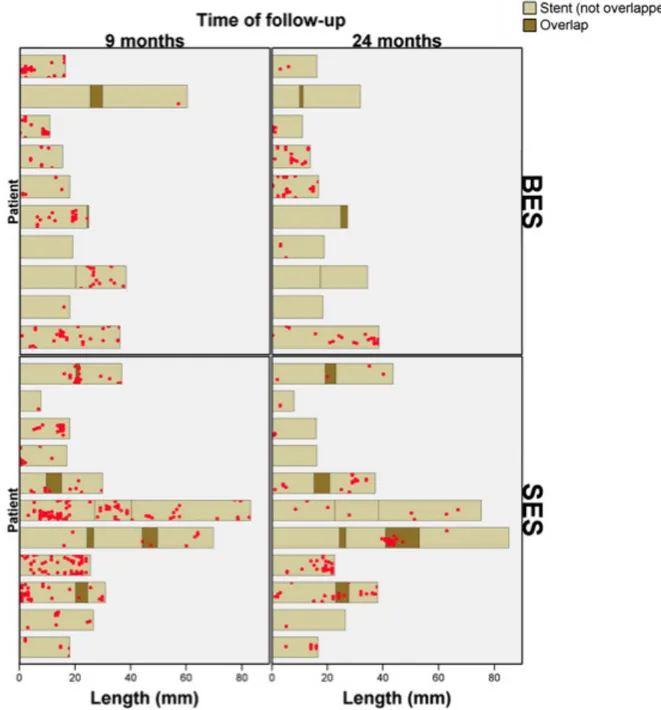
The clustering and spatial distribution of uncovered struts were summarized in “spread-out vessel graphics”13 (Figure 1).
Figure 1: Examples of spatial distributions of uncovered struts in spread-out-vessel graphs. Examples of 1 BES (upper panel) and 1 SES (lower panel) studied with OCT at 9 and 24 months. The x-axis represents the distance from the distal edge of the stent to the strut; the y-axis represents the angle where the strut is located in the circular cross section with respect to the center of gravity of the vessel. The result is a graph representing the spatial distribution of the noncovered struts (red spots) along the stent, as if it had been cut along the reference angle (0°) and spread out on a flat surface.
Statistical analysis
Prespecified primary outcome was the difference in percentage of uncovered struts at 24 months. Assuming an average number of 1.5 lesions per patient and 180 struts per lesion, an intracluster correlation coefficient of 0.04 for binary coverage of struts within lesions, and a design factor of 1.3, we estimated that the inclusion of 22 patients (with 33 lesions and 5,940 struts) per group would yield a greater than 90% power to detect a difference in uncovered struts of 4% at 9 months between BESs and SESs at a 2-sided type I error of 0.05. Secondary outcomes comprised other variables assessing coverage, ISA, and the geometric mean thickness of coverage. To estimate the differences between BES and SES, we used a Bayesian hierarchical random-effects model based on Markov chain Monte Carlo simulations with minimally informative priors. The model included random effects at the level of lesions and patients, fully accounting for the correlation of lesion characteristics within patients and their variation between patients. We used the Wilcoxon test for continuous variables and the Pearson χ2 or Fisher exact test as appropriate for dichotomous variables to compare baseline characteristics as well as areas and volumetric parameters per stent. Statistical analyses were performed using WinBUGS version 1.4.3 (Imperial College and Medical Research Council, London, UK) and Stata release 11 (StataCorp, College Station, TX).
Results
Eighty-eight patients (43 BES, 45 SES) were allocated to angiographic follow-up in the OCT study centers. Optical coherence tomography studies from 46 patients were finally analyzed at 9 months. All 46 patients were contacted at 24 months, but 25 refused to participate in a second invasive follow-up (20 BES, 26 SES). Sequential OCT follow-up was analyzed in 10 patients, 11 lesions, and 12 stents in
the BES group (2,455 struts at 9 months, 2,131 struts at 24 months) and in 10 patients, 11 lesions, and 18 stents in the SES group (3,421 struts at 9 months, 4,170 struts at 24 months). All 9-month studies were performed with a time-domain M3 system, whereas 15 studies at 24 months (71%) were performed with a Fourier-domain C7 system (Table I).
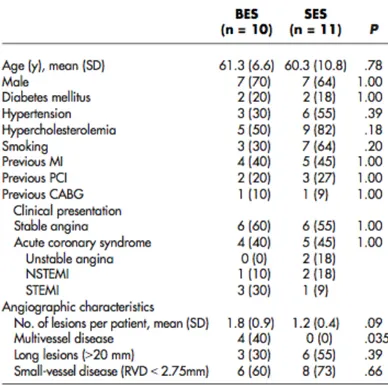
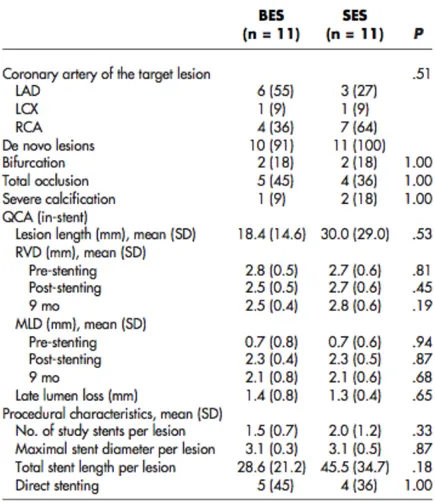
The baseline characteristics of the patients and lesions were comparable between both groups (Tables II and III). Table IV shows the mean areas and volumes per stent. At 9 months, corrected ISA volume was higher in SES than in BES (P < .047), decreasing in both groups at 24 months and making the difference no longer significant (P < .171).
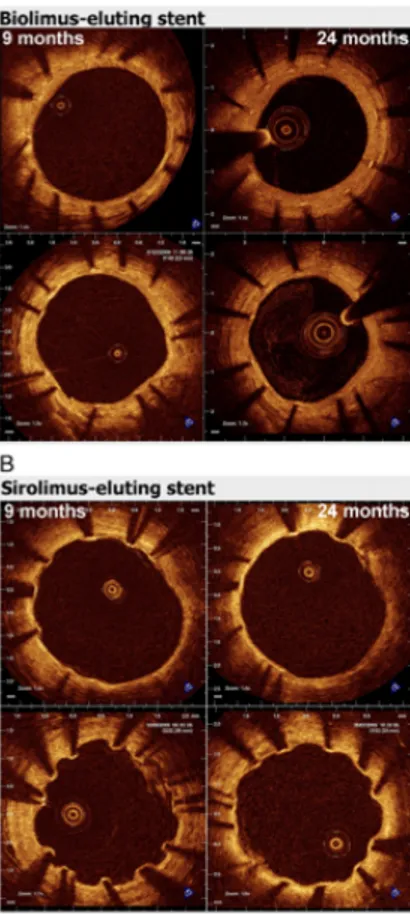
Figure 2 shows the evolution of coverage between 9 and 24 months in representative cross sections, matched using fiduciary landmarks.
Figure 2: A, Representative examples of matched cross sections at 9 and 24 months in BESs showing the pattern of coverage. B, Representative examples of matched cross sections at 9 and 24 months in SESs showing the pattern of coverage.
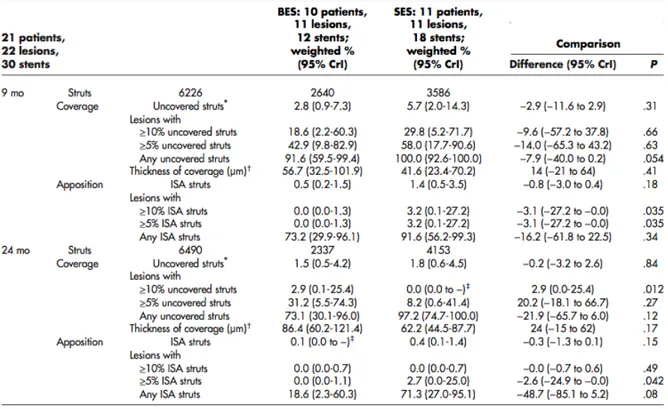
A total of 121 of 2,455 and 69 of 2,131 struts were uncovered in the BES group at 9 and 24 months, respectively; 286 of 3,421 and 109 of 4,170 struts were uncovered in the SES group at 9 and 24 months, respectively. At 9 months, the overall proportion of uncovered struts tended to be higher in SES than in BES, although it did not reach conventional levels of statistical significance (Table V). At 24 months, the proportion of uncovered struts decreased to similar levels in both groups (weighted percentage 2%) (Table V, Figure 3). The spread-out-vessel charts present the results for individual patients, showing the spatial distribution and temporal evolution of uncovered struts in 30 stents (Figure 4). There was little evidence for the differences in thickness of coverage or in the variables estimating apposition between the treatment groups at 9 or 24 months (Table V, Figure 6).
Table III: Angiographic and procedural characteristics of the lesions
Table V: Analysis of apposition and coverage per strut at 9 and 24 months
Figure 4: Spread-out-vessel charts showing the spatial distribution of uncovered struts at 9 and 24 months in the matched stents.
Discussion
In this sequential OCT study nested in a randomized comparison of 2 different DESs, we found that the advantage of a BES with a biodegradable polymer in abluminal coating over an SES with a durable polymer in terms of strut coverage at 9 months was followed by improvement of the SES coverage between 9 and 24 months, resulting in similar coverage in BES and SES at 24 months. Both types of stent converged at a maximum plateau around 98% strut coverage. Taken together, our results suggest that BES, indeed, is associated with faster healing compared with SES, achieving a percentage of coverage close to the maximum plateau (97%) at 9 months, whereas SES is catching up subsequently. To our knowledge, this is the first clinical in vivo study using sequential OCT to compare the coverage of 2 different types of DES. Previous sequential studies had reported SES coverage at 6 to 12 months16 and at 24 to 48 months17 using OCT, or at 4-11-21 months using angioscopy18; the latter was compared with a control bare metal stent.
“Very late healing” phenomenon
The improvement in coverage observed in SES between 9 and 24 months challenges the currently accepted evidence about the healing process after stenting and compels us to reconsider the initial interpretation of the 9-month results. Experimental studies suggested that the reendothelialization process ensuing a vessel injury, for example, stenting, was limited in time (18-20). Endothelial denudation of carotid arteries is followed by reendothelialization that stops after 2 weeks (in the rabbit) or after 6 weeks (in the rat), although endothelial continuity has not been restored (21, 22). This experimental evidence seemed consistent with the results of sequential angioscopic studies in SES, showing no improvement in the minimum coverage between 6 and 24 months, with an increase in the maximum and only slight improvement in the predominant score at 4-11-21 months, eventually suggesting an arrested healing process undergoing phenomena
of intima maturation or plaque progression. Our results question this static time-limited model of neointimal healing, suggesting a more dynamic process, still evolving between 9 and 24 months. Previous noncomparative studies using OCT suggested also this possibility: improvement of SES coverage has been reported at 3-24-48 months (23, 24) or between 6 and 12 months (25). Because of its high resolution (10-20 µm) and ability for detailed analysis, OCT could detect subtle changes in neointimal coverage, which are unnoticed for angioscopy or other imaging techniques. The evolution of neointimal volumes, increasing similarly in both stent groups between 9 and 24 months (Table IV), might indicate an actively repairing neointima but can also be the consequence of intima maturation or plaque progression. The ISA reduction between 9 and 24 months is more specific as an indicator of very late healing. Higher incidence of ISA in the SES group had been reported at 9 months and interpreted in terms of late-acquired ISA. This interpretation now becomes unlikely because the most pronounced reduction in ISA between 9 and 24 months is observed in SES. This is in disagreement with previous sequential studies reporting an increase in ISA areas and ISA struts between 24 and 48 months in SES (26). This discrepancy deserves further clarification in the future.
Different healing rates in different types of stent
The design of our study does not permit to elucidate the mechanism for the different healing rates observed between the devices. Although inflammation was the driving hypothesis for this study and was advocated to explain the differences reported at 9 months, it cannot satisfactorily explain the very late healing. Why does the initial advantage in coverage not persist after the proinflammatory polymer has completely disappeared in one of the devices? The role played by polymer-induced inflammation in the neointimal healing after stenting should be revisited: its deleterious effect might be not as sustained in time as currently
assumed, with the exception of infrequent delayed hypersensitivity reactions (27, 28). The kinetics of release differ from the coverage rates observed: the elution periods for SES and BES are 90 days and 6 to 9 months, respectively. The different inhibitory potency, lipophilicity, concentration, or pleiotropic effects of biolimus and sirolimus have played a role: the effective neointimal inhibition could be more intense in SES than in BES. Likewise, the design and geometry of the stent platforms could have promoted faster healing in the BES, especially the strut thickness. Both platforms are made of stainless steel, hence requiring thick struts (>100 µm) to provide enough radial strength for vessel scaffolding; but BES struts are slightly thinner (120 µm) than SES struts (140 and 154 µm if we add the polymer thickness), which is associated with faster healing. The selective abluminal coating of BES appears to be a more plausible explanation: the abluminal release of the drug might modulate the proliferation of smooth muscle cells in the media that minimally interferes with the reendothelialization of the adluminal side, thus promoting a faster reendothelialization.
Clinical implications
Very late healing could be key to understanding why clinical studies have failed to demonstrate higher rates of stent thrombosis in SES (29), although angioscopy or OCT have reported suboptimal coverage between 3 and 48 months. As suggested by our results and also by other studies, longer follow-up intervals would be required to assess the final neointimal coverage achieved.
To our knowledge, this is the first sequential OCT study suggesting that different types of stent can promote different healing rates. This may be relevant for tailoring the duration of dual-antiplatelet therapy after stenting.
Limitations
The refusal of some patients to undergo the 24-month OCT follow-up is the main limitation of this study. It might have induced some selection bias because the patients with more favorable outcome might have been more prone to refuse a second invasive follow-up. The lack of statistical significance at 9 months in this second analysis is also explained by the substantial loss of statistical precision resulting from the restricted sample size and not contradictory with the previously published results (30). The high percentage of refusals turned this study underpowered to detect the difference of the same magnitude.
2.1.3 Study 3
Title: Time-related changes in neointimal tissue coverage following a new generation SES implantation: an optical coherence tomography observational study.
Background
Drug eluting stent (DES) have become the treatment of choice for patients with symptomatic coronary artery disease undergoing PCI. Although this technology has reduced rates of restenosis and late lumen loss compared with bare metal setnt (BMS) it has been associated with delayed healing that might result in a small but statistically significant increase in Late and Very Late Stent Thrombosis.
Aim
The aim of our observational study was to evaluate using Optical Coherence Tomography (OCT) the time-related changes in vascular response following implantation of a new generation biodegradable polymer Sirolimus-eluting stent with an amorphous silicon carbide coating allowing higher biocompatibility and faster re-endothelisation (Orsiro DES, Biotronik AG, Bulach, Switzerland).
Materials and Methods
Study design and population
This prospective monocentric observational Registry enrolled only patients with acute STEMI and a multi-vessel disease (MVD), thus eligible for a two-step procedure. The PCI of the culprit lesion was performed with at least one Orsiro stent. The second procedure was then deferred accordingly to the severity of the non-culprit lesion and the presence of symptoms and signs of residual ischemia to
30 days, 90 days and 180 days. During the second procedure, the stent deployed at the infarct-related site was analysed by OCT.
The Orsiro Sirolimus Eluting Stent
The Orsiro DES (Biotronik Ag, Bulach, Switzerland) is a cobalt-chromium 60 micron and 80 micron stent struts (the lowest for the stent with a diameter ranging from 2.25 to 3.0 while 80 micron thickeness is for the 3.5 and 4.0 diameter stents), coated with a poly-L-lactide (PLLA) polymer that delivers sirolimus drug over 12– 14 weeks and degrades over one to two years. It presents a unique thin-layer, amorphous silicon carbide coating (PROBIO) that reduces interaction between the metal stent and the surrounding tissue and blood by acting as a diffusion barrier aiming to improve the biocompatibility of the material by reducing thrombogenicity and encouraging re-endothelialisation.
Interventional Procedure
The PCI was routinely performed with the standard techniques via femoral or radial approach using 6 or 7 French guiding catheters. Patients not preloaded with oral aspirin and/or clopidogrel received a loading dose of intravenous aspirin (500mg) and clopidogrel (600mg) or prasugrel (60mg) or ticagrelor (180mg) as standard practice in our Catheterization Laboratory. Intravenous heparin (70 UI/Kg body weight) was administered before the procedure with subsequent boluses aiming at achieving an activating clotting time (ACT) between 250 and 300sec. In case of Bivalirudin administration a 0.75 mg/kg bolus dose followed by a 1.75 mg/kg per hour intravenous infusion terminated immediately after the end of the procedure was administered. Manual thrombectomy was performed in all cases and the use of GP IIb/IIIa inhibitors was left to operator’s discretion. All lesions were finally treated with the study device implantation. The deferred PCI of the non culprit lesion was routinely performed with the aforementioned standard
techniques and the Orsiro stent previously deployed at the infarct-related artery (IRA) was analyzed with the Frequency Domain OCT (FD-OCT).
OCT acquisition
Frequency Domain OCT (FD-OCT) acquisitions were performed using the Ilumien system (St Jude, Minneapolis, MN, USA) with a motorized automatic pullback at 20mm/s during contrast injec¬tion at a flow rate sufficient to have full substitution of blood with contrast with no streaming according with international guidelines (3). The OCT catheter was inserted distal to the treated segment and the pullback continued until either the guiding catheter was reached or the maximal pull-back length (54 mm) was completed. Two sequential pull-backs were combined to enable assessment of the entire stented segment when required. OCT was used only during the deferred PCI, none of the stent analysed were implanted under OCT guidance.
OCT analysis
The OCT measurements were performed off-line using the LightLab Imaging workstation (LightLab St Jude, Minneapolis, MN, USA) by two blinded operators unaware of the timing of the stent implanted. Divergent opinions were resolved by consensus. Coverage and apposition of the stent struts were analyzed with strut- and cross section-level. The analysis of contiguous cross-sections was performed at 1 mm intervals within the entire stented segment and on 5mm proximal and distal to the stent in order to identify edge dissections defined as a disruption of the vessel luminal surface at the stent edge with visible flap. Struts were considered suitable for analysis only in the presence of a bright signal-intense structure with perpendicular shadow. Number of struts was determined in each cross section analysed. Thickness of the tissue coverage on the luminal side of each strut was measured at the middle of the long axis of the strut. The inner and outer strut’s contours were delineated for each strut and its distance to the lumen contour was
calculated automatically to determine strut level intimal thickness. Measured tissue thickness > 0 µm was defined as coverage. Coverage and apposition of the stent struts were analysed with strut- and cross section-level (31, 32). Struts were classified as malapposed if protruding into the lumen at a distance greater than the sum of the strut and polymer thickness (71 µm and 91 µm for the 2.25, 2.5 and 3.0 stent diameter and 3.5, 4.0 stent diameter respectively) plus the minimal axial OCT resolution (20 µm).
Each stent strut was classified as:
1) Apposed and covered: strut well apposed to the vessel wall with tissue coverage: 2) Apposed and uncovered: strut apposed to the vessel wall without tissue coverage;
3) Malapposed and covered: strut malapposed to the vessel wall with tissue coverage;
4) Malapposed and uncovered: strut malapposed to the vessel wall without tissue coverage.
Non-analyzable frames were defined as frames in which in which more than 45° of the lumen border was not visualized for the presence of side branches or for inadequate blood clearance during imaging acquisition. In these cases, the next following or preceding frame of appropriate image quality was used for the analysis.
Clinical follow up
In-hospital, 30 days, and cumulative 12 months MACE were defined as death, myocardial infarction and repeat revascularization (CABG or PTCA). Twelve-lead electrocardiograms were recorded before, immediately after each procedure and at hospital discharge.
Continuous variables were expressed as mean + standard deviation, while categorical variables were presented as numbers with percentage. Continuous variables were compared using paired student’s t-test. Categorical variables were compared using chi-square test. A P value > 0.05 was considered statistically significant.
Results
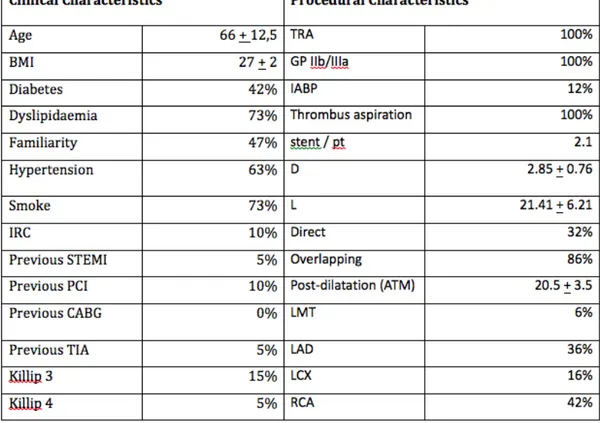
From January 2012 to December 2012 a total of 260 patients underwent to primary PCI in our Institution. 16 of the 95 patients with MVD underwent to OCT evaluation of the study device implanted in the culprit lesion during the second-step staged procedure and were enrolled in the present Registry. Patients and lesion characteristics are shown in table 1.
OCT strut level analysis
OCT strut level findings are shown in table 2. A total of 3060 struts were analyzed. Of these, 1065 struts (Group-I), 874 struts (Group-II) and 1130 struts (Group-III) were analyzed at 30 days, 90 days and 180 days respectively. Stent lengths and diameters were similar in the three groups. The percentage of uncovered stent struts was 19.6% at 30 days, 1.3% at 90 days and 1.8% at 180 days (p< 0.001 Goup-I vs Group-II and vs Group-III; p=ns Group-II vs Group-III). The percentage of malapposed struts was 5.1% at 30 days, 6.2% at 90 days and 4.8% at 180 days (p=ns for all group). Of the malapposed struts 53.7% were covered at 30 days, while 81.5 % and 88.9 % were covered at 90 and 180 days respectively (p<0.01 Group-I vs Group-II and vs Group-III; p=ns Group-II vs Group-III).
OCT cross-section level analysis
OCT cross-section findings are shown in table 3. The percentage of cross section with > 1 uncovered struts were 51.3% at 30 days, 6.5% at 90 days and 5.7% at 180 days (p<0.001 Group-I vs Group-II and vs Group-III; p=ns Group-II vs Group-III). The percentage of cross section containing thrombus was 6.2% at 30 days. No thrombus was detected at both 90 and 180 days analysis. Neointimal thickness covering stent struts increased from 0.25 + 0.21 mm2 at 30 days to 0.81 + 0.68 mm2 and to 0.94 + 0.85 at 90 days and 180 days respectively (p<0.001 Group-I vs Group-II and vs Group-III; p=ns Group II vs Group III).
Clinical Follow Up
No in-hospital, no 30 days and no 12 months MACE (death, myocardial infarction and repeat revascularization CABG or PTCA) were reported.
Discussion
The main finding of this pilot study is that a very high percentage of stent struts (98.7%) presented a fast patter of thin layer coverage at 90 days that remain steady at 180 days follow-up. Interestingly, the homogeneous pattern of tissue coverage was found to be present even in malapposed struts that accounted for about 5% of all analysed struts. Our study population was strictly represented by a STEMI group were the trend of vessel undersizement might explain the relatively high percentage of malapposed struts found at OCT follow up. The low percentage of cross-sections containing thrombus might be related both to the ability of the PROBIO system in reducing thrombogenicity and to the high frequency of thrombectomy and GP IIb/IIIa inhibitors administration used in the current study. The almost complete homogeneous tissue coverage around stent struts found already at 90 days was somehow unexpected in a stent that elutes sirolimus, the mainly appointed drug in the pathogenesis of long-term incomplete strut coverage causing late and very late stent thrombosis.
In fact, delayed healing and poor endothelialisation were common findings in pathologic specimens of vessels treated with SES (26, 27, 33) and pathology studies demonstrated that the best predictor of late stent thrombosis was the ratio of uncovered/total stent struts (25). This complication especially affects the first generation DES, in which the mechanism for incomplete neointimal coverage seems to go beyond the antiproliferative potency of the drug and also involve a type IVb hypersensivity reaction (34). Hypersensivity is likely triggered by the polymer rather than by other components of the devices and several randomized
trials, all comers registry and metanalysis have shown a different pattern of struts endothelialisation between durable and biodegradable eluting stents (35). In a recently published metanalysis comparing durable versus biodegradable polymer DES and including more than 20.000 patients, our group found a significant reduction of late lumen loss and late stent thrombosis in biodegradable polymer DES but without significant benefits on harder end-points such as mortality, myocardial infarction or revascularization rates. Additionally, in the same study, a prespecified meta-regression highlighted the influence of stent strut thickness on target lesion revascularization and late stent thrombosis. It must be noted that the study device presents one of the lower strut thickness of the commercially available DES. The long term safety and efficacy of the study device has been tested in a randomized trail comparing Orsiro (Biotronik AG, Bulach, Switzerland) vs Xience (Abbot, Abbott Park, Illinois, USA). The results showed a non-inferiority of the Orsiro stent in term of late lumen loss, target lesion failure and cardiac death both at 9 months and 2 years follow up. However, EES-CoCr stents presents an almost unique evidence of improved safety profile. In fact, in a recently published metanalysis of 11 randomized trials, Palmerini et al. found a significant reduction of EES compared with other DES in the relative risk of early, late and very late stent thrombosis (36). Moreover, in another study, the same group also found that CoCr-EES presents the lowest rate of stent thrombosis within 2 years of implantation even when compared with BMS (37). Despite these findings, the international guidelines still sees the 12 months - dual antiplatelet therapy as the gold standard in DES treated patients irrespective of the type of polymer or drug eluted. One of the key finding potentially able to shorten the 12-month long antiplatelet therapy might be the in-vivo detection of the ratio of uncovered/total stent struts, probably the best predictor of late stent thrombosis. However, unlike conventional stents that develop circumferential coverage with an average
thickness of 500 µm or more, which are well-visualized with IVUS and angiography (1-mm late loss), DES delay and prevent the hyperplastic response so that the average late lumen loss for sirolimus or paclitaxel-eluting stents can be lower than 100 µm. Therefore, the amount of intimal thickening will not be detectable with IVUS because of its limited axial resolution and the presence of artifacts around struts. Angioscopy has been successfully used to compare neointimal coverage pattern and incidence of stent thrombosis, but its use is limited in daily clinical practice (38). The use of intravascular optical coherence tomography (OCT), an imaging technique that employs near-infrared light and provides cross-sectional images with an axial resolution of 10 µm, has provided new opportunities to perform a more refined analysis of vessel response to endovascular devices. OCT offers a unique combination of minimally invasive surface scanning technology and in-vivo images of biological samples at a resolution 10–30 times higher than conventional intravascular ultrasound (IVUS). In fact several experimental and clinical studies demonstrated the high correlation between OCT and histological measurements of neointimal coverage of stent struts, highlighting the superiority of OCT over IVUS for in-vivo detection of stent tissue coverage at follow-up. The introduction of user friendly second generation OCT probes based on frequency domain analysis, due to its fast-scanning laser system, allows multiple acquisition of the entire segment of interest without the need of prolonged crystalloid infusion but only with a small amount of contrast slightly greater than the one required for control angiogram. Using OCT we were able to evaluate the time related changes in strut tissue coverage and thrombus formation among in our study population treated with a “third” generation sirolimus eluting stent.
Limitations
The major limitation of this pilot study is the small size of the study population, justified by the rarity of STEMI patients with multivessel disease were the non-culprit lesion can be treated in an elective PCI deferred to a long term period raging from 30 to 180 days. Moreover, the OCT was employed only during the second step procedure and none of the study device was implanted under OCT guidance.
2.1.4 Study 4
Title: ABSORB biodegradable stents versus second-generation metal stents: a comparison study of 100 complex lesions treated under OCT guidance.
Background
Thick polymer-based bioresorbable vascular scaffold (BVS) have different mechanical properties than thin second generation drug eluting stent (DES). Data on acute performance of BVS are limited to simple coronary lesions treated in trials with strict inclusion criteria.
Aim
The aim of this study was to compare the acute performance of BVS versus second generation DES in the treatment of complex coronary artery lesions using Optical Coherence Tomography (OCT) to assess appropriate stent deployment.
Materials and Methods
Study population.
The study population comprised of consecutive patients undergoing PCI of complex coronary lesions with stent optimization under OCT guidance, which is our routine for complex lesion stenting (39). From September 2012 till May 2013 patients treated with BVS at the Royal Brompton Hospital (London, United Kingdom) and Columbus Hospital (Milan, Italy) were prospectively enrolled. Out of 148 patients with complex lesions treated with second generation DES at the Royal Brompton Hospital between January 2009 and May 2013 and optimised using post-deployment OCT examination (DES-group) we selected an equal number of lesions with matched angiographic characteristics to those in the BVS-group. The 1:1 selection without replacement has been performed accordingly to
the following stepwise selection criteria: lesion length, vessel reference diameter, ostial position, bifurcation involvement, severe or moderate calcifications, chronic total occlusion.
All patients signed an informed consent for stent deployment and OCT guidance. The devices used in the DES-group were the Everolimus eluting Xience Pro and Prime (Abbott Vascular,Santa Clara,CA), Promus Element and Premiere stent (Boston Scientific,Natick,Massachusetts) and the Zotarolimus eluting Resolute Integrity stent (Medtronic Vascular,Santa Rosa,CA). BVS were not used in patients presenting with acute ST-segment elevation myocardial infarction, coronary bifurcations with a default two stent strategy, target lesion in a vessel with a reference diameter <2.5mm and, because of impossibility to perform serial OCT examinations, e-GFR<30ml/min, or aorto-ostial lesions. The main inclusion criteria in the BVS group used to define the lesion complexity were length>24mm, moderate to heavy calcification, ostial (different from aorto-ostial), bifurcation involvement and chronic total occlusion (CTO).
QCA analysis and lesion characterisation
QCA was performed using a computer-based QCA system (CAAS QCA -2D system, Pie Medical Imaging BV, the Netherlands) with the dye-filled catheter used for calibration (40). For each lesion the following QCA parameters were measured: Minimum Lumen Diameter (MLD), Reference Vessel Diameter (RVD), percentage Area Stenosis (%AS) and Lesion obstruction Length (LL). The largest balloon diameter and maximal inflation pressure during lesion predilatation were recorded and used to calculate the balloon/artery ratio (mean inflated balloon diameter/mean reference vessel diameter). In addition, we assessed the presence of angiographic calcification.
In both groups, lesions were treated with pre-dilatation using conventional semi-compliant or NC balloons. The use of additional devices, cutting balloons or rotablator, was left at the operator’s discretion. Unlike for DES, deployment of BVS was performed using slow balloon inflation (i.e. 2 atm per 10s) without exceeding the rated pressure indicated in the product instructions for use. Post-dilatation with short NC balloons was systematically performed both for BVS and DES, using OPN NC balloons (SIS Medical AG, Winterthur Switzerland) when pressures higher than 30 Atm were required (41). Attention was paid to avoid reaching a maximal balloon diameter beyond the recommended rupture point of the BVS, by strictly following the NC balloon compliance chart. In case of lesions involving a bifurcation, final optimization with sequential dilatation was preferentially adopted for BVS. Conversely, for DES final kissing balloon was the default strategy. OCT assessment was performed in most cases before stent deployment and repeated when stent expansion was considered optimal angiographically. In the event of suboptimal deployment as assessed with OCT, further post dilatation was performed or additional BVS/DES were implanted, after which a final OCT acquisition was performed and used for the study analysis. OCT acquisition.
Frequency domain-OCT was performed using the C7 system or the Ilumien Optis system (St Jude, Minneapolis, MN, USA). For both systems, DragonFly or DragonFly-2 imaging catheters were used. Automatic pullbacks were performed at 20mm/s during contrast injection at a rate of 3-5ml/s using a power injector. The OCT catheter was inserted distal to the treated segment and the pullback continued until either the guiding catheter was reached or the maximal pull-back length (5.5 cm with C7 and 7.4 cm with Ilumien Optis) was completed. Two sequential pull-backs were combined to enable assessment of the entire stented segment when required.
OCT off line analysis.
The OCT measurements were repeated off-line using the LightLab Imaging workstation (St Jude, Minneapolis,MN,USA). The analysis of contiguous cross-sections was performed at 1mm intervals within the entire stented segment and on 5mm proximal and distal to the stent in order to measure the proximal and distal Reference Vessel Area (RVA) and to identify dissections. RVA was calculated as the mean of the two largest luminal areas in the 5mm proximal and distal to the DES/BVS edge (3). In case of absence of a meaningful proximal or distal segment due to the ostial location of the lesion or the presence of a large side branch at the stent edge, only a proximal or distal reference cross-section was used to calculate RVA (42). Stent edge dissection was defined as a disruption of the vessel luminal surface at the stent edge with visible flap. Stent fracture was suspected in the presence of isolated struts lying unapposed in the lumen with no connection or overridden by the contiguous stent struts. For each cross section analysed, the area, mean, maximal and minimal diameter of the stent were automatically contoured and measured by the analysis system, with manual correction as appropriate (43). For analysis of BVS, which are transparent to the near infrared light of the OCT catheter, ISA was defined as presence of struts separated from the underlying vessel wall (44). For metallic DES, inducing a posterior drop-out, struts were considered malapposed when the axial distance between the strut’s surface to the luminal surface was greater than the strut thickness. Tissue prolapse was defined as the presence of tissue protruding between stent struts extending into the lumen as a circular arc connecting adjacent struts.
The following quantitative parameters were calculated for each stent (3):
- Percentage of ISA: calculated as a ratio of the total number of struts observed at 1 mm intervals.
- Percentage of stents with ISA at the proximal and distal edges defined as the last 5mm of stent before the stent end.
- ISA area, mm2 (only for BVS) measured as illustrated in Figure 1 .
- Tissue prolapse area (mm2); calculated as the difference between the stent area and the lumen area as illustrated in Figure 1.
- Percentage of RAS calculated as (1-[min lumen area/RVA])x100 as illustrated in Figure 2.
- Eccentricity index: ratio between the minimal and the maximal diameter. For each stent both the mean and minimal eccentricity index were computed (illustrated in Figure 2).
- Symmetry index: defined as (maximum stent diameter–minimum stent diameter)/(maximum stent diameter).
Figure 1: Qualitative and quantitative assessment of OCT characteristics
A) Example of incomplete strut apposition. There are 4 malapposed struts between 10 and 12 o’clock in A1, with one more malapposed strut probably concealed by the wire shadow (asterix). In BVS the possibility to identify the abluminal border of the struts allow the evaluation of ISA area as indicated in green in panel A2. B) Tissue prolapse. In the presence of tissue prolapse, defined as tissue protruding between the struts, prolapse area was measured as the difference between the stent and lumen area (highlighted in green in Panel B2). C) Example of edge dissection (arrow) distally to the BVS. Because of the large lumen size and small circumferential extension of dissection no treatment was performed. D) BVS strut fracture. This cross section at the level of the LAD-D1 carina, shows a scaffold pattern irregularity with an overhanging strut (arrow) in the centre of the vessel without obvious connection to the expected/adjacent strut pattern. In this patient before this final OCT acquisition the BVS was rewired in order to dilate the ostium of D1 with a 2.5 mm semicompliant balloon.
Figure 2: Residual Area Stenosis and Eccentricity Index
The proximal and distal vessel reference area (Panel A and D) were used to calculate the reference vessel area (RVA). The ratio between minimal lumen area (MLA) and RVA was used to compute the residual area stenosis (Panel C). In Panel B is reported an example of evaluation of the minimum eccentricity index.
Follow-Up
Clinical follow up was obtained approximately at 1 month after the procedure and every 6 months afterward by direct clinical examination.
Statistical analysis
Descriptive statistics (means and standard deviations for continuous variables with normal distribution, frequency and relative frequency for categorical variables) were computed according to treatment type (BVS vs DES). Comparison between groups for continuous variables was performed by unpaired T-test (in case of parametric distribution) or Mann-Whitney U-test (in case of non-parametric distribution), as appropriate. Univariate associations between treatment type and coronary lesion features were examined using two-way contingency tables. Significance of associations were assessed using the Chi-squared test or the Fisher exact test, as appropriate. For all the statistical tests used, a p level of <0.05 was required to reject the null hypothesis. The statistical analysis was performed using the SPSS statistical software package v 16.0 (IBM Corporation, Somers, NY).
Results
Population
Fifty lesions treated with 63 BVS in 35 patients were matched with 50 lesions treated with 61 second generation DES in 38 patients. Baseline patients’ clinical characteristics are shown in Table 1. There were no significant differences in the two groups with a minority of patients (4.1%) presenting with unstable angina as an indication for the PCI procedure.
Table 1: Patients characteristics (n=73)
Angiographic and QCA baseline lesion characteristics are summarized in Table 2. The left anterior descending (LAD) was the target vessel in a large proportion of cases in both groups (BVS n=34, 68%, DES n=25, 50%; p=0.11). As expected, based on the inclusion criteria, all lesions met the American College of Cardiology/American Heart Association classification criteria for B2 or C lesions. There were no significant differences in presence of calcification, ostial involvement and bifurcation involvement. Reference vessel diameter, minimal lumen diameter and lesion length, as assessed with QCA were also similar (lesion length: BVS 24.7±14.2mm, DES 25.1 ± 10.6mm; p=0.86). Two CTO were successfully treated in the BVS-group and 4 in the DES-group.
Table 2: Angiographic and QCA lesions characteristics (n=100)
Procedural characteristics
Sixty-three BVS and 61 DES were implanted with a similar number of stent per lesion in the two groups (BVS 1.3±0.6, DES 1.2±0.5; p=0.28).
Xience Prime was the most frequently used DES (n=35, 57.4%), while Promus Element or Premiere and Resolute Integrity were used in 16 (26.2%) and 10
(16.4%) of cases, respectively. The mean stent length was 28.0mm [20.5-28.0] in the BVS-group and 28.0 [20.0-38.0] in the DES-group (p=0.42). As shown in Table 3, a higher balloon diameter/mean reference vessel diameter ratio was used for predilatation in the BVS group (BVS 1.1±0.1, DES 0.9±0.1; p<0.01) with significantly higher pressure inflation for both pre and post-dilatation. NC balloons were more frequently used for lesion preparation in the BVS group. Sequential dilatation was the only technique used for bifurcation optimization in BVS group while kissing balloon was consistently used in the DES group.
Optical coherence tomography findings
OCT findings are summarized in Table 4. A total of 2,953 cross-sections and 24,352 struts were analyzed. Mean and minimal lumen area were similar in the two groups. The incidence of RAS>20% was not statistically significant different in the BVS (BVS: n=25, 39.7%, DES: n=26, 42.6%; p=0.85) and there was no difference in the mean RAS (BVS 20.2±7.5, DES 21.7%±9.9; p=0.32). There was a higher incidence of ISA at the proximal edge in the BVS group (BVS n=25, 39.7%, DES n=14, 23.0%;p=0.04) but no difference in the overall percentage of ISA (BVS 1.7%±2.1, DES 1.9%±2.4; p=0.62) and number of stents with ISA (BVS n=33, 52.4%, DES n=39, 63.9%; p=0.19) (see Figure 3).
Figure 3: Histograms show a similar mean and minimal in stent lumen area (A), percentage of residual area stenosis and stent with residual area stenosis > 20% (B), overall percentage of malapposed struts (C). A higher incidence of proximal strut malapposition at the proximal edge was observed in BVS (D).
The mean and minimum eccentricity index and the symmetry index were similar in the two groups.
In the BVS group, there was a trend toward a higher prolapse area (BVS 1.5±2.4mm2, DES 0.8±1.2mm2; p=0.08) but this did not significantly impact on the final lumen area, which was similar in both groups. OCT analysis showed 12 edge dissections (BVS n=5, 7.9%, DES n=7, 11.5%; p=0.55) which were not apparent on the angiogram. None of these required further stent implantation. In the DES group, strut fractures were not observed while in two patients in the BVS group two stent fractures developed. In both cases the lesions were localized in the LAD across the origin of a diagonal branch and the scaffolds were recrossed in order optimize the result with sequential dilatation .