Dipartimento di Biotecnologie, Chimica e Farmacia
Dottorato in Scienze Chimiche e Farmaceutiche
XXXIII Ciclo
Coordinatore: Prof. Maurizio Taddei
Design and development of new organic molecules as
alternative fluorophores for LSC application
Settore scientifico disciplinare: Fotovoltaico
Candidato/a
Costanza Papucci
Università di Siena - CNR-ICCOM Firenze Tutore
Maurizio Taddei Università di Siena
Dipartimento di Biotecnologie, Chimica e Farmacia
1
S
OMMARIO
1 THE ENERGY ISSUE ... 7
1.1 THE ENERGY OF SUN ... 11
1.2 PHOTOVOLTAICS: FROM SUN TO ELECTRICITY ... 12
1.2.1 First generation: Silicon solar cell ... 13
1.2.2 Second generation: Thin-film solar cell... 14
1.2.3 Third generation: A bridge through the PV generation cells ... 15
1.3 LUMINESCENT SOLAR CONCENTRATORS ... 19
1.3.1 LSC: historical development ... 21
1.3.2 Concentrator idea: LSC mechanism ... 22
1.3.3 Optical efficiency: definition ... 23
1.4 LSC COMPONENTS ... 29
1.4.1 Host material ... 29
1.4.2 Luminophore ... 31
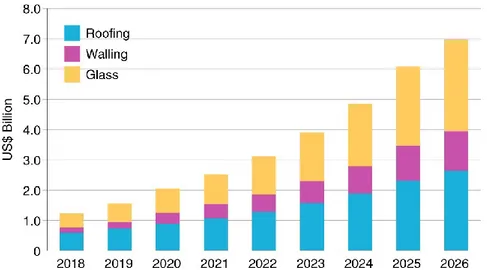
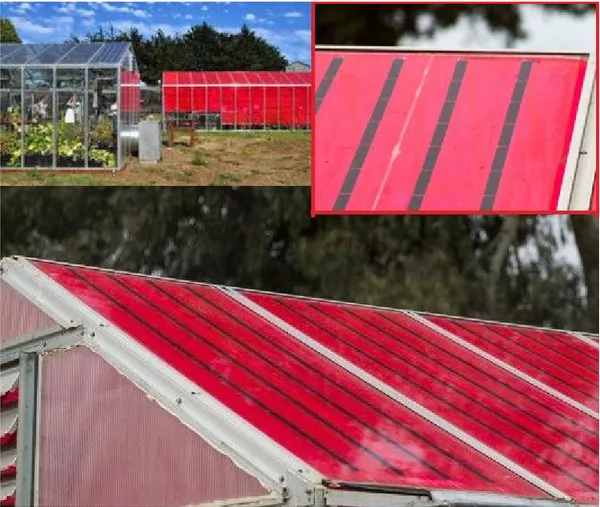
1.5 APPLICATIONS ... 35
1.5.1 BIPVs ... 35
2 ORGANIC FLUOROPHORES: STATE OF ART ... 42
2.1.1 FLUOROPHORES WITH ABSORPTION IN THE VISIBLE LIGHT ... 42
2.1.2 FLUOROPHORES WITH ABSORPTION IN UV REGION ... 49
2.1.3 FLUOROPHORES WITH ABSORPTION NIR REGION ... 52
2.2 AIM OF WORK ... 56
3 BENZO[1,2-d:4,5-d’]BISTHIAZOLES ... 63
3.1 BBT1: THE STARTING POINT ... 63
3.2 ALTERNATIVE SYMMETRICAL AND ASYMMETRICAL BBT: BBT1a/1b ... 70
3.3 EFFECT OF DONOR GROUP (BBT2-4) ... 72
3.3.1 SYNTHESIS AND OPTIMIZATION ... 74
3.3.2 SPECTROSCOPICAL AND OPTOELECTRONIC CHARACTERIZATION ... 76
4 QUINOXALINE DERIVATIVES ... 99
4.1 SYNTHETIC APPROACH ... 101
4.2 SPECTROSCOPIC CHARACTERIZATION ... 104
4.2.1 Spectroscopic characterization in solution ... 104
4.2.2 Spectroscopic analysis in polymer matrix ... 107
2
4.2.4 Transient absorption spectroscopy ... 118
4.3 Experimental procedure: Chapter 4 ... 125
5 A GREEN WORLD: THE CHALLENGE OF ALGAE ... 131
5.1 LSC FOR ALGAE (LSCA): π-D-A-D-π MOLECULES ... 132
5.2 π-D-A-D-π LSC DYES: DESIGN AND SYNTHESIS ... 135
5.3 SPECTROSCOPIC CHARACTERIZATION IN SOLUTION... 140
5.4 Experimental procedure: Chapter 5 ... 145
6 GREEN CHEMISTRY ... 150
6.1 GREEN SOLVENTS IN ORGANIC SYNTHESIS ... 152
6.1.1 Deep eutectic solvents (DESs) ... 152
6.1.2 DES in organic reactions: state of art ... 155
6.2 MIYAURA REACTION in DES ... 160
6.3 DIRECT C-H ARYLATION: PRELIMINARY STUDY IN GREEN SOLVENTS ... 166
6.4 Experimental procedure: Chapter 6 ... 169
7 CONCLUSIONS ... 172
8 GENERAL EXPERIMENTAL REMARKS ... 175
4
Abstract
Presently, Luminescent Solar Concentrators (LSCs) are considered promising alternative optical devices for the sunlight harvest and production of energy. A LSC is composed by a thin transparent polymer slab, doped with a fluorophore able to absorb solar radiation and concentrate it, at a specific wavelength, at the edges of the slab, where a thin PV cell can capture and use to produce electricity. Due to the low-priced materials and their innovative aesthetic properties, LSCs find an easy integration in architectural systems, such as roofs, windows, canopies and greenhouse. The heart of LSC device remains fluorophore, which needs to follow several optoelectronic properties: broad absorption range, long-wavelength emission maximum, large Stokes shift, high fluorescence quantum yield, low-priced materials and production, good optical efficiency and good dispersion in the host materials. The organic molecules are more versatile class of luminophores, which can largely satisfy LSC requirements, due to their close relationship between molecular design and optoelectronic tunability.
During this Ph.D., keeping in mind all these targets, a careful and specific molecular design supported by computational analysis have been accomplished. Three classes of new organic fluorophores characterized by D-A-D structure have been planned and executed. The synthetic optimization and the employment of sustainable procedures have been carried out when possible, favoring cross-coupling reactions and more eco-friendly approaches. All organic chromophores have spectroscopically characterized in solution and polymer dispersion, designing a common prototype of LSC device for all chromophores. Alternative matrices have been tested to evaluate their impact on optoelectronic properties of the various fluorophores. LSC performances of each chromophore have been assessed and compared with those of literature reference Lumogen F Red 305 (LR305).
5
Riassunto
Oggigiorno, i Concentratori Solari Luminescenti (LSCs) sono considerati degli alternativi e promettenti dispositivi fotovoltaici. Un LSC è costituito da una sottile lastra polimerica trasparente, drogata con un fluoroforo, ad una specifica concentrazione, in grado di assorbire la radiazione solare e concentrarla, ad una specifica lunghezza d'onda, sui bordi della lastra. Qui, uno strato sottile di cella fotovoltaica a base, generalmente di silicio, cattura la radiazione emessa e la impiega per produrre energia elettrica. Grazie all’utilizzo di materiali a basso costo e alle loro proprietà estetiche innovative, gli LSC possono essere impiegati come dispositivi integrabili in sistemi architettonici quali tetti, finestre, serre, pensiline o barriere stradali.
Il fulcro di un dispositivo LSC è il fluoroforo. Questo deve rispondere a specifiche caratteristiche sia chimiche che ottiche, quali ampio intervallo di assorbimento e di emissione di fluorescenza, ampio Stokes shift, elevate rese quantiche di fluorescenza, un processo di produzione a basso costo e una buona dispersione e compatibilità con la matrice polimerica. In questo contesto, le molecole organiche risultano essere una delle classi di cromofori più versatili, in quanto possono soddisfare questi requisiti, grazie alla possibilità di modificarne le proprietà tramite un opportuno design molecolare.
Durante questo progetto di dottorato, sono stati realizzati vari specifici design molecolari, tramite uno studio preliminare basato su analisi computazionali. Sono state progettate e preparate tre differenti classi di nuovi cromofori organici caratterizzati da una struttura D-A-D. L’ottimizzazione sintetica e l’impiego di procedure sostenibili sono state utilizzate quando possibile, favorendo reazioni di accoppiamento C-C (cross coupling) e approcci più eco-compatibili. Tutti i composti organici sono stati caratterizzati spettroscopicamente in soluzione e in matrici polimeriche, attraverso la caratterizzazione di un tipico prototipo di dispositivo LSC (5x5 cm2), per ogni fluoroforo.
Sono inoltre state testate matrici alternative, valutandone l’impatto che avevano sulle proprietà optoelettroniche dei vari cromofori. Le prestazioni dei singoli composti organici sono state valutate e confrontate con quelle di riferimento in letteratura, Lumogen F Red 305 (LR305).
6
CHAPTER 1:
INTRODUCTION
7
1 THE
ENERGY
ISSUE
Each generation is called to face new challenges and opportunities. However, in a closed system like Earth, some opportunities discovered and developed by a generation could imply important challenges for the followed ones.
An important challenge for the 20th century generation was to satisfy energy demand in the world.
In this scenario, population growth plays a crucial role as it strongly impacts on socio-economic processes, spatial distribution and policy implications.
In the last sixty years, the growth of the world’s population was increased from 2.5 billion of people in 1950 to 7 billion in 2015, with a global population growth of 1.24% per year, in the last ten years. The estimations of the world’s population developments, show a slight increase in people more than one billion in the next ten years, reaching 8.3 billion in 2030 and 9.8 billion in 20501.
The increase in the global population rate and the higher life expectancy leads to a huge increase in energy demand. Energy is embedded in all types of goods and is at the base of any kind of service, required by people’s needs. All basic human necessities, such as food and water supply, environment requirements, urbanization, health, are strictly dependent on energy availability2.
On the other side, while energy demand increases with economical and social requirements, energy distribution affects several aspects of life worldwide, such as disparities among states, generated by the unfair distribution of energy sources, with consequent enhances inequities (about half of the primary energy supply is consumed by the 10% of the population, living in wealthy countries, while the poorest 25% of mankind consumes less than 3%)3 .
The energy demand is closely correlated to the availability of natural capital. The amount of natural reserves, produced by Earth (oxygen, water, etc.), determines human’s quality of life and economy.
In a sustainable and close system, like our planet, the consumption of natural capital over one year should not overcome the produced one in the same timescale.
Unfortunately, this is not the case. Since 1976, resources produced by Earth in the whole year have been consumed in less time than one year. It’s possible to calculate the day within the year when one annual natural capital was consumed. Such day is called Overshooting Day.
1 United Nations, Department of Economic and Social Affairs, Population Division (2017). World Population Prospects: The 2017 Revision, Key Findings and Advance Tables. Working Paper No. ESA/P/WP/248. 2 N. Armaroli, V. Balzani, Angew. Chem. Int. Ed., 2007, 46, 52-66.
8
Fig. 1: The Overshooting Day trend from 1970 to 20204.
For 2020, the Overshooting Day was the 22nd of August; that means that in 2020, the human being consumes 1.6 Earth (Fig.1).
Even if part of the natural capital can be regenerated by direct or indirect action of sunlight on the biosphere, the Earth’s regenerative capacity has not been sufficient to balance the depletion of the natural capital, accumulated over the past year. In 1961, the humanity requirements covered 70% of the capital; in the ’80s was 100% and in 1999 was 120%5. That means we are now living at the edge of our planet’s possibilities. In the last 50 years, other than consuming all annual production of the natural capital, the resources that Earth has stored during the last centuries have already been depleted. Furthermore, some resources such as metals and fossil fuels cannot be regenerated according to the human timescale.
The main energy source of the 20th century was fossil fuels. Nowadays, they represent 80% of the global energy supply. However, their progressive exploitation had left mankind with a loss of energy resources and harmful effects to the Earth’s atmosphere such as pollution, global warming and increasing of the greenhouse effect. Furthermore, their costs increased depending on social, political and economical choices of countries, indirectly contributing to disparities and inequities in human society6.
For example, the top three oil consumers in the world of 2016 were United States (20%), China (13%) and India (3%); among them, only United States was the major oil producer. Those three countries together consumed more than the third of the world’s consumptions.
The Energy Information Administration (EIA) estimated the world oil consumption, in 2016, 96.92 million barrels per day: 60% of this consumption was due to the first ten consumers of oil, which not corresponded to the ten world producers (Fig. 2).
4 https://www.overshootday.org/
5 Mathis Wackernagel, Niels B Schulz, Diana Deumling, Alejandro Callejas Linares, Martin Jenkins, Valerie Kapos, Chad Monfreda, Jonathan Loh, Norman Myers, Richard Norgaard, Jørgen Randers, Proc. Natl. Acad. Sci. USA, 2002, 99, 9266-71.
9
Fig 2: World oil reserves (on the left) and world oil consumers (on the right) relative to 20187.
In 2019, World’s demand amounted to 1.1 million oil barrels per day, 3987 Bcm of natural gas and 5437 Mtce of coal8.
However, there are alternative energy sources that can become successful when they will reach competitive prices compared with fossil fuels: the real challenge of the 21st century is to face an energy transition by the exploitation of renewable alternative resources.
Renewable energies (REs) such as biomass, hydropower, wind, bio-heat and solar energy are the alternative, since they are inexhaustible (in terms of human timescale) and their environmental impact is lower than that, due to fossil sources. Currently, the contribution of REs to the global energy demand is 26.5%, where the hydropower provides 16.4%9. On the other hand, the energy demand will rise by 37% in 2040 and the electricity consumption in the world will increase by 80%10 (for forecasts for 2050, see figure 3).
Fig. 3: Forecasts of REs employment in 2050,in total final energy consumption terms11.
7 a) https://oilprice.com/Energy/Crude-Oil/How-Much-Crude-Oil-Has-The-World-Really-Consumed.html; b) World Oil and Gas Review 2019
8 https://IEA.org/reports.
9 Hydropower Status Report, International hydropower association (2018), 5th ed2018. 10 MS Javed, T Ma, J Jurasz, MY Amin, Renewable Energy, 2020, 148, 176-192.
11 Dolf Gielen, Francisco Boshell, Deger Saygin, Morgan D.Bazilian, Nicholas Wagner, Ricardo Gorini, Energy Strategy Reviews, 2019, 24, 38–50.
10
Hydropower, solar and wind are the most abundant REs and the technologies for their exploitation are the most developed and economically viable.
Hydropower covered around 70% of such sources12, providing reliable energy generation and opportunities for economic development13 . However, the scale and type of hydropower projects, as well as the social, economic and environmental impacts of its plants,14 can be a limitation for future employment as it may disrupt natural flowing water and harm ecosystem balance15.
The second and third renewable sources employed for energy production are wind and solar power, in particular for electrical energy supply.
Wind power supply covered 4% of global electricity production in 2016. In 2018, the global installed wind capacity was 591 GW for total installed wind power; in 2019, this value increased by 1.17% in one year, reaching 651 GW16. It is expected that in 2050, the wind power supply will be strongly increased17.
Solar energy reaches Earth in different forms, two of them are light and heat which can be employed in heating processes and production of electricity. The availability of solar energy is inexhaustible for the human timescale. Solar photovoltaic (PV) is the state of the art in active solar electricity generation. PV share in global electricity generation was almost 3% in 2019, with 720 TWh produced and is estimated to increase from 720 TWh in 2019 to almost 3300 TWh in 203018. The PV capacity factor increased from 20% in 2010 to 24% in 201919.
Despite from 2015 to now the installed capacity of wind power has been higher than PV, it is expected that PV installed capacity will soon overtake the wind one20. Indeed, the PV market increased to around 115 GW installed solar power in 2019, compared to 100 GW in 2018, with an improvement of 1.15% in only one year (Fig. 4).
12 International Energy Agency, Tracking clean energy progress, (2017),
https://www.iea.org/publications/freepublications/publication/TrackingCleanEnergyProgress2017.pdf. 13 ShouYi Li, XingBo Zhou, YuJie Wang, JianPing Zhou, XiaoHu Du, ZuYu Che, Sci. China Technol. Sci.,2015, 58, 1263-71.
14 International Energy AgencyTechnology roadmap: hydropower, (2012),
https://www.iea.org/publications/freepublications/publication/2012_Hydropower_Roadmap.pdf. 15 Maria Snoussi, Johnson Kitheka, Yohanna Shaghude, Alioune Kane, Russell, Arthurton, Martin Le Tissier, Hassan Virji, Environ. Manag., 2007, 39, 587-600.
16 REN21, Renewable 2019 Global Status Report 2019, 2019.
17 IRENA (2019), Future of wind: Deployment, investment, technology, grid integration and socio-economic aspects (A Global Energy Transformation paper), International Renewable Energy Agency, Abu Dhabi. 18 International Energy Agency (IEA), https://www.iea.org/reports/solar-pv.
19 Energy Information Administration (EIA), https://www.eia.gov/electricity/monthly. 20 REN21, Renewables 2018 Global Status Report. 2018, 2018.
11
Fig.4: Solar PV Global Capacity and Annual Additions 2009-2019 (on the left) and solar PV Global Capacity by
countries 2009-2019 (on the right)16.
In 2019, in most countries, the support schemes to PV, adequate regulatory frameworks and political choices on-grid connections have been necessary to make competitive large-scale systems. At the same time, competition drove declining prices and opening new markets; the pressure of lower prices and expectations of rising global demand encouraged the entry of new companies into the sector and the ongoing pursuit of innovation21.
1.1 THE
ENERGY
OF
SUN
An inexhaustible source of energy comes from the Sun. Comparing to the other renewable sources, solar energy is far larger, being estimated at ∼ 15.2×10⁵ TWh22, namely 3.8 × 10²³ kW of energy every hour, and 170,000 TW of tat strike Earth every moment.
Fig. 5: Solar energy from Sun and the world energy distribution of all resources.
The huge amount of energy from the Sun could widely cover the power demand of the world, every hour, Earth’s surface receives 1.08 x 10¹⁴ kW, more energy than that demanded by
21 REN21, Renewables 2019 Global Status Report. 2019, 2019. 22 R. Perez, M. Perez, n.d., DOI 10.1016/j.eneco.2008.12.011.
12
humans in a year (about 16 TW per year) (Fig. 5). If 0.1% of this energy would be converted at an efficiency of 10%, it would produce four times the world’s generating capacity of 3000 GW23.
1.2 PHOTOVOLTAICS:
FROM
SUN
TO
ELECTRICITY
Sunlight can be employed for the production of electricity, through the harvesting of solar radiation. The conversion of sunlight into electricity can be achieved indirectly, using concentrated solar power (CSP), or directly, through photovoltaics (PVs).
The first one is based on the concentration of sunlight to solar towers, thanks to the employment of collectors. Light concentrated can be involved to produce high-temperature fluids, which generate electricity through a large-scale turbines system. CSP is a cheap method for electricity production; however, its economic operation conditions are strictly dependent on the wide sunbelt extended between the 35th northern and 35th southern latitude24. Thus, the major part of wealthy countries are ruled out and its market diffusion is not supported by them. The most promising devices, which harness solar power appear to be the photovoltaic devices (PV). In this case, sunlight is directly transformed into electricity.
The story of PV devices begins in 1839 when the French physicist A.-E. Becquerel, while he was working on metal electrodes in an electrolyte solution, noticed small electrical current production as a result of their light exposure. In 1940, R. Shoemarker Ohl, investigating some silicon samples with some cracks, noticed a current flow through that material after light exposition that was the first p-n junction. Thirty years later, in 1954, a group of scientists, working on silicon with some impurities of gallium, produced the first silicon solar cell25. This solar cell showed 6% of the efficiency of conversion of sunlight to electricity. However, the first device was expensive and was unsuccessful. From that day, the interest in silicon-based solar cells grow up leading to the drop in costs and the improvement of new technologies and advanced materials that have made possible to reach around 29% of efficiency26: the photovoltaic industry was born.
To produce electricity, a PV cell requires three basic conditions:
the capability of absorbing light, with the generation of electron-hole pairs; the separation of charge of opposite types;
the extraction of charge and carry to an external circuit.
Due to these requirements, three classes of PV were developed and employed in the last decades for the production of electricity, named as PV generations27.
23 M. Thirugnanasambandam, S.Iniyan, R. Goic, Renewable and Sustainable Energy Reviews, 2010, 14, 312–322. 24 Fundamental Study of Cross Linear Concentration System and Solar Power System in Tokyo Tech, 2017. 25 APS News, 2009, 18,4.
26 Andrew Blakers, Ngwe Zin, Keith R. McIntosh, Kean Fong, Energy Procedia, 2013, 33, 1 – 10. 27 American Journal of Optics and Photonics, 2015, 3(5), 94-113.
13
1.2.1 First generation: Silicon solar cell
Silicon solar cells have remained the dominant commercial material for solar energy devices in the last twenty years. Their efficiencies turn around 22-23% for monocrystalline silicon solar cells to 18-19% for polycrystalline one, with a consistent lifetime of 30 years28 (Fig. 6).
Fig. 6: Silicon-based PV module of first-generation: monocrystalline module (on left) and polycrystalline panels (on
right)29.
Mono and polycrystalline cells are based on silicon wafers. The first ones are formed on silicon crystal in a homogenous structure, with a thickness of 0.3 mm; the second is based on many small silicon grains. These wafers of 200-300 μm of thickness are obtained from doping Silicon with 0.1% atom of group III (B or Al for positive junction, p-type junction), as acceptor element, or of group V (P or As for negative junction, n-type junction), as donor one.
Usually, silicon wafers are p-type doped; therefore, a doped n-type surface is employed on the front side of the wafers. That generates a p-n junction system. When light impacts the p-n junction, photons with equal or higher energy than semiconductor one involves the excitation of an electron from the valence band to the conduction one. Charge separation is generated and a hole, formed from the excitation of electrons, move on the valence band.
The condition to create a photovoltaic phenomenon is to separate these pairs of charges, before their recombination. To avoid the recombination process, an internal electric field is required. A strong electric field exists in p-n junction due to spatial cargo. Due to the generation of electron-hole pairs, the negative charges (electrons) move from p-type to n-type conductor and the positive ones (holes) from n-type conductor to p-type, until reaching electrostatic balance. Thus, a depletion region between p-type and n-type conductor is generated, producing an internal electric field (built-in electric field) (Fig. 7)30. In this balance, if a charged particle is placed in the depletion region, it will move from one side to the other, under a built-in electric field.
28 B. O’Regan, M. Grätzel, Nature, 1991, 353, 737–740.
29 Adapted image from: 1) https://www.futurasun.com/dt_gallery/monocristallino-5bb/; 2) http://www.neofos.it/lavorazioni/pannelli-solari-fotovoltaici/.
30 a) R. F. Pierret (1996), Semiconductor Device Fundamentals; b) R. H. Bishop (2002), The Mechatronics Handbook.
14
Fig. 7: Schematic representation of photoelectric effect (left) and Si-based PV cell mechanism (right)31.
In a PV cell, the excitation induced by sunlight absorption of n-type semiconductor can generate an electron-hole pair, which moves in p-n junction and is separated due to built-in electric field. Hence, a DC electric current is registered in the external circuit.
Crystalline silicon has been a success from laboratory to commercial availability and makes up 90% of the global PV market32. At the moment, such devices remain the principal choice for PV. Due to the abundance and non-toxicity of Silicon, the high and stable efficiency, the improvement in manufacturing and production infrastructures.. However, large-scale production is still labeled by the high costs of materials and installation.
1.2.2 Second generation: Thin-film solar cell
The high costs of large-scale silicon-based solar cells -induced the investigation of other cheaper materials or technologies for energy production.
In the late 1970s, the first thin-film cells appeared on the market: a small strip of amorphous silicon was tested powering solar calculators.
A thin-film system consists of a slab of glass covered with a thin layer of photoactive material; three main materials are used: amorphous silicon (a-Si), cadmium telluride (CdTe) and copper indium gallium selenide (CIGS)33 (Fig. 8).
Fig. 8: Second generation PV prototypes: a-Si(left), CdTe (central) and CIGS (right) films.
31 https://asdn.net/asdn/energy/solar.
32 K. L. Chopra, P. D. Paulson, V. Dutta, Res. Appl.,2004, 69-92.
15
The main advantage of this technology is the reduced cost because thanks to the low direct band gaps of the photoactive source it is possible to use a very thin layer (Table 1), requiring less amount of material.
Table 1: Energetical, physical and chemical features comparison between the three principal photoactive materials
in a common PV system of second generation.
a-Si CdTe CISG
Band Gap (eV) 1.75 1.44 1.0-1.6 Thickness (μm) 1 3-5 1-2
Toxicity None Cd None
Furthermore, thin-film cells can be incorporated as building-integrated photovoltaics (BIPVs) or everyday electronics (watches, calculators, etc.).
The principal disadvantage is the lower efficiencies recovered, if compared with crystalline silicon cells, both in lab scale (about 12% for a-Si, 20-21% for CdTe and CIGS) and for module (17% for CdTe, 15% for CIGS).34, 35,36 Moreover, in some cases primary materials are toxic, affecting the chemical disposal, at the end of cells life.
1.2.3 Third generation: A bridge through the PV generation cells
Recently, a novel class of photovoltaics has emerged which employs a multi-junction energy production approach. Single p-n junction systems are confined in the Shockley-Queisser limit, which sets a maximum efficiency that cannot be overcome. The semiconductor involved in these devices can absorb only photons with specific energy compared to, or higher than, the energy of their own bandgap. Electrons absorbing photons with higher energy relax to the band edge, thermally releasing the surplus of energy (thermalization loss). Therefore, their limit depends on the semiconductor energy bandgap and can move from 31% to 40%37.
To overcome the Shockley-Queisser limit, emerging new semiconductors need to be developed.
34 H.S. Ullal, Proc. 28th IEEE PVSC, 2000, 418–423.
35 H. Ye, H.S. Park, V.A. Akhavan, B.W. Goodfellow, M.G. Panthani, B.A. Korgel, A.J. Bard, J. Phys. Chem. C, 2011, 115, 234–240.
36 F. Dimroth, M. Grave, P. Beutel, U. Fiedeler, C. Karcher, T.N.D. Tibbits, E. Oliva, G. Siefer, M. Schachtner, A. Wekkeli et al., Prog. Photovoltaics Res. Appl. 2014, 22, 277–282.
16
The third generation of PVs is based on wide innovative harvesting technologies, starting from multi-junction cells. The employment of several layers coated with a wide range of photoactive materials determines a broad extended absorption range, as a consequence of the sum of different components band gaps. In this regard, remarkable results have been obtained for Ga-As-In-based four-junction cells, showing a record of 46% efficiency. However, the high costs of their production limit their applications38.
A less costly alternative based similarly on the same architectural model of the multiple energy levels systems, is Organic Photovoltaics (OPVs).
Fig. 9: OPVs: general structure of a bilayer cell and its mechanism39.
Similar to multi p-n junctions, OPVs are composed of two or more layers of photoactive organic compounds, sandwiched between two electrodes (see Fig. 9). After sunlight excitation, the donor unit (D) absorbs the solar radiation, promoting an electron from the ground state (HOMO) to the first excited state at lower energy (LUMO). Due to contact of donor D and acceptor A materials and to appropriate energy levels between conduction and valence bands, the excited electron diffuses from the donor material to the acceptor one. On the donor moiety, a hole is formed and charge separation is observed (free holes and electrons). A photocurrent is generated when the holes and the electrons move to the corresponding electrode through donor and acceptor compounds40.
The simple structure, the low costs of the materials and the simple production are excellent advantages for such devices. However, their performances are strictly bound by a specific design and fabrication of the molecule41. Practically, at the moment, the current low efficiency (17% in tandem polymer/NFA42,43) and some problems of long term stability circumscribe their diffusion.
In the last two decades, alternative PV cell types have been considered, especially for their new concept approach: dye-sensitizer solar cells (DSSCs) and Perovskite solar cells (PSCs). Both of them are based on different mechanisms to convert solar energy into electricity.
38 F. Dimroth, T.N.D. Tibbits, M. Niemeyer, F. Predan, P. Beutel, C. Karcher, E. Oliva, IEEE J. Photovoltaics, 2016, 6, 343-349.
39 Organic photovoltaic (OPV) tutorial, Organic and printed electronics, Sigma Aldrich. 40 J. Niklas, O.G. Poluektov, Adv. Energy Mater., 2017, 7, 1602226.
41 V. Savikhin, M. Babics, M. Neophytou, S. Liu, S.D. Oosterhout, H. Yan, X. Gu, P.M. Beaujuge, M. F. Toney, Chem. Mater., 2018, 30, 7872−84.
42 L. Meng, Y. Zhang, X. Wan, C. Li, X. Zhang, Y. Wang, X. Ke, Z. Xiao, L. Ding, R. Xia, H.-L. Yip, Y. Cao, Y. Chen, Science,
2018, 361, 1094–98.
17
Fig. 10: Dye-sensitizer solar cell (DSSC), actually employed in PV market44 and its schematic mechanism45.
Dye-sensitizer solar cell (DSSC) technology was reported for the first time in 1991 from M. Grätzel and B. O’Regan46. The new mechanism, introduced by the two chemists, was based on the imitation of the photosynthetic process (Fig. 10). While in the typical PV cell Si-based the semiconductor acts as photoreceptor and charge transfer, in DSSC system (called also “Grätzel’s cell”) the semiconductor (e.g. TiO2) is linked with full organic or hybrid metallic-organic sensitizer, which works such as chlorophyll pigment in a leaf.
The dye absorbs photons at a specific wavelength causing the transfer of electrons from the dye to the semiconductor and from this to the external circuit. The cycle is closed through a redox pair that regenerates the dye and which is in turn regenerated by the electrons coming from the external cycle. The abundance and the moderate or low costs of materials make DSSC technology an interesting alternative; however, the power conversion in electricity reaches, for the moment, only 14% of efficiency at lab-scale and 5-6% for large-scale modules47.
44 Assessment and exploitation of the inherent value of waste electrical and electronic equipment (WEEE) for circular economy, 2018, doi: 10.23889/SUthesis.39601.
45 S. Yun, J.N. Freitas, A.F. Nogueira, Y. Wang, S. Ahmad, Z.-S. Wang, Progress in Polymer Science, 2016, 59, 1-40. 46 B. O’Regan, M. Grätzel, Nature 1991, 353, 737–740.
18
Fig. 11: A common Perovskite solar cell composition in its possible crysalline conformations (up)48 and the
schematic structure and mechanism of a typical PSC49.
Perovskite solar cells (PSCs) have received great attention from the research community due to the interesting improvement of their efficiency, from 3.8% to 22.1%, since 200950,51.
The first photoactive material used in a PSC was calcium titanate, discovered by G. Rose and named by the mineralogist L. Perovski. Since that, the term “perovskite” was attributed to all compounds which present the same crystal structure as calcium titanate, with a general formula ABX3, where A is an organic cation (such as ammonium organic salt), B a metal cation (e.g. Pb2+) and X is a halide anion (e.g. I-) 52 (Fig. 11).
The first structure model was inspired to the DSSC device, where the electrolyte covers both mesoporous TiO2 particles and the perovskite material takes the place of the dye-sensitizer. Hole-transporting material (HTM) is necessary to transport the hole from the perovskite to the cathode.
The design of PSC, the choice of halide in the perovskite material, the thickness of TiO2, the structural features of HTM contribute to affect the photovoltaic efficiency of the device.
Perovskite material is cheap, soluble, easy to synthesize and to assemble; however, some drawbacks restrain PSC development and their access to the global market. The high solubility makes the perovskite material sensible to moisture; the crystalline structure could be lost at high temperature, easily reached in a solar panel, for long-time exposure; finally, during the
48 https://www.perovskite-info.com/perovskite-solar.
49 App. Note, AN_P45 Affiliation: Edimburgh Instruments Ltd., 2018, Stuart Thomson. 50 A. Kojima, K. Teshima, Y. Shirai, T. Miyasaka, J. Am. Chem. Soc., 2009, 131, 6050–51.
51 M. Saliba, T. Matsui, J.-Y. Seo, K. Domansk, J.-P. Correa-Baena, M. K. Nazeeruddin, S. M. Zakeeruddin, W. Tress, A. Abate, A. Hagfeldt and M. Grätzel, Energy Environ. Sci., 2016, 9, 1989–97.
19
production of electricity, from the degradation of perovskite material, PbI2 is generated, that is a carcinogen substance.
1.3 LUMINESCENT
SOLAR
CONCENTRATORS
The progress made in PV technology leads the modern module costs near 1-2 Euro/Wp, bringing the electricity costs close to 2 Euro/kWh. This price is still far from the large-scale electricity generation costs for conventional fossil fuels (0.02-0.04 Euro/kWh)53 and further improvement are needed.
It is well known that the high performances of silicon-based PV modules depend on several geographic and structural parameters. The losses of power for a module can be due to temperature loss (Lct) and capture losses (Lcm). Indeed, temperature plays a crucial role in PV performances as the rising of temperature could have a negative effect on the efficiency of the module. Such parameter depends on several conditions such as the weather data, solar source, thermal and physical properties of the module, heat transfer coefficient due to the wind54. The capture losses collect all the other loss mechanisms associated with engineering parameters such as the joule effect of the wiring, diodes, shading effect, and with geographic conditions as latitude, low irradiance, snow covering, exposure55 .
Southern exposure with a specific angle of inclination could maximize PV module performances. The inclination (Tilt angle) depends on the angle with which the solar radiation reaches the Earth (Fig.12 and 13).
Fig. 12: Effect of incident solar radiation to the incident angles at different latitude56.
53 W. G.J.H.M.van Sark, Renewable Energy, 2013, 49, 207–210. 54 E. Skoplaki, J.A.Palyvos, Renewable Energy, 2009, 34, 23–29.
55 I. Santiago, D. Trillo-Montero, I.M. Moreno-Garcia V. Pallarés-López, J.J. Luna-Rodríguez, Renewable and Sustainable Energy Reviews, 2018, 90, 70–89.
20
Fig. 13: Power energy production of PV plant in the function of their latitude and “Tilt angle” in some Italian
cities57.
These conditions restrict the applicability of PV modules in specific locations such as roofs of buildings, farmlands and countryside, canopies or sunshades.
To overcome some of the limitations for large-scale installation of PV technology of first generation, luminescent solar concentrators (LSCs) have been introduced as a promising alternative device.
In its common model, an LSC consists in a thin slab of high refractive index material (glass or polymer), doped with a luminescent optical compound, capable of absorbing solar radiation and concentrating it, through internal reflection mechanisms, at the edges of the slab, downconverting it by fluorescence or phosphorescence. A small area of PV cell, located at the edges of the slab, could absorb the concentrated light and convert it into electricity.
21
1.3.1 LSC: historical development
LSC technology was born in the ’70s, when W.H. Weber and J. Lambe58 described a planar solar collector, utilizing a luminescent medium to concentrate solar energy. As more inventions started observing and simulating nature, Weber and Lambe, working for Ford Scientific Laboratory Group, were inspired by the greenhouse natural process.
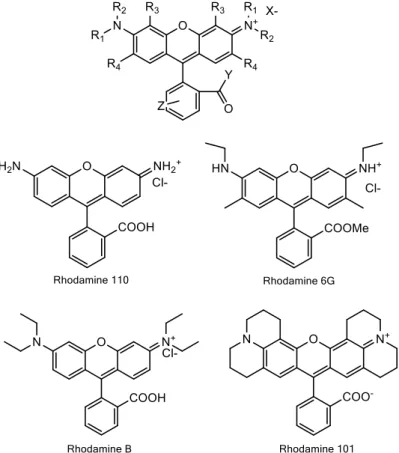
Through the total internal reflection process, luminescent material should absorb solar radiation and emit it in a range where its reabsorption would be weak. Neodynium(Nd3+ )-doped transparent glass appeared an ideal LSC: it showed several strong absorptions in a range of 500-900 nm and high emission of about 1090 nm, well suitable for the absorption of silicon. Its luminescent efficiency was reported to be 50-75%, independent from the incident sunlight. The first organic luminescent material tested was rhodamine-6G (Rh6G), which reported similar results of Nd-doped glass with a Si cell, in a different host matrix (PMMA). The main drawback was the large overlap between absorption and emission spectra of Rh6G, from which a decrease of efficiency was observed. In 1977, B.A. Swart et al.59, monitoring PMMA slab doped with Rh6G and coumarin 6 (C6), demonstrated the principle of a planar solar concentrator. They also observed a bathochromic effect (which corresponds to a red-shift of the absorption and emission maximum) comparing the polymer slab spectroscopic characteristics with the solution spectroscopic ones.
In 1978, C.F. Rapp and N.L. Baling60 coined the term “Luminescent Solar Concentrator”, to describe a broad range of luminescent collector. In 1982, A.M. Hermann61 reported the state of art, the costs and the device features of a modern LSC, in the first review, devoted to it. Some years later, Wittwer reached an efficiency of 4.0%, testing two sheets LSC of 40x40x0.3 cm3 and connecting one sheet to GaAs and the other to Si cells. The sheets were separated by an air gap. More recently, for the same LSC device, efficiencies of 7.0% and 6.7% were registered for 5x5x0.5 cm3 of LSC plate, connected in series with four solar GaAs and GaInP cells, respectively62,63.
A LSC device based on a mix of organic dyes, was also realized by Friedman64 who reported an optical efficiency of the total system of 3.2%. The device was composed by a Si solar cell connected to a thin layer of mixed organic compounds of 14x14x0.3 cm3. Connecting the same film to a GaAs solar cell, the efficiency increased up to 4.5%.
The research in the LSC field slowed down in the 1980s, due to the energy price drop and the limitations in the availability of new performing luminophores for LSC devices.
The recent increase in energy demand, energy price and the request for alternative energy sources renewed the interest in such technology.
58 W.H. Weber, J. Lambe, Appl. Optics, 1976, 15, 10, 2299-2300. 59 B.A. Swartz, T. Cole, A.H. Zewail, Optics Lett., 1977, 1, 2, 73-75.
60 Proc. 13th IEEE Photovoltaic Spec. Conf., p. 690. IEEE, New York (1978). 61 A.M. Hermann, Solar Energy, 1982, 29, 4, 323-329.
62 L.H. Slooff, E.E. Bende, A.R. Burgers, T. Budel, M. Pravettoni, R.P. Kenny, E.D. Dunlop, A. Büchtemann, Phys. status solidi - Rapid Res. Lett., 2008, 2, 6, 257–259.
63J. C. Goldschmidt, M. Peters, A. Bösch, H. Helmers, F. Dimroth, S. W. Glunz, G. Willeke, Sol. Energy Mater. Sol. Cells, 2009, 93, 2, 176–182.
22
1.3.2 Concentrator idea: LSC mechanism
The principle of the mechanism of a typical LSC is illustrated in figure 14.
Solar radiation impacts the surface of LSC; part of the sunlight radiation could be transmitted and part of it could be absorbed by the fluorophore dispersed in the slab. The luminescent specie isotropically emits in a specific wavelength range and, through a series of total internal reflection mechanisms, is guided at the edges of the panel, where a PV cell could absorb it and produce energy65.
Fig. 14: LSC general mechanism.
Total internal reflection is depended on the refractive index of plastic plate, n, and controlled by Snell’s law. The critical angle θc represents the limited angle for which the emitted light could
be totally internal reflected (Fig. 15).
Fig. 15: Critical angle from Snell’s law, in which η1>η2 and with η2=1 (ari refractive index)66.
The choice of the host matrix is fundamental to improve the internal reflection fraction and, consequently, the optical efficiency of the device determining the light entrapping and LSC behavior. For instance a high refractive index could promote the trip of the emitted light to the PV cell, however, can also increase the reflectivity of material, limiting the fraction of light which
65 W. G.J.H.M. van Sark, Renewable Energy, 2013, 49, 207–210. 66 M. G. Debije, P. P. C. Verbunt, Adv. Energy Mater., 2012, 2, 12.
23 could cross the surface of the LSC.
Focusing on the academic literature reports about polymeric material used in LSCs, poly(methyl methacrylate) (PMMA) is one of the most common host matrices used.
The Refractive index of PMMA is n=1.5; for this value, the critical angle is 42.2°. Thus, approximately 75% of the all emitted radiation is totally internal reflected67,68.
1.3.3 Optical efficiency: definition
To determine the optical efficiency some definition are needed. Taking in consideration a typical LSC device as shown in Figure 16, E1, E2 and E3 are the energy of irradiation, the energy that reaches the PV cell, and the energy converted by PV cell respectively; the optical efficiency, ηopt, is the efficiency of LSC itself, so without taking in account E3, the energy converted by the PV cell, ηopt_e is obtained by the ratio between the energy contribution of light reaching the solar cell (E2) and the incident light (E1) (see Eq.1).
Fig. 16: Energy contributions for a LSC device.
In terms of flux of photons, ηopt_f is reported as a ratio between the numbers of photons emitted which reaches the PV cell (Flux2) and the number of photons absorbed by the fluorophore (Flux1) (see Eq. 2).
Eq. 1
Eq. 2
Finally, the efficiency of the whole device could be simplified as the ratio between the photocurrent produced by the whole device and the photocurrent produced at the edge of the slab by PV cell, multiplied by a geometric factor (G), which depends on dimensions of LSC and PV cell (Eq. 3).
67 J.S. Batchelder, A.H. Zewail, T. Cole, Appl. Opt., 1981, 20, 3733–54.
24
Eq. 3
Commonly, G is about 16.6.
In an ideal LSC device, the optical efficiency would be determined on the trapping efficiency of the waveguide. In a realistic situation, it is influenced by several contributions and it could be described with the followed expression69:
Eq. 4 ηopt = (1-R) ηasb ηLQE ηStokes ηtrap ηhost (1- ηself) ηTIR where
R = surface reflection coefficient. It is relative to the amount of radiation reflected outside of the panel;
ηasb = absorption efficiency. It is the fraction of sunlight absorbed by the fluorophore;
ηLQE = quantum efficiency. It is the fraction of emitted radiation of luminophore, which could reach the edges of the panel;
ηStokes = Stokes efficiency. It is the loss of energy caused by auto-absorption and due to the overlap region between absorption and emission spectra;
ηtrap = efficiency of trapping light. It is the fraction of light lost from the “escape cone”, when the critical angle is higher than the limited one, to have total internal refraction;
ηhost = Matrix efficiency. It is the efficiency contribute to the transmission of light in the host material, depending on the scattering and absorption processes in the matrix;
ηself = efficiency of self-absorption by other luminescent specie in the host material (depends on concentration, dispersion in matrix etc.);
ηTIR = efficiency of total internal reflection. It is the fraction of radiation, which is reflected inside the thickness of the slab.
Each efficiency contribution is correlated to a series of mechanisms, which can be responsible of loss of power and therefore loss in efficiency (Fig 17).
The mean challenge for LSC technology is that of minimizing the mechanisms of losses of power to maximize the efficiency ηsys.
25
Fig. 17: Schematic mechanisms of losses of power for a general LSC device70. 1.3.3.1 Reflection (R)
A flat surface with a refracting index (n) of 1.5 (such as PMMA) reflects 4% of the sunlight radiation71, which could be considered as a loss. The process is described by Fresnel’s law, which is valid only for a homogenous and flat surface R, the percentage of reflected light, is defined as a ratio between the reflected intensity (Ir) and the refracted one (Ii).
Another parameter to consider is the polarization of the photons. A photon has a polarized electric field that could be oriented in perpendicular and parallel directions to the surface. The polarization of their electric fields influences the probability of reflection. The Fresnel’s law describes that probability, considering both polarization processes.
To reduce the reflection effect, rough surfaces could counter external reflection, thus the downside, rough surfaces are not able to guide photons at the edges and that is not acceptable for the LSC system. On the other hand, a lower refractive index could reduce reflection losses; however, at the same time, reduces also the trapping efficiency.
1.3.3.2 Absorption efficiency (ηasb)
An LSC requires an active luminescent specie, which could absorb a specific amount of incident light. Different species give a different and peculiar absorption spectrum. The strength of the luminophore absorption depends on its concentration in the host material. The higher is the number of luminescent species in the matrix, the higher will be the probability of a photon to be absorbed. Without absorption, solar radiation is transmitted outside of LSC. This possibility could depend on mismatching of the photon energy with the absorption energy of luminophore, low concentration or short travel length.
According with Lambert-Beer law, absorption is depended on the ratio between the intensity of transmitted light (It) and incident light (I0) (Fig. 18).
70 C. Tummeltshammer, A. Taylor, A.J. Kenyon, I. Papakonstantinou, Solar Energy Materials & Solar Cells, 2016, 144, 40–47.
26
Fig. 18: Lambert-Beer law.
Moreover, absorption is strictly dependent on the concentration of photoactive specie (c) and the optical path length of light through the solution.
Another important parameter is the extinction molar coefficient that is a wavelength dependent constant. To increase this contribution, a high extinction molar coefficient, capable to cover a high solar spectrum range would be preferred An interesting innovating approach, to increase the absorption range, is that of combining two or more luminophores in the case of multiple LSCs, adding their absorption spectra.
1.3.3.3 Quantum efficiency (ηLQE)
Not all the absorbed photons could be emitted as useful photons. The complex structure of rotational, vibronic and electronic states of luminophore determines several emission processes, with non and radiative contributions.
Frank-Condon principle explains clearly the emission complexity. Undergoing an electronic transition, the nuclear configuration does not change significantly and the electronic transition to the ground state produces a radiative emission.
The high number of vibronic and rotational states and their higher energy could induce a series of non-radiative processes, which decrease the fluorescence and consequently the quantum efficiency.
The ratio between the number of emitted photons and the absorbed ones, which give fluorescence processes, is called fluorescence quantum efficiency. This parameter depends on the luminophore nature. For a high performing LSC, a high quantum efficiency is necessary. 1.3.3.4 Stokes efficiency (ηStokes)
The Stokes shift is the energy separation between the peak closest to the lower energy of the absorption band and the peak nearest to the highest energy at the emission band72. Stokes loss depends on the loss in energy between the absorbed and emitted photons, taking in
27
consideration only the emitted ones. Such effect is difficult to reduce, however it is not the major loss mechanism as long as the energy of photons is still large enough to generate an electron-hole pair within the PV cell, to overcome this bandgap.
1.3.3.5 Trapping efficiency (ηTrap): “Escape cone”
A particle of luminophore emits in all directions; part of such emission could travel through total internal reflection (TIR) into the polymeric slab, with refractive index n1. The slab is exposed and in contact with another material (as air) with a different refractive index (n2). From Snell’s law, a critical angle (θc) determines which trips of emitted light could be reflected internally and supply to the production of electricity of PV cell, at the edges of the slab.
At the interface, if the angle θi is higher than the critical one, θc (θi > θc) the photon is totally internally reflected. On the contrary, if the angle θi is equal or lower than θc, the emitted light could be reflexed outside the slab, through the so called “escape cone” (Fig. 19).
Fig. 19: a) Escape cone mechanism and b) critical angle between two materials with different refractive index
(where η1>η2)73.
The escape cone loss for a host material with n = 1.5 is about 25%, while the corresponding 75% is approximately reflected.
1.3.3.6 Re-absorption losses (ηself)
A consequence of small Stokes shift (typical for the most common organic LSC fluorophores) is the large overlap region between the absorption and emission spectra. In this area, the possibility to observe re-absorption is high. Re-absorption is the capability of other luminophore particles, dispersed in the polymer slab, to absorb fluorophore-emitted photons during their trip into the waveguide74.
73 M. G. Debije, P. P. C. Verbunt, Adv. Energy Mater., 2012, 2, 12. 74 R.W. Olson, R.F. Loring, M.D. Fayer, Appl. Optics, 1981, 20, 2934-40.
28
Fig. 20: Re-absorption mechanism.
Re-absorption processes are not losses of power themselves, but could become a loss if the other luminophore does not emit (loss of power through non-radiative mechanisms) or losses emitted photons through its escape cone75 (Fig. 20).
To reduce the re-absorption effect, some techniques are tested from the research community. One of those is based on the use of dopants with a polar and high mobility effect (such as thiosin). The dopant, altering the electronic states of fluorescence and absorption of the fluorophore, might increase the Stokes shift and reduce the overlap region76.
Another possibility is that of designing a multiple LSC panels, creating a stack number of LSC devices, each of them doped with different and specific luminophores, which absorb in a different range of the solar spectrum77.
A central drawback of some luminophores is the low effect of re-absorption in the lab-scale, however, the corresponding energy loss through re-absorption in large-scale devices is higher. To avoid it, two techniques could be considered: the introduction of a thin layer doped with luminophore on a surface of the polymeric slab78(Fig. 21A) or the covering of the polymer surface with thin layer luminophore-doped, physically spaced by stretches of empty waveguide (Fig. 21B)79. In both cases, the effect of re-absorption is limited by the lower amount of luminophore, allowing the possibility of obtaining large scale LSC even when using luminophores with high re-absorption effect.
75 a) R. Sóti, É. Farkas, M. Hilbert, Zs. Farkas, I. Ketskeméty, J. Luminescence, 1996, 68, 105-114; b) K. Geetha, M. Rajesh, V.P.N. Nampoori, C.P.G. Vallabhan, P. Radhakrishnan, J. Opt. A: Pure Appl. Opt., 2004, 6, 379; c) L.R. Wilson, B.C. Rowan, N. Robertson, O. Moudam, A.C. Jones, B.S. Richards, Appl. Optics, 2010, 49, 1651-61.
76 A.M. Taleb, Renew. Energ., 2002, 26, 137-142.
77 a) M.J. Currie, J.K. Mapel, T.D. Heidel, S. Goffri, M.A. Baldo, Science, 2008, 321, 226-228; b) M.G. Debije, P.P.C. Verbunt, P.J. Nadkarni, S. Velate, K. Bhaumik, S. Nedumbamana, B.C. Rowan, B.S. Richards, T.L. Hoeks, Appl. Optics,
2011, 50, 163-169.
78 a) W.G.J.H.M. van Sark, K.W.J. Barnham, L.H. Slooff, A.J. Chatten, A. Büchtemann, A. Meyer, S.J. McCormack, R. Koole, D.J. Farrell, R. Bose, E.E. Bende, A.R. Burgers, T. Budel, J. Quilitz, M. Kennedy, T. Meyer, C. De Mello Donegá, A. Meijerink, D. Vanmaekelbergh, Opt. Express 2008, 16, 21773-92; b) A.M. Hermann, Sol. Energ., 1982, 29, 323-329; c) R. Reisfeld, M. Eyal, V. Chernyak, R. Zusm, Sol. Energ. Mater., 1988, 17, 439-455; d) W. Viehnmann, R.L. Frost, Nucl. Instr. Meth., 1979, 167, 3, 405-415; e) T. Dienel, C. BauerIgor, D.D. Brühwiler, Sol. Energy, 2010, 84, 1366-69; f) R. Reisfeld, Opt. Mater., 2010, 32, 850-856.
29
Fig. 21: Schematic demonstration of the contribution of patterned fluorescent dye waveguide. On the top, mechanism
of the standard thin layer luminophore-doped; on the bottom, mechanism of patterned dye layer.
In both case, the incident light (green arrow) could be absorbed by a luminophore and emit longer wavelengths (red and grey solid arrows). In the best conditions, the emitted light could be re-absorbed by another luminescent particle and re-emitted in long wavelengths, avoiding escape cone losses80.
1.4 LSC COMPONENTS
As we have already seen, three units compose an LSC device: the PV cell, the polymeric slab and a specific fluorophore inside of the host material.
The PV cell is usually silicon-based, covering one or all the edges of the panel. The thickness is usually around 5 mm.
Even if in literature different designs of LSC have been described such modifications are not the principal variable for the efficiency of the system, while the design and the choice of the host material and luminophore seem to be crucial to improve LSC’s performances.
1.4.1 Host material
A compatible LSC matrix requires:
a good dispersion of the luminescent species in the polymer system. Low compatibility of the luminophore with the matrix causes aggregation, with a high probability of cracks formation and not homogenous polymeric surfaces;
high transparency, with lower reflection mechanisms of the solar radiation, therefore, a distinct refractive index should be select to the LSC device;
thermo-resistance as an LSC is subjected to high temperature for a long time exposure;
high resistance to collisions and shocks as it should work in bad environmental conditions (resistance to moisture, hydrophobicity, etc.);
low structural defects of the surfaces (to limit reflection and favor trapping light);
no absorption of the sunlight, especially in the absorption region of luminophore, to avoid loss of efficiency: for instance, the presence of additive or radical initiators, used during the polymerization which persists in the polymeric latter, could absorb sunlight or luminophore’s total internal reflected radiation;
30
simple polymerization processes, especially for large scale devices; very low cost of starting materials.
According to this list of parameters, poly(methyl methacrylate) (PMMA) seems to be the best host material for this kind of optical device. PMMA, named also as “plexiglass”, is transparent, cheap, can be prepared with well known and simple polymerization process under mild conditions (in air atmosphere, heating at 90°C). Homogenous surfaces, large-scale synthesis and high control of physical features (flexibility, resistance, etc.) can be obtained during the polymerization process. PMMA is actually the principal polymeric matrix used for LSCs. However, polycarbonates (PCs), polystyrene (PS) and styrene-acrylonitrile resin (SAN) have also found a place in the LSC industry, for their high thermo-resistance81 (Fig. 22).
Fig. 22: Host matrices for LSC: from left to right, PMMA, PC and SAN resin82.
These matrices include high optical transparency, sustainability, good dye dispersion and commercial availability. In particular, PCs, tested with different polymeric formulations, show very comparable good results to those obtained with PMMA and offer good optical properties, high impact resistance and high thermal resistance. Otherwise, Compact Disc PC (PCCD), a high thermoplastic with good toughness polymer, exhibits lower critical angle escape and lower transmittance compared with PMMA.
Some other host materials were tested in LSC devices83: bio-based polymers, for an eco-friendly approach84, vacuum-deposited polymer, such as perylene-based thin films obtained through
81 F. Meinardi, F. Bruni, S. Brovelli, Energy Technol., 2017, 5, 1037-1044. 82 Adapted from: a) http://www.arteplastica.it/materiali; b)
https://www.indiamart.com/proddetail/polycarbonate-sheet-all-types-of-multiwall-colours; c) https://japanese.alibaba.com.
83 a) Y. Li, X. Zhang, Y. Zhang, R. Dong, C.K. Luscombe, Journal of polymer science, 2019, 57, 201-215; b) G. Griffini, Front. Mater., 2019, 6, 29, 1– 8.
84 V. Fattori, M. Melucci, L. Ferrante, M. Zambianchi, I. Manet, W. Oberhauser, G. Giambastiani, M. Frediani, G. Giachi, N. Camaioni, Energy Environ. Sci., 2011, 4, 2849– 2853, b) M. Melucci, M. Durso, L. Favaretto, M.L. Capobianco, V. Benfenati, A. Sagnella, G. Ruani, M. Muccini, R. Zamboni, V. Fattori, N. Camaioni, RSC
Adv., 2012, 2, 8610– 8613; c) F.I. Chowdhury, C. Dick, L. Meng, S.M. Mahpeykar, B. Ahvazi, X. Wang, RSC Adv.,
31
coarse vacuum co-sublimation85, fluorinated polymers, characterized by high hydrophobicity and long-term durability86 or inorganic-organic hybrid polymer ureasil-based87.
1.4.2 Luminophore
The main component of an LSC is the luminophore, whose optical behavior has a major influence on the final efficiency. The choice of luminophore affects many properties, like the light transport efficiency and absorption, the photoluminescent quantum yield, the energy lost due to the heat generation, the re-absorption loss and the number of photons reaching the PV cell.
Therefore, several features need to be considered to maximize the optical performance. Concerning the optical properties, a good luminophores should have:
broad absorption window;
high absorption efficiency over the whole spectrum range; high fluorescence quantum yield (Φf);
large Stokes shift and consequently limited overlap between absorption and emission spectra; however other properties should also be considered such as high stability (photochemical, thermal, environmental);
good solubility in the host material for a good dispersion (avoiding aggregation or π-π stacking which could quench fluorescence and decrease fluorescence quantum yield);
high matching between the emission photons and the working absorption band of PV cell (about 1.14 eV for Silicon);
low or null toxicity;
simple preparation processes; low costs.
To meet these requirements, a wide variety of compounds have been studied in these last decades. Three main classes of luminophores are defined: Quantum Dots (QDs), late-metal complexes and organic dyes.
QUANTUM DOTs (QDs)
Quantum Dots (QDs) are semiconducting nanocrystals/nanoparticles with dimensions between 10 and 100 nm88 that were introduced as luminescent species for LSC by Barnham
85 a) G. Maggioni, A. Campagnaro, S. Carturan, A. Quaranta, Solar Energy Materials & Solar Cells, 2013, 108, 27-37; b) M. Tonezzer, G. Maggioni, A. Campagnaro, S. Carturan, A. Quaranta, M. della Pirriera, D.G. Tauste Progress in Organic Coatings, 2014, 77 (2), 528-536.
86 a) G. Griffini, M. Levi, S. Turri, Progress in Organic Coatings, 2014, 77 (2), 528-536; b) G. Griffini, M. Levi, S. Turri, Solar Energy Materials & Solar Cells, 2013, 118, 36-42; c) C. Credi, D. Pintossi, C.L. Bianchi, M. Levi, G. Griffini, S. Turri, Materials & Design, 2017, 133, 143-153.
87 a) A. Kaniyoor, B. McKenna, S. Comby, R.C. Evans, Advanced Optical Materials, 2016, 4 (3), 444-456; b) R. Rondão, A.R. Frias, S.F.H. Correia, L. Fu, V. De Zea Bermudez, P.S. André, R.A.S. Ferreira, L.D. Carlos ACS Applied Materials & Interfaces, 2017, 9 (14), 12540-46; c) Z. Li, X. Zhao, C. Huang, X. Gong, Journal of Materials Chemistry A: Materials for Energy and Sustainability, 2013, 1 (25), 7339-50; d) A.R. Frias, E. Pecoraro, S.F.H. Correia, L.M.G. Minas, A.R. Bastos, S. García-Revilla, R. Balda, S.J.L. Ribeiro, P.S. André, L.D. Carlos, R.A.S. Ferreira, Journal of Materials Chemistry A: Materials for Energy and Sustainability, 2018, 6 (18), 8712-8723.
32 who predicteda concentrator efficiency up to 20%89.
The production of such species is based on a variety of methods including colloidal or single-molecule precursor growth. Due to their nanodimensions, nanoparticles can hinder the excited electrons in the semiconductor, showing optical and electronical properties similar to atoms. The main advantages of this technique are Large Stokes shift, good photostability. Furthermore being the emission spectra dependent on QDs size it is possible to tune the optical properties by the choice of their dimensions.
Fig. 23: LSC quantum dots-based: the effect on absorption and emission spectra of structure (left)90 and dimension
(right)91, which describes the red-shift effect on spectroscopic features of CdSe@ZnS QDs, with the increasing of
diameter dimensions.
QDs can absorb the whole visible spectrum, modulating particle diameter92 (Fig. 23).
Increasing the dimensions of QD particles, the band gap decreases and consequently the overlap region too, thus the re-absorption loss can be modulated in the function of size: in other words, it is possible to optimize the solar collector performances by the control of re-absorption through the spread of dimensions93.
QDs have already found some interesting applications in bio labeling, sensing, imaging, drug delivery, nanoelectronics, photonics, light-harvesting and display panel technology. However, there is a mean drawback, which limits their use, which is due to stability issues. In particular, they can be photodegradated in presence of oxygen, or lead to the formation of clusters in the polymer matrix, with blue-shift effect, can lead to polymerization and are toxic both because of their chemical compositions and of their processing conditions (Cd, Hg, Pb, As based QDs e.g.).
89 a) K. Barnham, J.L. Marques, J. Hassard, Appl. Phys. Lett., 2000, 76, 1197-99; b) A.J. Chatten, K.W.J. Barnham, B.F. Buxton, N.J. Ekins-Daukes, M.A. Malik, Sol. Energ. Mater. Sol. C., 2003, 75, 363-371.
90 Genesis Nanotechnology, WorldPress.com.
91 W.R. Algar, K. Susumu, J.B. Delehanty, I.L. Medinzt, Anal. Chem., 2011, 83, 8826–8837.
92 O.I. Mićić, H.M. Cheong, F. Fu, A. Zunger, J.R. Sprague, A. Mascarenhas, A.J. Nozik, J. Phys. Chem. B 1997, 101, 4904-4912.
93 J. Bomm, A. Büchtemann, A.J. Chatten, R. Bose, D.J. Farrell, N.L.A. Chan, Y. Xiao, L.H. Slooff, T. Meyer, A. Meyer, W.G.J.H.M. van Sark, R. Koole, Solar Energy Materials and Solar Cells, 2011, 95, 2087–94.
33 LATE-METAL COMPLEXES
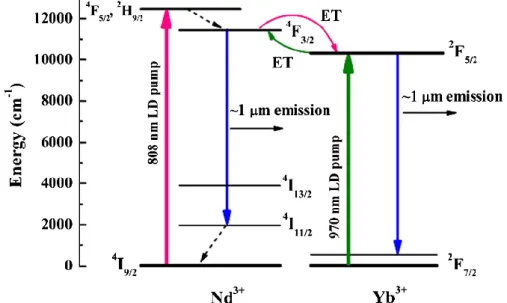
Rare-earth ions could be another possible solution because of their high photostability and large Stokes shift. Levitt and Weber described in 1977 Nd+3-doped glass as a material for concentrator devices94. The main limitation of neodymium LSC was the low efficiency, which is due to its high emission range (in NIR region). To improve it, the first approach was that of doping Nd-based glass with another late metal such as ytterbium ions (Yb3+)95 (Fig. 25).
Fig. 24: Schematic mechanism of photophysical processes, involved for Nd3+ codoped with Yb3+ ions96.
For instance, the emission peak of neodymium is about 1060 nm; in presence of ytterbium, the populated 4F3/2 of neodynium transfers its excited electrons on 2F5/2 depopulated state of Yb. Yb3+ transition is around 970 nm (2F5/2 2F7/2), where the response to photons of silicon is still high. Unfortunately there are some limitations mainly due to the low absorption efficiency of neodymium and ytterbium97 and the dependence of the energy transfer from Nd3+ to Yb3+ on the type of glass employed: in borate tellurite glasses, the energy transfer is around 90%98. Alternatively, Uranyl ions (UO22+) could be used as they exhibit an absorption efficiency of five orders of magnitude higher than neodynium codoped with ytterbium LSC. However, the absorption is limited to the blue range of the spectrum (about 430 nm) and the fluorescence is around 550 nm with a moderate fluorescence quantum yield (67%)99. For these reasons, uranyl ions can be applied as co-dopant with other rare earth metals.
The limited range of absorption of rare earth metals (430 nm and970 nm), resulting in a loss of the high energy of the visible light, did not improve their applications in LSC.
To shift absorption maximum, organic ligands coordinating to the rare earth ions have been proposed100.
94 J.A. Levitt, W.H. Weber, Appl. Optics, 1977, 16, 2684. 95 R. Reisfeld, Y. Kalisky, Chem. Phys. Lett., 1981, 80, 178-183.
96 F. Riviera-Lopez, P. Babu, C. Basavapoornima, C.K. Jayasankar, V. Lavin, J. Appl. Phys., 2011, 109, 123514. 97 R. Reisfeld, S. Neuman, Nature, 1978, 274, 144-145.
98 C. Lurin, C. Parent, G. Le Flemp, P. Hagenmuller, J. Phys. Chem. Solids, 1985, 46, 1083-92. 99 N. Neuroth, R. Haspel, Sol. Energ. Mater., 1987, 16, 235-242.
100 a) R. Reisfeld, J. Less-Common Met., 1983, 93, 243-251; b) O. Moudam, B.C. Rowan, M. Alamiry, P. Richardson, B.S. Richards, A.C. Jone, N. Robertson, Chem. Commun., 2009, 6649-51.

![Fig. 36: Output light intensity trend of [8]CPP and [10]CPP, comparing to Lumogen Red 305, in function of the](https://thumb-eu.123doks.com/thumbv2/123dokorg/4626684.40775/51.892.107.789.191.473/fig-output-light-intensity-trend-comparing-lumogen-function.webp)