1
REPORT ON THE STATE OF AGRICULTURE
2010
2
Scientific Committee
Dario Casati, Felice Adinolfi, Cristina Nencioni, Maria Angela Perito, Alessandra Pesce
Editor: Maria Angela Perito
Members of the Editorial Committee: Dario Casati, Maria Angela Perito, Lucia Tudini, Domenico Ciaccia, Maria Carmela Macrì, Alessandro Banterle, Massimo Spigola, Roberto Solazzo, Alessandra Pesce, Lucia Briamonte, Anna Vagnozzi, Alfonso Scardera, Denis Pantini, Felice Adinolfi, Marco Barbetta, Fabian Capitanio.
3
Introduction
The Report on the State of Agriculture has reached its seventh edition; and constitutes an essential instrument, available to policy makers and sector operators alike through INEA, in analyzing the national agricultural system.
In particular, the economic crisis, price volatility of agricultural commodities, changes in the Common Agricultural Policy and the new challenges concerning environmental sustainability paint a complex, and rather new, picture for the agri-food system. The Report provides an analysis on the focal trends of both national and international agri-food systems, as well as a detailed look at several key issues of current general interest, in order to better comprehend arising issues and their implications on the behaviour of farmers.
The 2010 edition of the Report on the State of Agriculture is structured into four parts. The first part, which looks at the international scenario, describes present and future dynamics of world economy while stating the implications on Italian agriculture and agri-food system. The second part regards the main economic indicators of the Italian agricultural and agri-food systems. The third part of the Report tackles the analysis of common policy (Pillars 1 and 2), national policy and regional implications. The fourth and final part of the Report provides a thematic focus on specific subjects of interest in order to clarify the dynamics relevant to the development of the Italian agri-food sector.
1.The state of world agriculture in 2010
Though 2009 was initially deemed the “year of the crisis”, the first semester of 2010 still leaves no room in providing a feasible assessment of the overall entity and possible duration of this situation, which is accumulating growing acknowledgement as the worst economic and social burden of the recent decades. In view of this consideration, it is easy to understand how the events of the world crisis heavily influenced an evaluation of 2009. Indeed, the few highs and many lows marked a year of hardships and complication. Though slight differences are visible, 2010 does not seem to stray from the uncertainties linked to negative events possible in the near future.
Hence, the economic context reveals a situation of strong unrest. The first mid-year forecasts place world economy at a growth of +4.2% for 2010 and 4.3% for 2011, tough differing from country to country or groups of countries. Differences between Western developed countries and emerging countries in East Asia, Africa and Latin America are even more accentuated.
4
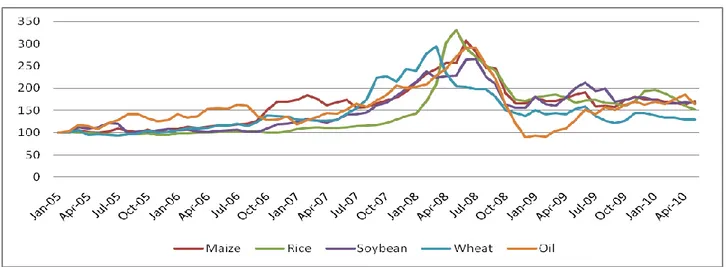
World agricultural markets face difficulty in finding a stable structure after prices have rocketed during the last two years. The volatility experienced between the second half of 2007 and the first half of 2008 is the phenomenon that has most contributed to the current global agricultural crisis, which the European market unexpectedly perceived in an intense manner. Thus, volatility is most likely destined to become the phenomenon that will further characterize agriculture throughout the upcoming decades.
Fig. 1.1 – Dynamics of global price indexes for oil and several agricultural products
Source: elaborations on data from USDA, International Grain Council & U.S. Energy Information Administration.
Nevertheless, it is worth bearing in mind that events similar to those mentioned earlier are not unusual to world markets. On the contrary, Italian and European farmers perceive them as threatening simply because they have always been immune to all other previous situations thanks to the tried protective mechanisms of the CAP. The relatively short price surge and range of products affected by price variation.
In general terms, as already mentioned in the “2009 Report on the State of Agriculture”, agricultural prices have increased alongside those of oil and other energy related products, including prices on all raw materials in general. There are various interpretations on the causes behind such a widespread and generalized phenomenon, despite the fact that all observers agree that the entire economic system is now facing the consequences of a phenomenon that is much more substantial than any usual economic situation.
5
The National Statistics Institute (ISTAT) provides data on how the Italian economy in 2009 was characterized by extremely slow growth of the GNP, which in real terms is at a -5% annual basis. This performance was due to poor results of the first, second and last quarter, only partially attenuated by a slight recovery in the third quarter. Contrarily, data on the first quarter of 2010 shows a 0.4% growth over the previous quarter.
Slow growth of the GNP was conditioned, on average for 2009, by the decrease of the value added of all main productive sectors. In particular, industry in a strict meaning registered a plunge of -15.2%, expressed in real value. Though of minor entity, this deceleration also struck the agri-food sector (including beverages and tobacco), which registered a 1.4% drop.
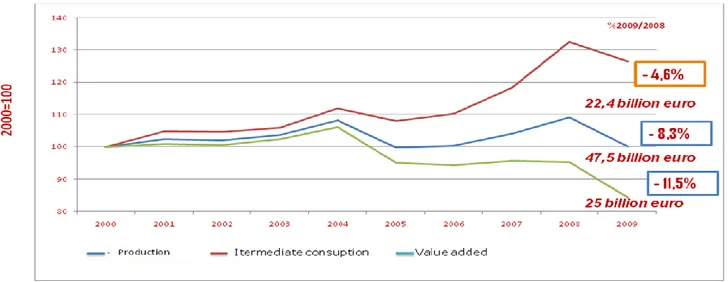
In Italy, the agricultural year of 2009 heavily suffered the burden of the global economic and financial crises. In fact, the Italian agricultural sector (relative to agriculture, forestry and fishing) showed an 8.3% decrease in value of production, at basic prices, closing at 47.5 billion Euro. At the same time, intermediate consumption costs decreased by nearly 5% in 2009 and have since remained stable.
Fig. 2.1 - Production, intermediate consumption and value added (agriculture, forestry and fishing) current prices (thousands Euro since 1999)
Source: elaboration on Istat data.
As a result of the trends for value of production and intermediate consumption, in 2009 the value added of agriculture, forestry and fishing took a great downturn (-11,5%), closing at 25 billion Euro. The decrease of value added is also confirmed in real terms (-3.1%), symptom revealing the objective difficulty that the primary sector must tackle.
6
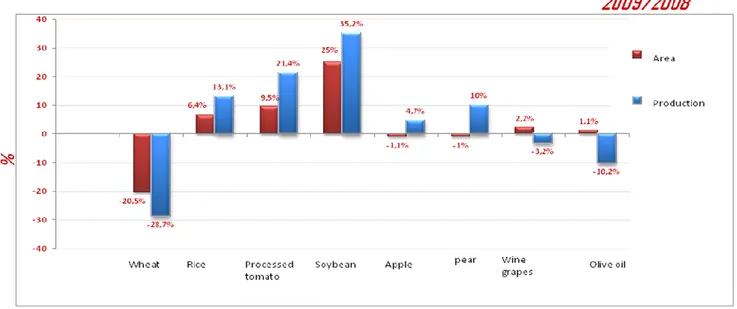
Moving on to take a look at specific sectors, there is a general decline of production in current value, with emphasis on timber cultivation (-12.1%) and fodder crops (-11.5%). The farming sector also experienced a decrease of 6.3% . Lastly, relative services are at a standstill (+0.2%).
Fig. 2.2 - Area and productions of several Italian cultivations
Source: elaboration on Istat data.
The effects of the economic crisis are also visible in overall labour market. Employment levels took a downturn in the second half of 2008, worsening in 2009. As explained in the report published by the Bank of Italy, confirmed by the national accounts, the reduction of labour input from 2008 to 2009 is even more significant if calculated in terms of hours worked (-3.6%). Within this framework, agriculture fell 2.3% in 2009, distributed unevenly in regards to territory and position held within the profession.
The production trend of the Italian manufacturing industry in 2009 was heavily influenced by the international economic crisis, which led to extremely negative results. The food industry, thanks to its anti-cyclical characteristics, managed to withstand the effects of the crisis. On average, food industry trends were significantly better, even if not positive, than those of the manufacturing. In 2009, the turnover of the Italian food industry, according to estimates by Federalimentare, remained almost stationary with respect to the previous year, which translates into 120 billion Euro; thereby, highlighting a market downturn in terms of value at current prices.
7
In particular, the last year suffered from a lack of exports, which played a key role in the growth of turnover in previous years. However, 2009 yielded a positive sign in what concerns value added at basic food prices (including tobacco). According to Istat data, this figure totalled 25.8 billion Euro at current values, with a 2.8% increase over the previous year.
The most alarming figure, always within the food industry (including tobacco), regards employment. There was a 4.1% decrease in 2009 in comparison with the previous year, falling to a total of 484 thousand workers. This means that approximately 20 thousand sector-related jobs were lost last year. However, the fall expressed in percentile value seems to be in line with the overall trend of industry, in a strict meaning.
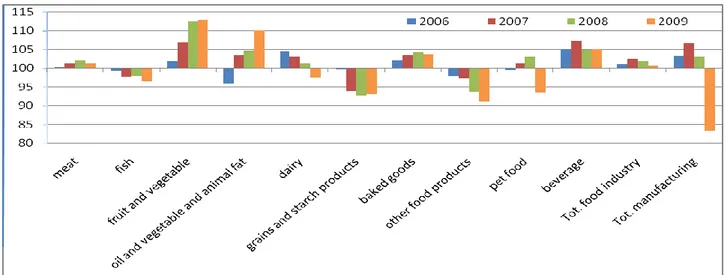
Taking a look at the assessment of production trends concerning the various food sectors, the Istat index regarding the food, beverages and tobacco industries shows only a slight decrease (-1.1%) in 2009 in comparison to the previous year, managing to remain at a higher level than 2005. On the other hand, the trend of the manufacturing industry as a whole seems to be much more alarming, with a decrease of 19.2%
Fig. 2.3 - Trend of the Italian food industry production average annual indexes (2005-100)
Source: elaboration on Istat data.
In 2009, the agri-food trade showed a general downturn for what concerns exports (-8%) and imports (-10%). These substantial reductions of the agri-food sector are decisively more contained than in Italian trade as a whole, which suffered a sharp 20% plunge.
8
Fig. 2.4 – Italian agri-food trade
Source: elaboration on Istat data.
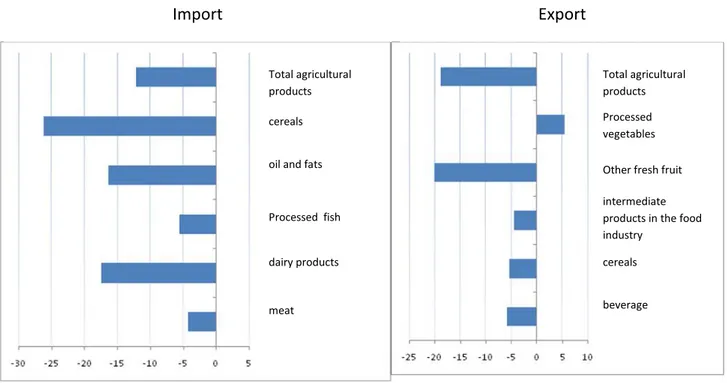
Fig. 2.5 – Agri-food sector trade – 2009/2008 variation
Source: elaboration on Istat data.
Toal food industry and beverage
Other food products
frozen crustaceans and molluscs
semi-processed pigmeat
Pet food
Processed fish
Import
Toal food industry and beverage
Olive oil
Confectionery
Red wine VQPRD, in bottle
pasta
Processed tomato
Export
9
Fig. 2.6 – Primary sector trade – 2009/2008 variation in %
Source: elaboration on Istat data.
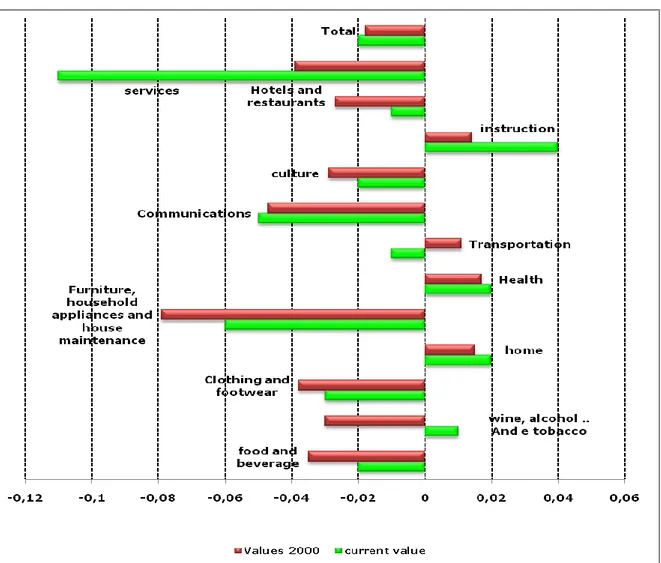
With regard to consumption, the economic-financial crisis has also influenced the amount of money Italian households spend on food. All spending items – with the exception of transportation, alcoholic beverages and tobacco and “essential” needs (education, health and home costs) – showed a decrease in consumption. In particular, money spent on food and non-alcoholic beverages in 2009 decreased by 2%, which is much more accentuated when considered net of inflation (-3.5%). Always with reference to 2009, the variation of the consumer price index (CPI) for food and non-alcoholic beverages stood at 1.8%, against an average total value of 0.8%.
Non-domestic food consumption also felt the bite of an extremely negative economic situation. In 2009, for the first time since 1970, spending suffered a slight decrease over the previous year (-0.2%).
Total agricultural products cereals
oil and fats
Processed fish dairy products meat Total agricultural products Processed vegetables
Other fresh fruit
intermediate products in the food industry
cereals
beverage
10
Fig. 2.3 - Spending of Italian households by item
Source: our elaboration on Istat data.
3. Economic policy for the agricultural sector
The 2010 Report on the State of Agriculture now encompasses a chapter that analyzes the status
quo of agricultural sector policy. In Italy, support to the primary sector is provided through various
levels of competence and responsibilities, employing a broad range of financial and regulatory instruments that are highly differentiated in terms of resource availability and objectives and scopes. Therefore, the 2010 Report attempts to highlight the critical analysis of current policy in favour of agriculture, while including all aspects bound to spending in 2009, forecasts for 2010 and the state of debate on the principle political instruments and relevant interconnected objectives. The main goal is to provide an interpretation to help guide political action in 2011.
The chapter is structured into three sections. The first section reconstructs the framework of common agricultural policy – first and second pillar – that represents the heart of active policy in
11
the primary sector. The second section is dedicated to instruments of national policy; and the third delineates regional response to the issue.
Common Agricultural Policy has been, since the Treaty of Rome, one of the main instruments that lend a contribution to the construction of the European Union. After fifty years, it is impossible to deny the role that the CAP has in stimulating the economic and social integration processes in every nation of the EU. Throughout time, sometimes with a speed that is not totally in alignment with the changes made to the target objectives, modifications have been made to duties and functions.
The review processes of the CAP instruments have all experienced consequential financial corrections significantly reducing the budget available, going from 89% of overall common budget allocation (including spending on rural development) in 1970 to 44% of the current financial framework.
Fig. 3.1 – Trend of community spending by agricultural item (% of total, 1970-2013) Figura 4.1 - Evoluzione della spesa comunitaria per capitoli agricoli (% sul totale, 1970-2013)
Fonte: De Castro 2010, pag.98 86,9 68,6 56,1 43,6 40,8 37,7 34,1 1,6 1,9 4 5,6 7,7 10,7 9,4 11,5 29,5 39,9 50,8 51,5 51,5 56,5 0% 10% 20% 30% 40% 50% 60% 70% 80% 90% 100% 1970 1980 1990 2000 2005 2009 2013
Politica Agricola Comunitaria Sviluppo Rurale Altre politiche
Source: De Castro, 2010, page 98.
Within this trend scenario, Italy has had a total average of 11.5% of all CAP resources (average from 1995 to 2009), characterized by a low of 9.7% in 1995 and high of 13% in 2002.
In Italy, payments made by EAGF (European Agricultural Guarantee Fund) on the clearance of accounts for the 2009 financial year (Commission Decision No. 258 of 30 April 2010) amounted to 4.73 billion Euro.
12
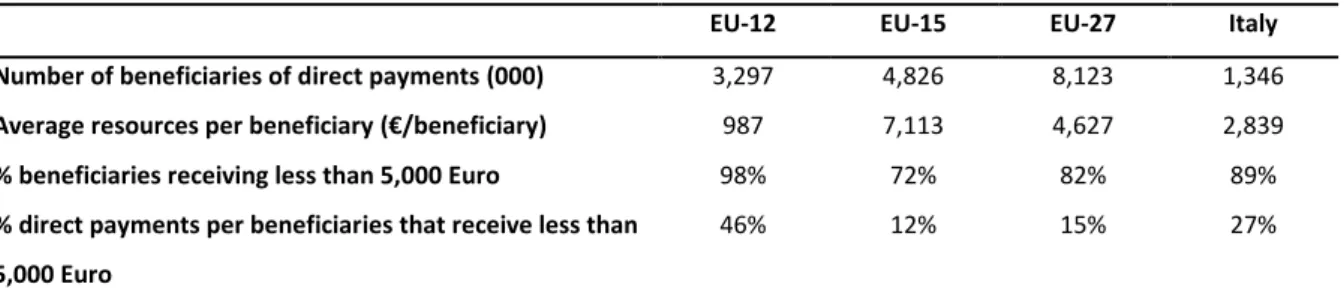
Table 3.1 – Distribution of direct aids to beneficiaries (financial year 2008)
EU-12 EU-15 EU-27 Italy Number of beneficiaries of direct payments (000) 3,297 4,826 8,123 1,346
Average resources per beneficiary (€/beneficiary) 987 7,113 4,627 2,839
% beneficiaries receiving less than 5,000 Euro 98% 72% 82% 89%
% direct payments per beneficiaries that receive less than 5,000 Euro
46% 12% 15% 27%
Source: European Commission, Report on the distribution of direct aids to the producers (financial year 2008).
The composition of EAGF expenditure in Italy greatly differs from the community average. In fact, whereas in the European Union the aids for interventions in the agricultural markets amount to 10% of the overall budget, in Italy these are equal to 20%. This high percentage is due to interventions in favour of the fruit and vegetable and wine sectors, which, in comparison to the Union, absorb on average twice the community level of expenditure.
Instead, decoupled direct aids stand at almost 70% in Italy (against an average of 75%), which translates into 4 billion Euro (2009).
Council Regulation (EC) No 73/2009 establishes annual budgetary ceilings for each Member State, assigning Italy 4.14 billion Euro in 2009, planned to increase until 2012 (and remain stable until 2015) to 4.37 billion Euro.
With regard to rural development, the resources initially assigned during the planning of the 2007-2013 period have increased in light of the effects of the compulsory modulation (2007 and 2008) and implementation of the Health Check (since 2009).
On the basis of these increments, Italy currently relies on a community aid (originating from the EAFRD – European Agricultural Fund for Rural Development) equal to approximately 9 billion Euro (equal to 9% of the total budget assigned to all Member States). This amount is further increased by an additional 8.6 billion Euro allotted to Italy for national and regional public expenditures during the 2007-2013 programming period. Therefore, the rural areas of Italy have a total availability of almost 18 billion Euro to strengthen their competitiveness (Axis I), improve environmental conditions (Axis II), increase the quality of life and provide financial aid in support of income diversification (Axis III) and support the design and implementation of local development strategies (Axis IV).
13
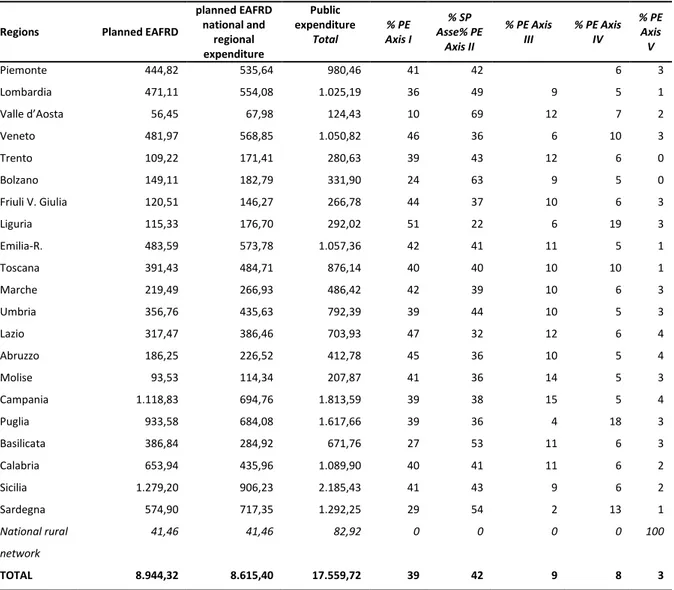
Table 3.2 – EAFRD financial resources and public expenditure by region (million Euro) and allocation by Axis (%)
Regions Planned EAFRD
planned EAFRD national and regional expenditure Public expenditure Total % PE Axis I % SP Asse% PE Axis II % PE Axis III % PE Axis IV % PE Axis V Piemonte 444,82 535,64 980,46 41 42 6 3 Lombardia 471,11 554,08 1.025,19 36 49 9 5 1 Valle d’Aosta 56,45 67,98 124,43 10 69 12 7 2 Veneto 481,97 568,85 1.050,82 46 36 6 10 3 Trento 109,22 171,41 280,63 39 43 12 6 0 Bolzano 149,11 182,79 331,90 24 63 9 5 0 Friuli V. Giulia 120,51 146,27 266,78 44 37 10 6 3 Liguria 115,33 176,70 292,02 51 22 6 19 3 Emilia-R. 483,59 573,78 1.057,36 42 41 11 5 1 Toscana 391,43 484,71 876,14 40 40 10 10 1 Marche 219,49 266,93 486,42 42 39 10 6 3 Umbria 356,76 435,63 792,39 39 44 10 5 3 Lazio 317,47 386,46 703,93 47 32 12 6 4 Abruzzo 186,25 226,52 412,78 45 36 10 5 4 Molise 93,53 114,34 207,87 41 36 14 5 3 Campania 1.118,83 694,76 1.813,59 39 38 15 5 4 Puglia 933,58 684,08 1.617,66 39 36 4 18 3 Basilicata 386,84 284,92 671,76 27 53 11 6 3 Calabria 653,94 435,96 1.089,90 40 41 11 6 2 Sicilia 1.279,20 906,23 2.185,43 41 43 9 6 2 Sardegna 574,90 717,35 1.292,25 29 54 2 13 1 National rural network 41,46 41,46 82,92 0 0 0 0 100 TOTAL 8.944,32 8.615,40 17.559,72 39 42 9 8 3
Source: elaboration on data from the Rete Rurale Nazionale (National Rural Network) – Ministry for Agriculture.
The additional EAFRD resources deriving from the compulsory modulation, wine reformation,
Health Check (HC) and Recovery Plan (Council Reg. (EC) No. 473/2009 for developing broadband
Internet infrastructures in rural areas) totalled 5.2 billion Euro for all 27 Member States, 694 million of which was allocated to Italy.
This revised amount of resources led to a review of the programming instruments that implement the rural development programme (NDP and RDP), according to complex procedures and with a noticeable organizational effort. Nevertheless, close collaboration between MiPAAF (Ministry for Agriculture) and the regions made it possible to approve the RDP by the end of December 2009 – objective not always successful for other Member States.
Looking at budgetary data, Italy appears to be lagging far behind many other Member States. The issue on programme budget, in particular, has stimulated national debate, which in many cases has
14
swayed attention from qualitative aspects. The focal issues include the selection of several regions as platform to implement various measures through integrated planning and chain projects, or the introduction of procedure innovations aimed at “solidifying” the simplification principle, etc.4.
Thematic focus
The 2010 Report continues to encompass a section on thematic focus. Last year, the Report had prepared a focus on the systems regulating high-quality Italian products (DOP and PGI) and on the assessment of credit worthiness of Italian farms. The 2010 Report contains three ad hoc studies, chosen throughout the course of a planned focus session with agricultural stakeholder. These focus themes are the competitiveness of Italian farms, production chain relations (with a specific case study on the pasta production chain), and the volatility of agricultural prices.
Agricultural competitiveness
The first thematic focus highlights the competitiveness of the Italian agricultural sector. The concept of competitiveness can be defined in various ways and the 2010 Report includes an assessment of internal enterprise performance by using the profitability parameter as proxy of enterprise competitiveness. To this avail, technical-economic information collected by the Farm Accountancy Data Network1 (FADN) in 2007 have been used. The data was re-elaborated on the basis of a specific method devised by –the Training centre for rural development economy and policy with seat in Portici, in collaboration with INEA2 within the framework of a project promoted by the local regional development agency (RDA) of the Basilicata region.
The goal of the analysis is to assess real net operating income (NOI), both in terms of overall enterprise and as expression of unitary return of the single factors of production involved. This analysis is performed by a comparison with the net income of reference. This is a standard value obtained by adding the return of each composing factor of production (land, capital and labour), which in turn is calculated on the basis of alternative sources of employment that are realistically
1
FADN, Farm Accountancy Data Network, is the instrument conceived by the EC with the goal of obtaining information on the trends of European agricultural income and the economic operation of farms. For more information consult the Reg. (EC) No. 1217 of 30 November 2009, setting up the EU FADN.
2
D. Tosco, (2010), Redditività e costi di produzione nelle aziende agricole specializzate (Profitability and operating costs in specialized agricultural holdings) www.rica.inea.it.
15
viable. With regard to 2007, the calculation criteria adopted for the return of the factors were fixed at 9 €/h for family employment, 3.6% for operating capital and 1.7% for land.
The unitary return values of the factors were used to determine:
Farm net operating income (NOI)3 that can be defined as the sum of the returns of factors of production given the quantities employed and after the reference unitary returns have been established;
Sample Net Income (SNI) mean based on a sample of farms;
Profitability Index (PI) that is obtained by the relation between NI and NRI; four classes of profitability were established in order to classify enterprises:
PI1 with PI<0.33 Low profitability
PI 2 with 0.33 <= PI < 0.66 Middle-low profitability PI 3 with 0.66<=PI < 1 Middle-high profitability
PI 4 with PI => 1 High profitability
This assessment points out the difficulties experienced by the Italian enterprises of the FADN sample. Only1/3 of these enterprises has a satisfactory real profitability, given by the fact that it is either equal or higher than compensation obtainable in alternative employment taken as example for this study. Enterprise profitability insufficiency obviously influences return of relative factors of production, mainly affecting the income of both the farmer and his family.
3
RTR_capf = RUR_capf*CAPFOND RTR_cap = RUR_cap*CAPESER RTR_lav = RUR_lav*LAVFAM
RNR = RTR_capf + RTR_cap + RTR_lav Where: RUR_capf = Sample return rate of land
RUR_cap = Sample return rate of operating capital RUR_lav = Sample compensation per hour of work RTR_capf = Total sample return of land
RTR_cap = Total sample return o operating capital RTR_lav = Total sample return of labour
RNR = Net sample operating income CAPFOND = Total amount of land owned
CAPESERC = Total operating capital owned by the farmer LAVFAM = Total of family labour (in hours)
16
Fig. 4.1 – Distribution by class of profitability– FADN sample
Profitability class N. farm Distrib. % UAA/farms Ha NI/ha € Mean PI gross of aid Mean PI net of aid Unitary return Labour € Operating capital % Land % PI 1 3,882 28.7 16.68 334.31 0.17 0.04 1.56 0.6 0.3 PI 2 3,133 23.1 23.87 718.61 0.49 0.29 4.42 1.8 0.8 PI 3 2,085 15.4 33.52 933.23 0.82 0.54 7.36 3.0 1.4 PI 4 4,434 32.8 56.69 2.240.71 2.67 2.11 22.89 12.9 4.7 Total 3,534 100.0 34.05 1,527.59 1.35 1.01 10.33 8.1 2.8 Source: BD FADN 2007.
Production chain reports on the competitiveness of the Italian agri-food sector: pasta case study
The second thematic focus regards the agri-food chain and the relations that develop among the constituting operators. In fact, throughout recent years, the agri-food theme has once again stimulated the attention of operators and policy makers for different reasons. Equal allotment of value among the economic actors, price multiplication from the agricultural phase to final sales, enhancement of national production are all aspects linked to the same general issue – efficiency of the agri-food chain, or more precisely, of the different agri-food chains that comprise the primary ad national processing systems. An efficient agri-food chain allows greater competitiveness of the finished product, which is at the basis of an equal division of value added among the different sectors; thereby, fostering economic sustainability of the various enterprises.
Analysis of the agri-food chains risks becoming sterile unless relegated to a specific sector. This is the reason for choosing a determined production chain in this Report, which will serve as a platform for other case studies. The agri-food sector of interest is pasta production. The pasta sector is one of the most important food and beverage industries. With almost 6,000 enterprises, it is the end market for 250,000 farms.
In coherency with the history and origin of the “pasta” product, Italy is the main global player of the sector, with a position of absolute leadership thanks to a market share that provides 42% of all pasta
17
food traded around the world. The most important global competitor is China, which, however, focuses on a specific segment – pre-cooked and processed pasta dishes.
Despite the significance of this sector, the economic and productive values underwent impacting reductions in 2009. Following the price boom of raw materials that brought prices to almost 500 Euro/ton in February/March 2008, the same prices took a steep fall to under 200 Euro/ton within a semester. Today, at two years from this peak, prices have not regained their foothold and now stand at about 150 Euro/ton.
In virtue of such volatility, in 2009 Italian production fell to a yield of 3.7 million tons on a UAA of 1.2 million hectares. Given the situation, durum wheat imports grew to 2.2 million tons in order to meet steady demands of post-chain phases (processing).
Box 4.1 : Supply chain data
Production of durum wheat 250,000 farms*
1.4 million hectares of UAA 4.5 million tons produced 1.5 billion Euro of value
1st Processing phase 178 mills (durum wheat)
2nd Processing phase
5,908 pasta food producers (128 are industrial pasta producers**) 6.1 billion Euro value of production Workforce approx. 30,000
National consumption (of industrial pasta only)
1,538,000 tons 26 kg per capita
“ 2007; *2008
** Having production capacity over 1 ton/day
Durum wheat import 1.9 million tons 575 million Euro of value
Pasta Food export 1.7 million tons 1.9 billion Euro of value
18
Price volatility in commodity markets
The third and final thematic focus regards price volatility in commodity markets. There will be many challenges accompanying the trend of international agricultural systems in the years to come. These include the necessity of satisfying the growing demand of food, up to contributing to the sustainability of the growth processes, by means of the improvement of environmental performance provided by farmers (struggle against climate change, water savings, production of renewable energy, protection of biodiversity and ecosystems in general).
Fig. 4.1 - Trend of global population
0 1 2 3 4 5 6 7 8 9 10 1850 1900 1950 2000 2050 2100 -0,2 0 0,2 0,4 0,6 0,8 1
Tasso incremento x decade (miliardi) Popolazione totale (miliardi)
Source: IFPRI, 2010
In this scenario, the prices of agricultural products constitute a growing reason of worry for farmers, citizens and policy makers. Only during the last three years did the phase known as “food crisis” make it appearance, which brought about significant commodity price increases, followed by negative consequences that lead to an expansion of malnourished and underfed people worldwide. Next came a second phase, which is still in progress, of brisk price decreases in correspondence with the economic-financial crisis that has deeply marked the international scene. There are different causes at the root of this phenomenon, which are interconnected and destined to exert long-term influence. Among the possible causes are population growth and the deriving growth of consumption, especially food and energy. In any case, aside from the structural aspects that concern
Increase rate (ten years) billion World polpulation (billion) billion
19
demand and offer of agricultural products, other elements bear substantial importance in the explanation behind volatility. If the sudden drop in prices registered in the last two years is due to the overbearing international economic crisis and drop in consumption that accompanies it, the boom experienced from 2007 to 2008 witnessed the interaction of many factors. The impact of some of these factors was analysed and acknowledged only after their appearance, which regard the contribution that speculation, market research and strategic reserves of product gave to price increase.