Wavelet Study of Meteorological Data Collected by
Arduino-Weather Station: Impact on Solar Energy Collection
Technology
Maria Teresa Caccamo1,a, Emanuele Calabrò1 , Antonio Cannuli1and Salvatore Magazù1
1Department of Mathematics and Computer Science, Physics and Earth Science, Messina University, Viale F. Stagno D’Alcontres, S. Agata, Messina, Italy
Abstract. Meteorological data collected by an automated LSI Lastem weather station
connected with an Arduino device for remote acquisition are reported and discussed. Weather station, located at 38° 15’ 35.10’’ N latitude and 15° 35’ 58.86’’ E longitude, registered data which were analysed by wavelet transform to obtain time-frequency characterization of the signals. Such an approach allowed to highlight the correlation existing among the registered meteorological data. The results show a positive correlation between the minimum temperature and the maximum temperature values whereas a negative correlation emerges between daily rainfall and minimum temperature values as well as for daily rainfall and maximum temperature values. These results suggest the possibility to estimate the global and diffuse solar radiation using more reliable climatologic parameters for optimizing solar energy collected by solar panels.
1 Introduction
The photovoltaic technology is considered well-suited technology, particularly for distributed power generation. The literature provides that solar power supplied by the modules depends on many extrinsic factors, such as insolation levels, temperature, load conditions and orientation of the panel. In particular, meteorological parameters used as predictors include the amount and distribution of clouds or other observations such as the fractional sunshine and water content [1,2]. Some variables can be changed to maximize the solar energy acquired by the panel. In fact, the design of a solar energy module involves complex tradeoffs due to the interaction of several factors such as the characteristics of the solar cells, power supply requirements and power management features of the embedded system, application behavior, inclination and orientation of the panel, geographical latitude. In particular, various optimum tilt angle values as a function of geographical latitude were provided in literature for fixed solar panels [3-9]. The significant disagreement among these values may be due to the different algorithm used for the determination of the optimum slope of a solar panel and the different empirical models that were used for the determination of diffuse solar radiance. Indeed, the diffuse solar component is the most difficult quantity to determine, because the distribution of the sky-diffuse radiance strictly depends on the local condition of the sky and the most considerable cause of
error in the computation of the optimum tilt and orientation of a solar panel depends on the model of diffuse solar radiation which is used [10].
Meteorological data from all parts of the world are needed to know the horizontal global solar radiation, and for some regions, measured data may only be applied within a radius of about 50 km from weather stations. This circumstance lead to interpolate parameters between stations.
Some empirical models for estimating the diffuse solar radiation have to be used to obtain the solar radiation impinging on a tilted surface so that the relationship between the global solar irradiation on horizontal planes and that on tilted planes can be evaluated [11-15]. Nevertheless, the large uncertainties regarding climatological parameters appearing in these empirical models suggest us to search more reliable parameters.
Meteorological data study is generally used for the environmental monitoring, in particular for weather forecasts, to analyze air pollution and to give useful information for farmers, for alternative energies, such as photovoltaic and wind systems, to establish their correct position and for all actions and processes required to monitor and characterize the environment quality [16]. It follows several standards for climatic observations, for the selection of the sites, accuracy and specifications, for the weather station installation and calibration and data interpretation developed by the World Meteorological Organization (WMO) [17]. In general, automated weather stations, such as LSI-LASTEM station, are meteorological stations, which perform climatic observations and data transmission automatically, with a specifically microcontroller, such as Arduino. Measurements, read out by a central data acquisition unit, are more reliable and can be performed much more frequently compared to human weather observations.
In general, it is possible to classify meteorological data acquisition systems in real time and no real time weather stations. The first record data at a precise time and on particular request, established by the user, that are very important in emergency conditions and help to monitor all critical warning states (tide and river levels, storms). The second are offline stations that provide data on data storage devices.
In order to analyze the meteorological parameters collected by an Arduino-weather station system, such as maximum and minimum temperatures and the total daily rainfall, for the year 2014, a Discrete Wavelet Transform (DWT) has been employed. From this analysis it is possible to correlate the meteorological parameters, what it emerges is a positive correlation between the maximum temperature and the minimum temperature values, and a negative correlation between daily rainfall and maximum temperature values, as for daily rainfall and minimum temperature values [18].
This methodology can be used in the near future to obtain more reliable climatological parameters to estimate better the diffuse solar radiation.
2 Data Engineering Acquisition System: Arduino-Weather Station
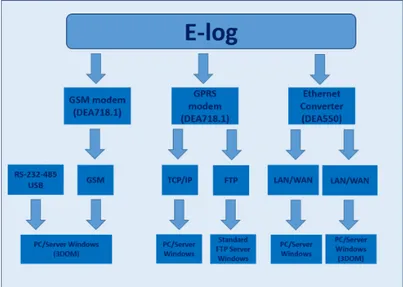
The data were carried out by a LSI LASTEM weather station, integrated by a microcontroller for the remote connection, that allows to register typical meteorological parameters such as temperature, wind speed and direction relative humidity, barometric pressure, solar radiation and rainfall [19]. More precisely, it has been employed the MODBUS protocol to establish a communication between the weather station and the microcontroller to read and write the data [20,21]. In Fig. 1 a sketch of an environmental data logger (E-log) communications protocol is reported.
3 Wavelet Results Data Analysis
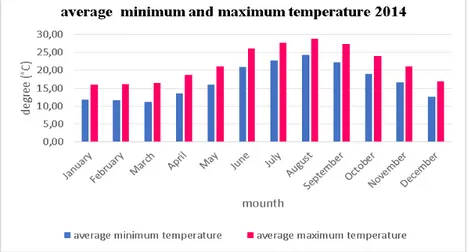
In the last years wavelet transforms find a lot of various applications in numerous field such as physics, meteorology, engineering, mathematics, and spectroscopic data analyses [22-27]. Differently from Fourier transform, the wavelet analysis allow to highlight which frequencies are present and where, or at what scale, they are. Furthermore, the wavelet transform allows to decompose the registered signal into its wavelet components by means of a set of translated and scaled of mother functions [28]. The meteorological data has been collected by means of a meteorological station situated at 38° 15’ 35.10’’ N latitude and 15° 35’ 58.86’’ E longitude, i.e. Messina University; and then, the registered meteorological quantities, i.e. maximum temperature, minimum temperature and total daily rainfall for the year 2014 has been analyzed through the Discrete Wavelet Transform (DWT). It’s well known that Messina's temperature is moderated by the warm Mediterranean sea, with dry summers and wet winters, and its location in proximity to the equators. In Fig. 2, the average of minimum temperature and the average of maximum temperature for the year 2014 are shown. It clearly emerges that the warmest month is August, with a value 28,90° and the coolest months is March, with a value 11,22 °C.
Figure 2. Average minimum temperature and average maxima temperature for the year 2014 (see the text for
details).
The annual precipitation in Messina are due to the alternating jet streams in the Mediterranean, Fig. 3 reports the total annual precipitation averages for Messina in the year 2014. As it can be seen, November is the wettest month (12,54 cm) and August is the driest month (0,24 cm).
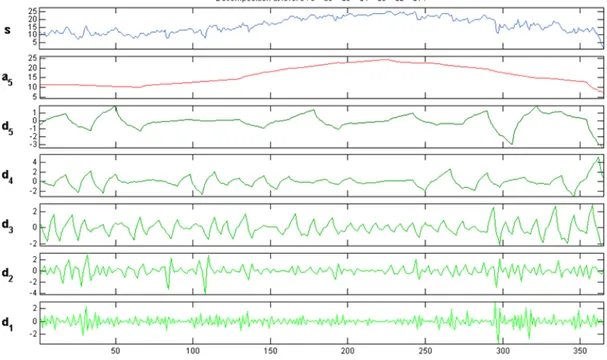
In order to investigate meteorological parameters, the Symlet Wavelet was taken into account. More specifically the Symlet wavelet allows to decompose the analyzed signal into approximation coefficient, that represent the low frequency of the signal and into detail coefficients which correspond to the bands of higher frequencies, as shown in Fig. 4.
Figure 4. Decomposition of the signal into approximation (a1, a2, a3, a4, and a5) and detail (d1, d2, d3, d4, and
d5) coefficients.
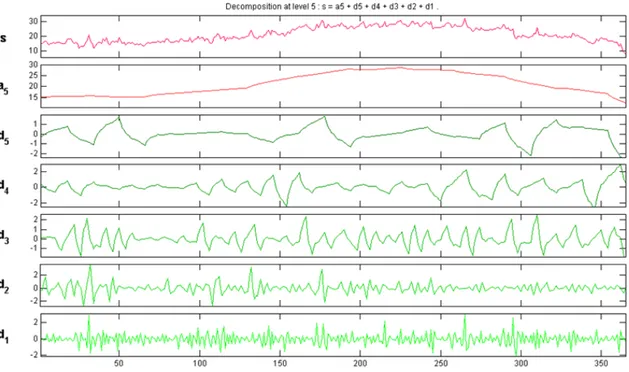
Using Matlab Wavelets Toolbox, it has been possible to make, by means of Symlet wavelet transform at level 5 , the decomposition of minimum temperature, maximum temperature and total daily rainfall [29,30]. Figg. 5-7 report the analysis of investigated signals: at the top the input investigated meteorological parameter, the second raw represents the approximation coefficient: a5 which is connected to the general parameter trend, and finally the details coefficients: d1, d2, d3, d4 and d5 take account of the hifher frequencies [31].
Figure 6. Decomposition of maximum temperature data by means of the mother wavelet Symlet at level 5.
Figure 7.Decomposition of rainfall data by means of the mother wavelet Symlet at level 5.
From such an analysis, it emerges a positive correlation between maximum temperature and minimum temperature for the year 2014, due to a similar behavior for the two quantities: the approximation and the detail coefficients as a function of time are in most the cases each other in phase. On the other hand, since the approximation and the detail coefficients as a function of time are in most the cases each other out-of-phase, between daily rainfall and minimum temperature as well as between daily rainfall and maximum temperature negative correlations emerge [32,33].
In this paper DWT was applied to data registered by means of the LSI-LASTEM interconnected to a microcontroller for remote data aquisition. The analysis, performed through the mother wavelet Symlet shows a positive correlation, for the year 2014, between the minimum and maximum temperature parameters. On the contrary, a negative correlation between rainfall and maximum temperature as well as between rainfall and minimum temperature is registered. The employed methodology can be used to collect climatological parameters with the aim of studying more reliable empirical models to better estimate the diffuse solar radiation and hence to optimize solar radiation collection technology.
References
1. ASHRAE handbook: HVAC applications (Atlanta (GA): ASHRAE, 1999). 2. M. Iqbal, Sol. Energy 20, 101 (1978)
3. J.I. Yellott, ASHRAE J. 15, 31 (1973)
4. P. J. Lunde, Solar Thermal Engineering: space heating and hot water systems (J. Wiley and Sons, New York, 1980)
5. G. Lewis, Sol. Wind Technol 4, 407 (1987)
6. H. P. Garg, Advances in Solar Energy Technology (Reidel, Boston, 1987) 7. G. Qiu, S. B. Riffat, Int. J. Ambient Energy 24 13 (2003)
8. E. Calabrò, J. Ren. Sust. Energy 1, 033104 (2009) 9. E. Calabrò, Smart Grid Ren. Energy 3, 253 (2012)
10. E. Calabrò, J. Ren. Energy, 2013, Article ID 307547, 12 pages, (2013) 11. B.Y.H. Liu, R.C. Jordan, Sol. Energy 4, 1 (1960)
12. R. Perez, P. Ineichen, R. Seals, Sol. Energy 44, 271 (1990) 13. L. Robledo, A. Soler, Energy 23, 193 (1998)
14. F.J. Olmo, J. Vida, I. Foyo, Y. Castro Diez, L. Alados-Arboledas, Energy 24, 689 (1999) 15. L. Wenxian, G. Wenfeng, P. Shaoxuan, L. Enrong, Energy, 20, 723 (1995)
16. G. Booch, C. Robert, M. J. Newkirk, Case Study: Weather Station in Object Oriented Analysis
and Design with Applications (2d. ed. 1998)
17. R. Artz, G. Ball, K. Behrens, et al. “Geneva: World Meteorological Organization” Measurements
at Automatic Weather Stations(WMO-No. 8, 2nd ed., 2010)
18. K. M Lau, H. Weng, Bull. Am. Meteo. Soc. 76, 2391 (1995)
19. G. Hoogenboom, D.D Gresham, Auto weather station network , Proc. of the Georgia water resource Conference. Athens, 1, 483 (1997)
20. K. Montgomery, K. Chiang, A New Paradigm for Integrated Environmental Monitoring, ACM International Conference Proceeding Series (2010).
21. Y. Zhengtong, Z. Wenfeng, The research of environmental pollution examination system based on the Cloud Computing, International Conference on Communication Software and Networks, 514 (2011)
22. S. Magazù, F. Migliardo, M.T. Caccamo, J.Phys. Chem. B, 116, 9417 (2012)
23. S. Magazù, F. Migliardo, B.G. Vertessy, M.T. Caccamo, Chem. Phys, 424, 56 (2013) 24. F. Migliardo, M.T. Caccamo, S. Magazù, J. Non Crys. Solids, 378, 144 (2013) 25. F. Migliardo, M.T. Caccamo, S. Magazù, Food Biophys. 9, 99 (2014)
26. S. Magazù, F. Migliardo, M.T. Caccamo, Adv. Mat. Science Eng. 2013, 1(2013)
27. F. Migliardo, M.T. Caccamo, S. Magazù, Int. J. Adv. Comp. Science & Appl. 5, 50 (2014) 28. S. G. Mallat, IEEE Trans. Pattern Analysis, 2, 674 (1989)
29. R. Singh, R. E. Vasquez, R.Singh, Visual Inf. Proc. 6, 151 (1997) 30. S. Kumari, R. Vijay, ACIJ, 3, 137 (2012)
31. E.A. Robinson, S. Treitel, Geophysical Signal Analysis (Prentice-Hall, New Jersey, 1980) 32. P. Kumar, E. Foufoula-Georgiou, Rev. Geoph. 35, 385 (1997)