ENERGY TRANSITION FOR THE
DECARBONISATION OF URBAN NEIGHBORHOODS:
A CASE STUDY IN SEVILLE, SPAIN
RICCARDO M. PULSELLI1, MATTEO MACCANTI1, MADELYN MARRERO2, ANDY VAN DEN DOBBELSTEEN3, CRAIG MARTIN4 & NADIA MARCHETTINI1
1Ecodynamics Group, Department of Physical, Earth and Environmental Sciences, University of Siena, Italy 2School of Building Engineering, University of Seville, Spain
3Department of Architectural Engineering and Technology, TU Delft, The Netherlands 4School of Art, Design and Fashion, University of Central Lancashire, UK
ABSTRACT
A method of greenhouse gas inventory has been developed for evaluating the environmental implications of civilian life, in terms of carbon emission, according to citizens’ behaviour and to the condition of buildings, local infrastructures and services. The assessment focuses on energy use for housing, mobility, impacts of waste and water management. All factors refer to different spatial scales, ranging from the regional, urban neighbourhood, right through to the single-family household. Based on site-specific data, carbon accounting has been performed in Seville, firstly focussing on the provincial scale, then on the urban neighbourhood of Barrio Tiro de Línea. Both quantitative information and a uniquely citizen-centred method of visual result representation have been provided and taken as a starting point for planning an energy transition and decarbonisation scenario. The graphical outcomes allow the selection of a series of carbon footprint mitigating measures to be potentially accomplished in the medium–long term. The procedure was tested during the City-Zen Roadshow, as part of the European Union FP7 City-Zen Project, and demonstrated a powerfully communicative and easily implementable method to inform policy makers and citizens, to raise awareness on real energy transition potentials and to address choices for decarbonisation.
Keywords: carbon accounting, carbon footprint, decision support system, forestland grabbing. 1 INTRODUCTION
More than 74% of European inhabitants live in cities, and in the next few years this number will increase; projections say that by 2050 the population living in urban areas will increase by around 2.5 billion people [1]. Cities are, and will increasingly become, strategic places to accomplish a real energy transition to renewables. To enable the creation of modern, smart and sustainable cities, decision-makers, businesses, knowledge institutions and citizens are called to an intensive cooperation at different scales: single citizens, families, local communities (from streets to neighbourhoods, to the whole city) should play a role in creating a more comfortable, liveable, healthier, happier and sustainable built environment through participative design processes and widely shared actions.
The European Union has an ambitious policy to reduce greenhouse gas emissions, in compliance with the COP 21 and the Paris Agreement signed by 195 nations [2]. The goal of the European Union is to reduce greenhouse gas emissions by 80% by 2050, and numerous initiatives have been launched in European cities to achieve this goal. For example, amongst others, Copenhagen has the ambitious goal to be the first carbon neutral capital by 2025, and the municipality of Amsterdam plans to be climate neutral, reducing its CO2 footprint by 40% in 2025.
This study is based on the experience of a series of onsite intensive co-creative events or “City-zen Roadshows” organised within the framework of the City-Zen Project. Funded by the European Commissions within the FP7-Energy-Smartcities-2013 program, the main goal of the City-Zen Project (2014–2019) is to realise the large-scale implementation of new
solutions and smart urban technologies to pave the way towards energy transition in European cities. During the project, two demonstration sites have been developed in Amsterdam and Grenoble, while a series of workshops, namely City-Zen Roadshows, are taking place in European cities – including Belfast, Izmir, Dubrovnik [3], Menorca, Seville, Roeselare, and soon to be Preston (UK), Bucharest and Nicosia – to kick-off their own decarbonisation plan. The workshops involve a team of international experts in the field of energy planning and urban design that, together with local stakeholders (public officers, researchers, students and citizens), within five days, after field visits and co-creative “fun-shop” sessions, finally deliver a coherent vision – an action plan for decarbonisation. The present study was completed during the City-Zen Roadshow in Seville, from 20 to 24 November 2017. This paper presents the results from the roadshows’ carbon accounting investigations, the resulting carbon footprint being the baseline to plan a sequence of carbon footprint mitigation actions and hypothesize a possible pathway to the carbon-neutral status [4].
2 MATERIALS AND METHODS
The procedure of greenhouse gas inventory is based on the 2006 Intergovernmental Panel on Climate Change (IPCC) Guidelines for National Greenhouse Gas Inventories [5]. It refers to previous applications to sub-national systems [6] and urban systems [7] and it has been specifically developed during each roadshow to be quickly implemented; and even though it is based on assumptions and approximations, it should provide credible and realistic results. The assessment has been performed in reference to different spatial scales, from the provincial level to the single-family household (to the individual citizen), taking into account four main sectors of activities: housing, mobility, waste and water management. It aims to provide a comprehensive assessment of the current state in terms of greenhouse gas emissions, analyse the impact of different emission sources and finally figure out possible scenarios for decarbonisation.
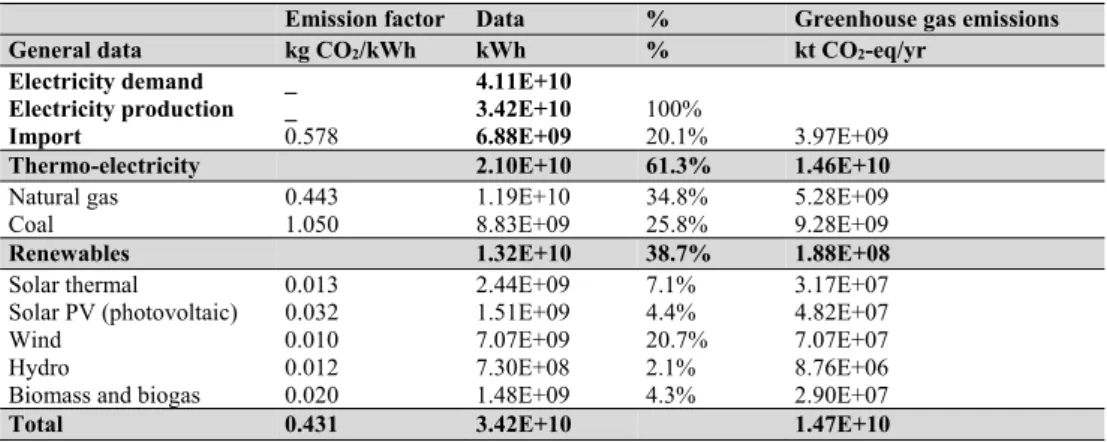
Most of the emission factors (EF; kg CO2-eq/unit process) used in the assessment are taken from the 2006 IPCC guidelines, except for electricity. Considering the crucial role of electricity use in energy policies, the specific EF (kg CO2-eq/kWhe) has been assessed as an initial step in the procedure for the Andalusian region, based on the regional electricity grid mix; i.e. 61.3% thermoelectricity from fossil fuels and 38.7% renewables [8]. As a result, the EF for electricity in Andalusia assessed and used during the roadshow was 0.431kg CO2-eq/kWh.
Table 1: Assessment of the emission factors for the electric grid mix of Andalusia.
Emission factor Data % Greenhouse gas emissions General data kg CO2/kWh kWh % kt CO2-eq/yr
Electricity demand _ 4.11E+10
Electricity production _ 3.42E+10 100%
Import 0.578 6.88E+09 20.1% 3.97E+09
Thermo-electricity 2.10E+10 61.3% 1.46E+10
Natural gas 0.443 1.19E+10 34.8% 5.28E+09
Coal 1.050 8.83E+09 25.8% 9.28E+09
Renewables 1.32E+10 38.7% 1.88E+08
Solar thermal 0.013 2.44E+09 7.1% 3.17E+07
Solar PV (photovoltaic) 0.032 1.51E+09 4.4% 4.82E+07
Wind 0.010 7.07E+09 20.7% 7.07E+07
Hydro 0.012 7.30E+08 2.1% 8.76E+06
Biomass and biogas 0.020 1.48E+09 4.3% 2.90E+07
The EFs have been used for assessing the intensity of greenhouse gas emissions based on the inventory of site-specific data. Most of the data were available at the provincial level, mainly referring to the Agencia Andaluza de la Energia. Table 2 presents the statistical data, the EFs used and the value of carbon emissions in kg CO2-eq per single item and sector of activity for the Province of Seville (1,941,480 inhabitants; 14,036 km2).
Table 2: Carbon accounting of the Province of Seville. Emission actors in kg CO2-eq/unit. Emission sources Raw data Unit Emission factor CF (t CO2-eq)
Industry (for energy use) 4,740,388,000 kWh _ 1,411,892
Coal 8,141,000 kWh 0.292 2377 Natural gas 1,761,945,000 kWh 0.252 444,010 Diesel 24,423,000 kWh 0.281 6863 Fuel oil 102,344,000 kWh 0.268 27,437 LPG 58,150,000 kWh 0.263 15,293 Other petroleum 807,122,000 kWh 0.281 226,801
RES (biomas + biogas) 377,975,000 kWh 0 0
Electricity 1,600,288,000 kWh 0.431 689,110
Housing 4,996,248,000 kWh _ 1,697,569
Natural gas 345,411,000 kWh 0.252 87,044
Diesel 182,591,000 kWh 0.281 51,308
LPG 650,117,000 kWh 0.263 170,981
RES (biomas + thermosolar) 594,293,000 kWh 0 0
Electricity 3,223,836,000 kWh 0.431 1,388,237 Transport 10,882,191,000 kWh _ 2,958,278 Natural gas 131,419,000 kWh 0.252 33,118 Diesel 7,572,293,000 kWh 0.285 2,158,104 LPG 17,445,000 kWh 0.263 4588 Kerosene 1,007,158,000 kWh 0.266 268,254 Fuel 1,673,557,000 kWh 0.275 460,160
RES (biodiesel + bioethanol) 401,235,000 kWh 0 0
Electricity 79,084,000 kWh 0.431 34,055
Services 2,756,310,000 kWh _ 1,080,659
Natural gas 252,371,000 kWh 0.252 63,597
Diesel 36,053,000 kWh 0.285 10,275
LPG 13,956,000 kWh 0.263 3670
RES (biomas + biogas) 124,441,000 kWh 0 0
Electricity 2,329,489,000 kWh 0.431 1,003,116
Primary sector 1,843,355,000 kWh _ 540,753
Natural gas 143,049,000 kWh 0.252 36,048
Diesel 1,337,450,000 kWh 0.285 381,173
LPG 6,978,000 kWh 0.263 1835
RES (biodiesel + bioethanol) 73,269,000 kWh 0 0
Electricity 282,609,000 kWh 0.431 121,696
Waste (443 kg/cap yr) 860,076 t _ 210,404
Landfill (17.9%) 153,868 t 1.16 178,486
Waste-to-energy (0.4%) 3440 t 0.652 2243
Organic-to-compost (37.9%) 326,098 t 0.091 29,675
Recycled (44.2%) 380,110 t 0 0
Water (112 L/cap day) 79,367,702 m3 _ 46,430
Total _ _ _ 7,945,986
In order to assess the carbon footprint of the Tiro de Línea neighbourhood, a typical household in Seville District Sur has been profiled: on the one hand, data on energy use in the residential sectors were scaled down from the provincial level based on population and number of families/households (2.6 inhabitants per family/household in Seville District Sur [9]); on the other hand, details on energy use for heating, domestic hot water (DHW), cooling and other utilities (cooking, lighting, appliances) have been estimated based on published data on building energy demand in Spain [10]. Data on mobility per single household were estimated by referring to the average commuting distance in the neighbourhood and private car use (1.23 cars/family in District Sur [9]) based on a survey by the University of Seville (avg. 30 km commuting distance/working day and additional 10 km daily life travel/day). Data on waste were estimated starting from the waste production per capita (443 kg/yr per cap. in Spain) [11] and the current waste management system. Water management is estimated based on water use per capita (112 L/day per cap.) [12]. The methodology, therefore, allowed for profiling the typical household in the neighbourhood as a functional unit for assessing the impact of the Barrio Tiro de Línea (5364 households) and the mitigation scenario. Table 3 presents the data, EFs used and carbon emission values in kg CO2-eq per household.
Table 3: Carbon accounting of a typical household in Seville District Sur.
Emission sources Raw data Unit EF kg CO2-eq % CF
Housing 6,599 kWh _ 2,780 55.7%
Heating (natural gas) 233 kWh 0.252 208 4.2%
Heating (diesel) 123 kWh 0.281
Heating (LPG) 438 kWh 0.263
Heating (biomas + thermosolar) 400 kWh 0
DHW (natural gas) 224 kWh 0.252 200 4.0%
DHW (diesel) 118 kWh 0.281
DHW (LPG) 421 kWh 0.263
DHW (biomas + thermosolar) 385 kWh 0
Electricity (cooling) 3151 kWh 0.557 1755 35.2%
Electricity (lighting + appliances) 1107 kWh 0.557 617 12.4%
Transport (diesel) 11,074 km 0.169 1872 37.5%
Waste (443 kg/cap yr) 1136 t _ 278 5.6%
Landfill (17.9%) 203 t 1.16 236 4.7%
Waste-to-energy (0.4%) 5 t 0.652 3 0.1%
Organic-to-compost (37.9%) 431 t 0.091 39 0.8%
Recycled (44.2%) 502 t 0 0 0.0%
Water (112 L/cap day) 105 m3 0.585 61 1.2%
Total _ _ _ 4991 100%
3 RESULTS
The carbon accounting procedure focuses on different spatial scales. Outcomes show that the carbon footprint for the Province of Seville (14,036 km2 area; 1,941,480 inhabitants) is almost 7,946,000 t CO2-eq/yr. In order to clearly communicate this result, the amount of greenhouse gases have been expressed in terms of forestland grabbing, an equivalent surface of forest that would be needed to absorb carbon emissions generated within the area. The forestland grabbing for the Province of Seville corresponds to almost 5886 km2.
The average dwelling, taken as the functional unit for the District Sur, shows an emission of 4.99 t CO2-eq/yr per single household, including energy, mobility, waste and water management. This value depends on a relatively low energy demand for space and water heating (around 8%) and high electricity demand (48%), especially for cooling (35%). The use of private cars for commuting covers the 37% of emissions. This has been estimated by referring to working days commuting by passenger cars (avg. 30 km/working day + 10 km/day; given 1.23 private cars per household in District Sur) and does not consider other forms of travel. Waste management is responsible for 6% of emissions, and water use for more than 1%. For a better understanding, the impact of a single household can be potentially compensated by the carbon uptake of 0.37 ha forestland. This corresponds to a size that is almost equal to the area of a football field (0.4 ha).
Starting from the carbon footprint of one single household, which is assumed as average for the Barrio Tiro de Línea, greenhouse gas emissions were estimated for the 5364 households in the neighbourhood. The carbon footprint of the neighbourhood is, therefore, about 26,770 t CO2-eq/yr, which corresponds to an equivalent forestland for carbon uptake of 1983 ha. Fig. 1 shows the forestland grabbing in a map compared to the size of the neighbourhood (same reference scale). The colours in the map show the contribution of different sectors.
Figure 1: Spatial representation of the forestland grabbing of the Barrio Tiro de Línea.
ELECTRICITY HEAT ENERGY MOBILITY WASTE WATER 1 km 25ha
4 DISCUSSION
The assessments and representations above were presented and discussed with local facilitators, researchers and stakeholders during the City-Zen Roadshow in Seville. The carbon accounting method works as a mediating model that offers the opportunity to quickly discern an integrated vision of the city of the future, combining technologies with other measures at the scales of the neighbourhood, household and citizen. For example, energy experts and urban designers suggested and discussed integrated schemes for implementing technological solutions in buildings. Fig. 2 is a cross-section of the Tiro de Línea decarbonisation plan, showing vertical collectors with heat pumps, photovoltaic (PV) roofs, small wind turbines, green façades, a communal heat and cold storage with a grid in the central area, and water cisterns and squares.
The carbon accounting model provides the opportunity to systemically evaluate the effects of different solutions and the actions planned. The main objective is to provide a visual representation of the impact of the neighbourhood in terms of equivalent forestland and see how the designed measures can contribute to decrease the carbon footprint towards a zero-carbon community.
Fig. 3 shows the effect of a possible sequence of 14 measures selected among the designed solutions to demonstrate the reliability and feasibility of a potential scenario of decarbonisation. The measures are as follows:
0. Current state: this shows the carbon footprint of the neighbourhood in terms of equivalent forestland (each square represents 25 ha).
1. Passive systems: greening, shading, low emission paint (hypothesized 20% houses involved). Expected effect: –50% cooling energy (–1700 MWhe).
2. Thermal insulation: roof/façade retrofitting (30% houses involved). Expected effect: –50% cooling energy (–2500 MWhe); –75% heating energy (–1500 MWh). 3. Behavioural changes: energy saving, e.g. LED lights, efficient appliances (80%
houses involved). Expected effect: –50% electricity for lighting and appliances (–2400 MWhe).
4. Heat pump (household scale): 30% houses involved. Expected effect: –75% heating (–1500 MWh); –75% DHW (–1400 MWh); + electricity use (+710 MWhe). 5. Heat pump (neighbourhood scale): 60% houses involved. Expected effect: –75%
heating (–2900 MWh); –75% DHW (–2800 MWh); + electricity use (+1400 MWhe). 6. PV panels (building block scale): 35% houses involved. Expected effect: –100%
electricity demand (8000 MWhe produced).
7. Electric bike sharing: –15% private car use. Effect: –100% fuel; + electricity use for electric mobility (+270 MWhe).
8. Bike to school/work: –30% private car use. Effect: –100% fuel.
9. PV panels sharing (neighbourhood scale): 40% houses involved. Effect: –100% electricity demand (10,000 MWhe produced).
10. Tram line (district Sur scale): –20% private car use. Effect: –100% fuels.
11. Transition to electric mobility: 38% electric cars. Effect: –100% fuel; + electricity use for electric mobility (+2200 MWhe).
12. Renewable energy generation at street scale, e.g. PV canopy: 2400 MWhe produced. 13. Differentiated waste (avoided landfill): 100% house. Effect: –80% waste-to-landfill. 14. Urban forestry for compensation of remaining impacts, i.e. 71 ha.
Figure 2: Cross-section of the Barrio Tiro de Línea with a set of designed technologies.
(Sketch by the author, van den Dobbelsteen.)
Figure 3: Forestland crunching through 14 carbon footprint mitigation measures for the Barrio Tiro de Línea (bottom-left red polygon in scale) in Seville.
The carbon accounting procedure, developed over each roadshow to be easily and quickly communicated, implemented and replicated, provides a reliable ex-ante evaluation of urban design measures. Measures are proposed at all scales of the sustainable city, i.e. the region, neighbourhood, building or single household, as well as the individual citizen. It provides quantitative information and visual representations, to support creative and innovative design, and, more significantly, to raise awareness of the carbon challenges ahead and the solutions available to meet them.
For increasing attractiveness, the graphic representation simulates the Pac-Man game, where the Pac-Man eats squares of forestland (25 ha each) due to energy saving, renewable energy production or other avoided emissions. As far as additional energy inputs are required, the ghost appears to add new squares such as, for example, when the use of heat pumps support the heating demand through renewable energy by using electricity (in measures 4 and 5, Pac-Man eats orange squares but new blue squares appear) or in the case of a transition to electric mobility (in measure 11, Pac-Man eats purple squares but new blue squares appear). A consistent electricity generation from renewable sources can contribute to support the electricity demand and let the Pac-Man move forwards.
Carbon mitigation accounting, and its representation through the Pac-Man game, has been developed as a communication tool to help facilitate audience understanding and its appeal. Accumulated experiences, feedback and outcomes of previous roadshows continue to demonstrate the importance of a collective and participative process in carbon evaluation, in which all city stakeholders, irrespective of their scientific background, understand and trust the math. Once the impact of carbon usage is appreciated from an individual citizen perspective, that usage can be extended to the city scale and beyond. From this vantage point, the idea of a zero-carbon city is seen by stakeholders as a vital and realisable goal.
5 CONCLUSIONS
The City-Zen Roadshow, held in Seville, has followed a co-creational process involving international experts on city energy transition and urban design and local stakeholders, together with researchers of the University of Seville. Conceived as an open onsite living lab, it aimed at assessing the impact of the Barrio Tiro de Línea in terms of greenhouse gas emissions and evaluating a potential decarbonisation scenario. In particular, within the limited timeframe of 4 days (presenting the results on day 5), the city and the selected district have been visited, studied and provided with solutions over a wide range of aspects. The results concern the carbon footprint of a single household (2.6 person/family in District Sur; 4.99 t CO2-eq/yr emission) and the neighbourhood (almost 14,000 inhabitants; 26,800 t CO2-eq/yr emission) and have been represented in terms of forestland grabbing. The area covered by forest that would be needed to absorb the emissions of every single dwelling (0.37 ha) is equivalent to a football field. To propose that such a backyard would be necessary to compensate for the yearly impact of dwellers is quite a step, but this co-creational and highly graphical approach guides stakeholders through the various stages in such a way that they understand, trust and contribute to the solutions, raising awareness on climate issues and demonstrating that a net zero-carbon plan is possible.
ACKNOWLEDGEMENTS
The present study was developed during the City-Zen Roadshow in Seville among the tasks of the City-Zen Project, which has received funding from the European Union’s Seventh Programme for research; technological development and demonstration under grant agreement number 608702.
REFERENCES
[1] United Nations, 2018 revision of world urbanization prospects.
https://www.un.org/development/desa/publications/2018-revision-of-world-urbanization-prospects.html.
[2] European Commission, Policies, information and services; Paris Agreement, 2018. https://ec.europa.eu/clima/policies/international/negotiations/paris_en.
[3] van den Dobbelsteen, A., Martin, C.L., Keeffe, G., Pulselli, R.M. & Vandevyvere, H., From problems to potentials – the urban energy transition of Gruž, Dubrovnik.
Energies, 11(4), p. 922, 2018.
[4] City-Zen Project, City-Zen: new urban energy, 2018. http://www.cityzen-smartcity.eu/ home/about-city-zen/objectives/.
[5] IPCC, 2006 IPCC guideline for national greenhouse gas inventories, IGES: Japan, 2016.
[6] Bastianoni, S., Marchi, M., Caro, D., Casprini, P. & Pulselli, F.M., The connection between 2006 IPCC GHG inventory methodology and ISO 14064-1 certification standard – A reference point for the environmental policies at sub-national scale.
Environmental Science and Policies, 44, pp. 97–107, 2014.
[7] Marchi, M., Niccolucci, V., Pulselli, R.M. & Marchettini, N., Environmental policies for GHG emissions reduction and energy transition in the medieval historic centre of Siena (Italy): the role of solar energy. Journal of Cleaner Production, 185, pp. 829–840, 2018.
[8] Agencia Andaluza de la Energia – Consejería de Empleo, Empresa y Comercio, Datos Energéticos de Andalucía 2016. https://www.agenciaandaluzadelaenergia.es/es/
documentacion/tipo-de-documento/informes-y-estudios/datos-energeticos-de-Andalusia-2016.
[9] Ayuntamiento de Seville, Anuario Estadístico De La Ciudad De Seville 2016. https://www.Seville.org/ayuntamiento/competencias-areas/area-de-hacienda-y-administracion-publica/servicio-estadistica/atribuciones-del-servicio/anuarios/2016. [10] IDAE General Secretary Planning and Studies Department, Analysis of the energy
consumption of the household sector in Spain, Eurostat, Ministerio de Industria Turismo y Comercio, IDAE, 2011.
[11] Eurostat Statistics Explained, Municipal waste statistics, 2018. http://ec.europa.eu/ eurostat/statistics-explained/index.php/Municipal_waste_ statistics.
[12] Empresa Metropolitana de Abastecimiento y Saneamiento de Aguas de Seville (EMASESA), Memoria Responsabilidad Social Corporativa 2014. http://www.emasesa.com/wp-content/uploads/2013/12/BAJA-EMASESA-2014.pdf.