1
geografiche in Italia
Antonella D’Agostino, Giulio Ghellini, Sergio Longobardi
Abstract Using a micro-dataset of Italian students enrolled at university for the first
time in 2008 and derived from the Anagrafe Nazionale degli Studenti (ANS), we model internal student mobility as a function of both individual-level and territorial characteristics. We use multilevel modelling to explicitly account for the hierarchical nature of our data (students nested within Italian districts - NUTS-3 geographic aggregation level) and to understand whether there are significant variations in mobility patterns within and between districts. District differences in student mobility remain significant even after controlling for individual characteristics: this result confirms that the geographical dimension is relevant for student mobility.
Abstract Sulla base dei micro dati relativi alla coorte di immatricolati alle università italiane nel 2008, si analizza la mobilità studentesca tra le diverse aree territoriali del nostro paese come funzione di caratteristiche individuali e territoriali. Viene proposto un approccio multilivello in grado di tener conto della struttura gerarchica dei dati, visto che gli studenti sono “naturalmente” aggregabili all’interno delle aree geografiche di appartenenza (NUTS-3), e di analizzare i meccanismi/percorsi di mobilità all’interno e tra le diverse aree geografiche del Paese. Le differenze di mobilità degli studenti rimangono significative anche dopo aver controllato per le caratteristiche individuali osservate: tale risultato conferma che la dimensione geografica è rilevante nello spiegare la mobilità degli studenti. Key words: Students mobility, multi-level logistic regression, geographical disparities
1
Giulio Ghellini, University of Siena; email: [email protected]
Antonella D’Agostino, University of Naples Parthenope, e-mail: [email protected] Sergio Longobardi, University of Naples Parthenope, email: [email protected]
1 Introduction
In the last ten years, students' enrolment at Italian universities has decreased significantly especially after the economic crisis of 2008, while the students' migration from the South to the Central and Northern regions of the country has increased (Cammelli and Gasperoni, 2015). The empirical literature in higher education widely stressed the relevant role played by universities to local development. Moretti (2004) suggested that the increase in the share of graduates in the labor force leaded to an increase in productivity and wages for all workers. Salter and Martin (2001) noted that universities create knowledge and then they contribute to local innovation process in a variety of ways: technology transfer, attracting human, financial resources, creating new firms, forming networks and stimulating social interactions. Hill (2006) discussed the role of universities on the development of local area focusing on the significant effects of university in terms of social benefits (lower crime rates, improve of intergenerational mobility) and private returns. From a regional development perspective, many scholars, since Krugman (1991), have highlighted that migration may even give rise to larger regional disparities, especially in those cases in which it is not neutral but skill-selective (Fratesi and Percoco, 2014). For example, Faggian & McCann (2009) have studied the migration flows of students in Great Britain and have outlined a positive and cumulative link between the relative economic well being of destination regions and the scale of human capital net inflows. These findings are especially important for countries like Italy with great regional disparities between the richer areas in the north and the poorer areas in the south. In this light, Fratesi and Percoco (2014) have found that selective migration tends to increase the gap between northern and southern regions; the brain drain by Northern regions involves a large contraction in the human capital stock of southern regions with negative effects on the growth capacity of the latter. Furthermore, over the last decade both return to migration and university enrolments in Southern regions have decreased rather than increased (Ciriaci, 2005). According to the Association for the Industrial Development of Southern Italy (SVIMEZ, 2009), only one third of Southern migrant students returns to Southern regions after the graduation. This phenomenon tends to create further inequalities in within the country and a cultural and socio-economic loss for the Southern regions. Because of differences in socioeconomic background and in social conventions, we assume that not only the average percentages of movers are geographically different, but also the individual decision process may be different. Accordingly, the present paper intends to contribute to the literature aiming to quantify not only the way in which individual characteristics, but also contextual factors matter for student mobility. For providing empirical evidence on that we estimate a multilevel logit model for students’ decision to move outside his/her macro-region at university enrollment. The main results of our paper are twofold. On one hand, we confirm that students’ specific characteristics greatly affect the probability to migrate. On the other hand, results support the hypothesis that contextual factors exert an influence upon the likelihood of moving. The remainder of the paper is organised as follows. The statistical methodology and a general
description of data are provided in Section 2 and 3 respectively. Finally, findings are discussed in Section 4. Some final remarks end the paper.
2 Modeling student’s mobility at enrollment
The student’s decision to undertake the university studies in his/her macro-region of origin or to migrate in another macro-area is modelled using a multilevel logistic regression (Raudenbush & Bryk, 2002). There are two main reasons for using a multilevel model. Firstly, it allows us to explicitly account for the hierarchical nature of our data. Indeed, repeated observations within Italian provinces (NUTS 3 level) are correlated because neighbors share socio-economic conditions, common traditions, access to services etc. Secondly, it provides estimates of patterns of variation within and between provinces simultaneously, by allowing their intercepts, to vary. Migration is defined as it follows. A student who “migrates” from one province pertaining to a macro-region a (a= North, Centre, South) to a university in a macro-region ≠ (b=North, Centre, South) is considered a “mover” otherwise he is defined as a “stayer”. Accordingly, the outcome variable denotes whether a student is a mover ( = ) or a stayer ( = ). Let = ( = ) be the probability of a student i (i=1…n) being a migrant from a province j (j=1…J). The two-level logistic random intercept model is specifies as it follows:
= = + ∑ + ∑ + . (1)
Therefore equation (1) states that the log of the odds of π is a linear function of individual explanatory variables x (i.e. level-1 variables) and s provincial-level predictors z (i.e. level-2 variables) that account for observed sources of variation in the response. Finally, β and β are parameters to be estimated. The log of the odds of π depends also on u , assumed to be i.i.d. normally distributed with mean 0 and σ variance. Accordingly, the model has a random intercept which varies between provinces equal to β + u , which will be higher or lower than the overall intercept β (the weighted average of intercept across all provinces) depending on whether u is greater or less than zero. In other words, conditional on , the random effect uj
increases an expected response for a student in province j when it is positive and decreases the individual’s expected response when it is negative. In this sense, uj can
be viewed as contributing to the probability that yij=1. The Variance Partition
Coefficient (VPC) 2 by random effects, i.e. the proportion of total variance
“explained” by the grouping structure can be computed as =
+ .
2
In the binary response models the variance of the level-1 units is fixed to (π2/3) due to the inherent lack
of scale associated with categorical dependent variable, thus the random error of the level-2 units is the stochastic component of primary interest. Consequentially, the interpretation of VPC is difficult to
3 Data and variables
At individual level, data were drawn from MIUR administrative archives of university students (ANS), a very big database containing all the university student careers in Italy. In particular, we used data of the 2008/2009 cohort of freshmen (n=293,929); from this original cohort we select only students graduated from Italian high school in 2007 and 2008, dropping also those students enrolled at online universities. This selection reduces our individual data to 259,201 observations. To be included in the final database, these students needed to have available information on the provinces where their high school is located; this further selection reduces the observations to 254,300. Individual characteristics are grouped into two set of covariates. The first set of covariates includes gender, grade obtained at high school, regularity of secondary school career, enrolment age at university, high school type, whereas the second group encompasses some characteristics of the chosen university such as type (public vs private), university field of study, the number of delivered courses and an indicator of the university quality. The individual ability that is expected to positively influence the probability of moving is measured by the grade obtained at high school (defined as continuous covariate3) and the regularity of secondary school career (defined a categorical variable indicating whether the individual graduated in time, one year or two years late). The enrolment age at university is expressed by a dummy variable equal to 0 whether students enrolled immediately after leaving school and equal to 1 if students enrolled after one year. It is included in the statistical model as a regressor, in the hypothesis that older students are less likely to move for studying than those enrolling immediately after leaving school. Unfortunately, our data lack of family factors that have recognized and a strong influence on the probability to move for studying, such as family education and socio-economic status (Checchi, 2003). Nevertheless, most of Italian literature also show that the type of the attended high school is closely-related to both family education and income (Barone and Schizzerotto, 2006). Accordingly, the ‘school-type’ deeply discriminates between students with different social positions, and therefore it can be considered as a proxy variable for socio-economic status in our analysis. Similarly, the choice between public and private university can also be considered a proxy of the economic condition of the household (Pandolfini, 2013). Therefore, it would expect a positive sign of the coefficient related to this covariate on the likelihood of moving. Moreover, we also control for the chosen university field. The Italian university system is now
understand, because there is not a clear distinction between the individual level variance and the area level variance that exists in the linear case.
3 Continuous variable have been standardized, so that the main effect of each of them is the effect of such
variable on a student who has an average level of the other centered variables and the estimated regression coefficients are standardized regression coefficient.
organised into cycles. Accordingly, we consider each field subdivided by its duration in years (see Table 2 for details). We would expect that, in general, the probability of moving increases with the Health field (especially with the five-years Health field) insofar the most of these university courses foresee a limited number of freshmen per annum (Enea et al., 2013). Lastly, the number of courses and the “SOLE 24 ore” ranking of the chosen university account for individual choices based on a measure of the university attractiveness. As far as the geographical level is concerned, we consider four variables taking into account the literature. They are: the per capita income as a proxy of socio economic context of the province of origin, the number of university courses and the “SOLE 24 ore” rating as proxies for the quantity and quality of the local supply of higher education, respectively and a dummy variable that account for northern vs southern disparities.
4 Findings
4.1 Students’mobility in Italy
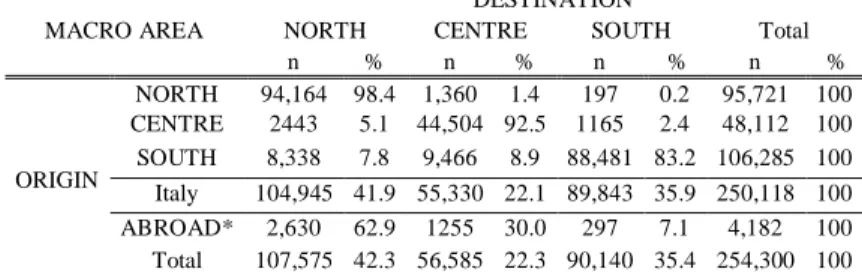
Table 1 highlights that in the a.y. 2008/2009, 23,000 students (around 9%) have enrolled in Universities situated in macro-regions other than the ones in which they have got their high school degree. As in other studies (Ciriaci, 2014), migration flows are significant, especially from Southern to Central-Northern regions while inter macro-regional mobility from Central and Northern regions is almost negligible.
Table 1: Distribution of students in host regions, by regions of origin a.y. 2008/2009
MACRO AREA
DESTINATION
NORTH CENTRE SOUTH Total n % n % n % n % ORIGIN NORTH 94,164 98.4 1,360 1.4 197 0.2 95,721 100 CENTRE 2443 5.1 44,504 92.5 1165 2.4 48,112 100 SOUTH 8,338 7.8 9,466 8.9 88,481 83.2 106,285 100 Italy 104,945 41.9 55,330 22.1 89,843 35.9 250,118 100 ABROAD* 2,630 62.9 1255 30.0 297 7.1 4,182 100 Total 107,575 42.3 56,585 22.3 90,140 35.4 254,300 100 Data source: our elaboration on ANS data
*enrolled foreign students who obtained their diploma abroad. These students are not included in the econometric analysis
Actually, about 17,800 movers (78% of migrant students) come from the Southern regions. Universities situated in Central regions capture the 8.9 percent of Southern freshmen and the Northern Universities the remaining 7.8 percent. International student mobility, as expected is low with respect to other European countries (OECD, 2012) and basically is directed towards Northern and Central regions. In order to provide a more detailed picture of the migration phenomenon, an index of variation which highlights the increase/decrease of regional University's student
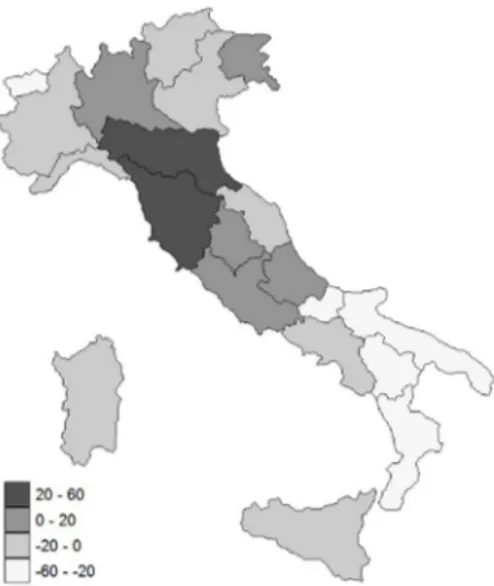
population due to the student mobility is computed at regional level (NUTS-2)4. Figure 1 shows the results (positive and negative values indicates regions with credit or deficit migration balance, respectively).
Figure 1: Index of variation for Italian regions
Emilia Romagna (North) and Tuscany (Centre) show very high and positive values (that means a positive balance in migration flows) while most of the Southern regions are affected by a significant deficit in migration flows, especially Calabria, Puglia, Molise and Basilicata which show the lower values of the index. In general, the lack of attractiveness of Southern universities associated with a public funding mechanism (also) based on the number of enrolled students create a vicious circle, as the Southern universities have fewer students, they receive less resources and subsequently they become less competitive and attractive.
4.2 Determinants of mobility
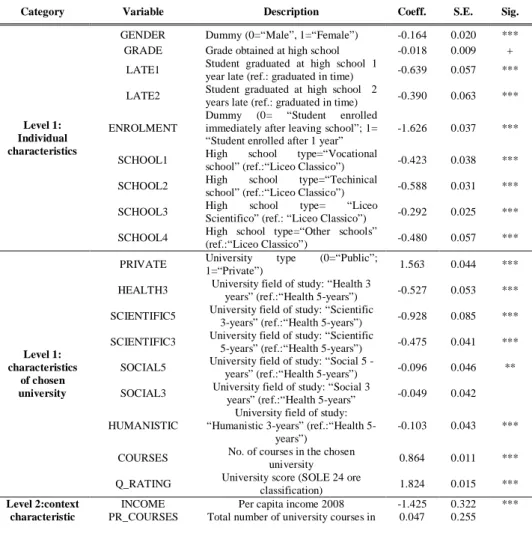
Table 2 presents the results of the multi-level modeling analysis. The estimates of parameters, standard errors and the significant level are reported respectively5. There is a significant difference between the standard logistic estimate and the multilevel logistic estimate as confirmed by the likelihood ratio χ2 value of 14227.01 on 1 df is
4
The index of variation is computed as ∙ , where is the total number of freshmen in the z-th region and is the total number of freshmen graduated from high schoolin the same region.
5
The intercept is the predicted probability for an average male student graduated from high school in the central macro-region in a “Liceo Classico” (i.e. secondary school focusing on humanities), had a regular secondary school career, enrolled in a public university in 2008 in a five years Health field.
significant at the 0.0001 level6. In other words, unmeasured province-specific factors affecting the propensity of moving have been partially captured by including the province-specific random effects. We can conclude, based on the estimate of VPC that about 35% of the variance in the log- odds of moving for studying is between provinces. Individual determinants of probability to be a mover are consistent with those detected in other studies of student mobility in Italy and elsewhere and present mainly the expected sign. Being a female negatively affects the probability of moving as well as being a late-enrolled student. Furthermore, the lower the regularity of secondary school career, the lower the probability that the student becomes a mover. Contrary to our expectations, the final grade obtained at high school appear negatively associated with the probability of moving but its effect has a slight tendency toward significance different (p<0.1) once others factors are taken into account. Moreover, the negative effects of all dummies for high school type (“Liceo classico” is the reference category) and the positive effect of the university type dummy (0=public vs 1=private) suggest that the probability to migrate is higher for students with higher family economic status insofar both variables are considered as proxies of household socio-economic background. As far as field of study is concerned, 2008 freshmen in five-year Health field are more likely to move than the ones in other scientific areas. Finally, the estimates related to the characteristics of the chosen university indicate that both a larger number of courses and a better rating have a relevant and positive effect on attracting movers. Looking at the geographical variables, findings indicate statistically regional effect on out-migration behavior. Compared to the Central/Northern macro-area, students who studied at high school in the South of Italy have a much higher propensity of leaving their macro-region after college graduation. The negative sign of per-capita average income can be conceived as a reaction to low living standards/quality of life as well as to low occupational level (taking into account the strong and positive correlation observed between the two indicators at provincial level) in the province of origin, thus the probability to migrate decreases as per-capita income increases. Whereas the likelihood of moving seems not affected by the supply of courses at provincial level, but the provincial university rating (measured as the maximum rating observed among all of the universities situated in the province j) has a significant effect on students migration. Actually, per-capita income may also capture the effect of the presence of the supply of the university courses in the local area. Therefore, students make their expectations by observing local outcomes in terms of the living standards of life/job opportunity and attractiveness of university courses.
6
Because these models are estimated using ML, and differ by the single parameter, we can use a likelihood ratio test to judge improvement in fit.
Table 2: Multilevel logistic regression estimates7
Category Variable Description Coeff. S.E. Sig.
Level 1: Individual characteristics
GENDER Dummy (0=“Male”, 1=“Female”) -0.164 0.020 *** GRADE Grade obtained at high school -0.018 0.009 +
LATE1 Student graduated at high school 1
year late (ref.: graduated in time) -0.639 0.057 *** LATE2 Student graduated at high school 2
years late (ref.: graduated in time) -0.390 0.063 *** ENROLMENT
Dummy (0= “Student enrolled immediately after leaving school”; 1= “Student enrolled after 1 year”
-1.626 0.037 ***
SCHOOL1 High school type=“Vocational
school” (ref.:“Liceo Classico”) -0.423 0.038 *** SCHOOL2 High school type=“Techinical
school” (ref.:“Liceo Classico”) -0.588 0.031 *** SCHOOL3 High school type= “Liceo
Scientifico” (ref.: “Liceo Classico”) -0.292 0.025 *** SCHOOL4 High school type=“Other schools”
(ref.:“Liceo Classico”) -0.480 0.057 ***
Level 1: characteristics
of chosen university
PRIVATE University type (0=“Public”;
1=“Private”) 1.563 0.044 *** HEALTH3 University field of study: “Health 3
years” (ref.:“Health 5-years”) -0.527 0.053 *** SCIENTIFIC5 University field of study: “Scientific
3-years” (ref.:“Health 5-years”) -0.928 0.085 *** SCIENTIFIC3 University field of study: “Scientific
5-years” (ref.:“Health 5-years”) -0.475 0.041 *** SOCIAL5 University field of study: “Social 5
-years” (ref.:“Health 5--years”) -0.096 0.046 ** SOCIAL3 University field of study: “Social 3
years” (ref.:“Health 5-years” -0.049 0.042 HUMANISTIC
University field of study: “Humanistic 3-years” (ref.:“Health
5-years”)
-0.103 0.043 ***
COURSES No. of courses in the chosen
university 0.864 0.011 *** Q_RATING University score (SOLE 24 ore
classification) 1.824 0.015 *** Level 2:context
characteristic
INCOME Per capita income 2008 -1.425 0.322 *** PR_COURSES Total number of university courses in 0.047 0.255
7
“Liceo classico” and “Liceo scientifico” aresecondary schools focusing on humanities and mathematics respectively. The number of observations is 243,801 after deleting missing values in the covariates. 110 province has been considered, an appropriate imputation of values has been made if provincial-level variables were not available.
(NUTS 3) the province
MAX_RAT Max university score in the province
(SOLE 24 ore classification) -0.568 0.172 *** SOUTH Macro-area =South
(ref.:“North/Centre”) 1.419 0.617 ** INTERCEPT -2.938 0.329 *** Variance component 1.815 0.255 LR test vs. logistic model: Χ2(1) = 14227.01 *** Number of obs 243,801, Number of groups=110
***p< 0.001; ** p<0.05;+p <0.10
Final remarks
In this paper we applied a multilevel approach for addressing the issue that students living in a given province are likely to be more similar than students living in differing provinces. This similarity means that the assumption of independence of errors is violated. Apart from the statistical improvements, the random logistic model allowed to consider variables at two different levels of analysis, that is students and provinces. Given such promising results, we wish to update our analysis in two main directions in the next future. Firstly, new data on freshmen cohorts (i.e. 2011 and 2014) will allow us to detect, not only changes in mobility pattern, but also the impact of the economic crisis on student’s choices. Secondly, more complex model specification can be tested.
References
1. Barone, C., & Schizzerotto, A. (2006). Sociologia dell’istruzione. Il Mulino: Bologna
2. Bruno, G., Genovese, A. (2012). A spatial interaction model for the representation of the mobility of University students on the Italian territory. New Spat Econ (2012) 12:41–57
3. Cammelli A. and Gasperoni G., (2015), Opportunities and Challenges for Higher Education in Italy, Almalaurea Working papers no. 74, 2015
4. Checchi D. (2003) The Italian educational system: family background and social stratification; paper presented for the ISAE conference on “Monitoring Italy”
5. Ciriaci D., (2014) Does University Quality Influence the Interregional Mobility of Students and Graduates? The Case of Italy, Regional Studies, 48:10, pp.1592-1608
6. Enea, M., Plaia, A., & Capursi, V. (2013) Modeling confidential data via modified hurdle mixed models. In Proceedings of the 28th International Workshop on Statistical Modelling, Vol.1. (V. Muggeo, V. Capursi, G. Boscaino, & G. Lovison, a cura di)ISBN: 978-88-96251-47-8 Gipe srl casa editrice
7. Faggian A., & P. McCann (2009), Human Capital, Graduate Migration and Innovation in British Regions. Cambridge Journal of Economics, 33 (2), 317-333
8. Fratesi U. and Percoco M. (2014) Selective Migration, Regional Growth and Convergence: Evidence from Italy, Regional Studies, 48:10, pp.1650-1668 9. Hill, K. (2006), Universities in the U.S. National Innovation System, report for
Productivity and Prosperity Project (P3) Arizone State University
10. Krugman P. (1991) Increasing returns and economic geography, Journal of Political Economy, 99(3), 483–499
11. Moretti, E. (2004) Estimating the Social Return to Higher Education: Evidence from Longitudinal and Repeated Cross-Sectional Data, Journal of Econometrics 121 (July/August 2004): 175-212.
12. OECD (2012), Education at a Glance 2012: OECD Indicators, OECD Publishing.
13. Pandolfini V. (2013), Public or private education? Parents’ choices between actual and potential pluralism ITALIAN JOURNAL OF SOCIOLOGY OF EDUCATION, 5 (2), 189-217.
14. Raudenbush, S.W., Bryk, A.S., 2002, Hierarchical linear models: applications and data analysis methods, Sage Publications: London (UK). 15. Salter, A. and Martin, B. (2001), The Economic Benefits of Publicly
Funded Basic Research: A Critical Review, Research Policy 30 (2001): 509-532.
16. Svimez (2009), Rapporto sull’economia del Mezzogiorno, Bologna: il Mulino.