toxins
ArticleWithania somnifera Induces Cytotoxic and Cytostatic
Effects on Human T Leukemia Cells
Eleonora Turrini1, Cinzia Calcabrini1, Piero Sestili2, Elena Catanzaro1, Elena de Gianni1, Anna Rita Diaz2, Patrizia Hrelia3, Massimo Tacchini4, Alessandra Guerrini4,
Barbara Canonico2, Stefano Papa2, Giovanni Valdrè5and Carmela Fimognari1,*
1 Department for Life Quality Studies, Alma Mater Studiorum-University of Bologna, Corso d’Augusto 237,
47921 Rimini, Italy; [email protected] (E.T.); [email protected] (C.C.); [email protected] (E.C.); [email protected] (E.d.G.)
2 Department of Biomolecular Sciences, University of Urbino Carlo Bo, Via Saffi 2, 61029 Urbino, Italy;
[email protected] (P.S.); [email protected] (A.R.D.); [email protected] (B.C.); [email protected] (S.P.)
3 Department of Pharmacy and Biotechnology, Alma Mater Studiorum-University of Bologna, Via Irnerio 48,
40126 Bologna, Italy; [email protected]
4 Department of Life Sciences and Biotechnology (SVeB)-LT Terra & Acqua Tech RU, University of Ferrara,
Corso Ercole I d’Este 32, I-44121 Ferrara, Italy; [email protected] (M.T.); [email protected] (A.G.)
5 Department of Biological, Geological and Environmental Sciences (BiGeA),
Alma Mater Studiorum-University of Bologna, Piazza di Porta S. Donato 1, 40126 Bologna, Italy; [email protected]
* Correspondence: [email protected]; Tel.: +39-0541-434-658 Academic Editor: Tzi Bun NG
Received: 30 December 2015; Accepted: 9 May 2016; Published: 12 May 2016
Abstract:Cancer chemotherapy is characterized by an elevated intrinsic toxicity and the development of drug resistance. Thus, there is a compelling need for new intervention strategies with an improved therapeutic profile. Immunogenic cell death (ICD) represents an innovative anticancer strategy where dying cancer cells release damage-associated molecular patterns promoting tumor-specific immune responses. The roots of Withania somnifera (W. somnifera) are used in the Indian traditional medicine for their anti-inflammatory, immunomodulating, neuroprotective, and anticancer activities. The present study is designed to explore the antileukemic activity of the dimethyl sulfoxide extract obtained from the roots of W. somnifera (WE). We studied its cytostatic and cytotoxic activity, its ability to induce ICD, and its genotoxic potential on a human T-lymphoblastoid cell line by using different flow cytometric assays. Our results show that WE has a significant cytotoxic and cytostatic potential, and induces ICD. Its proapoptotic mechanism involves intracellular Ca2+accumulation and the generation of reactive
oxygen species. In our experimental conditions, the extract possesses a genotoxic potential. Since the use of Withania is suggested in different contexts including anti-infertility and osteoarthritis care, its genotoxicity should be carefully considered for an accurate assessment of its risk–benefit profile.
Keywords: Withania somnifera; apoptosis; cell cycle; leukemia; oxidative stress; immunogenic cell death; genotoxicity
1. Introduction
Cancer causes millions of deaths every year. Only in 2012, cancer deaths have reached 8.2 million. In 2030, 12.6 million cancer deaths have been estimated [1].
Cancer originates from multiple alterations induced by a direct interaction between toxic agents and DNA. This triggers gene and chromosome mutations. Altered expressions of oncogenes and tumor suppressor genes are found in different cancer types. The consequence is an uncontrollable
Toxins 2016, 8, 147 2 of 15
proliferation mediated by growth signals released from the tumor cells themselves, resistance against antigrowth signals, and inhibition of apoptosis. Furthermore, cancer expansion is helped by the release of various growth factors which lead to the formation of new blood vessels that provide nutrients and oxygen thus favoring cancer spread and metastasis dissemination [2]. Despite the progress made in anticancer research, traditional cytotoxic chemotherapy continues to serve as the basis for the current standard therapeutic regimen. This is characterized by an elevated intrinsic toxicity, mainly due to its poor selectivity for cancer cells. Furthermore, cancer cells’ ability to develop drug resistance represents a major problem in anticancer therapy [3]. Thus, there is a compelling need for new intervention strategies with an improved therapeutic profile. Cancer cells create a favorable microenvironment allowing them to survive, proliferate, and counteract immunosurveillance. A promising anticancer strategy could be represented by the use of cytotoxic drugs that are not only able to induce tumor cell death, but also promote tumor-specific immune responses, potentially preventing tumor progression and relapse [4]. Very recent studies have introduced the concept of immunogenic cell death (ICD), a modality of cell death where, after the exposure to some cytotoxic agents, dying cancer cells release endogenous damage-associated molecular patterns (DAMPs) including calreticulin, heat shock protein (Hsp)-70 and Hsp-90 recognized by antigen-presenting cells such as dendritic cells (DCs). This is followed by T-cell-mediated adaptive immunity [5].
Natural products represent a rich source of biologically active compounds that can be able to interact simultaneously with different targets involved in cell growth, cell differentiation, and apoptosis regulation [6]. In 2015, the Food and Drug Administration (FDA) released an updated guidance on botanical drug development. Unlike drugs that are constituted by a single active ingredient, botanical drugs have a heterogeneous nature, which may lead to uncertainty in relation to their active constituents. The number of botanical products submitted to the FDA is particularly high in the oncological area [7]. The first botanical drug in this area is Polyphenon E, a standardized extract obtained from the leaves of green tea (Camellia sinensis), approved by the FDA in 2007 for treatment of genital warts linked to human papilloma viruses. The well-defined make-up, standardization, and cheap cost make Polyphenon E a very interesting candidate for human clinical studies. Polyphenon E is currently in several trials as a chemopreventive and chemotherapeutic agent against chronic lymphocytic leukemia, bladder and lung cancers (phase II), and in breast cancer (phase I) [8–10].
Many recent studies focus on the potential anticancer effect of crude extracts from plants used in traditional medicine and their isolated compounds. The roots of Withania somnifera (W. somnifera), a plant originating from Asia and South Africa [11], are used in the Indian traditional medicine [12]. A wide range of biological activities is reported for W. somnifera including anti-inflammatory [13], immunomodulating [14], neuroprotective [15], and anticancer activities [16]. The present study is designed to explore the antileukemic activity of the DMSO extract obtained from the roots of W. somnifera (WE). Particular emphasis is given to the role of reactive oxygen species (ROS) in its anticancer effect. With the aim to extend the potential clinical impact of Withania, we investigated its ability to induce ICD and assessed on a preliminary basis the risk–benefit profile associated with the use of this plant through the analysis of its genotoxic potential.
2. Results
2.1. WE Contains Withaferin A (WFA), Whitanolide A (WDA), Withanolide B in Trace Amount
We detected and quantified WFA and WDA (Table1), which are among the most representative markers of Withania somnifera [17]. WFA was also described as highly soluble in DMSO, confirming our results. Withanolide B was instead under the Limit Of Quantification (LOQ = 4.36 ˘ 0.65 µg/mL) and withanone undetectable.
Toxins 2016, 8, 147 3 of 15
Table 1.Quantification of withaferin A (WFA) and withanolide A (WDA).
Compound Amount (µg/mL) LOD LOQ Amount (mg/g
of Dried Extract) Recovery %
WFA 113.65 ˘ 2.84 6.54 ˘ 0.11 19.81 ˘ 0.63 5.68 ˘ 0.14 96.85 ˘ 1.98
WDA 39.42 ˘ 1.44 1.64 ˘ 0.07 4.96 ˘ 0.26 1.97 ˘ 0.07 110.57 ˘ 2.11
withanolide B tr 2.03 ˘ 0.34 6.36 ˘ 0.65 -
-withanone - 1.99 ˘ 0.29 15.95 ˘ 1.18 -
-LOD: limit of detection, LOQ: limit of quantification, tr = trace.
2.2. WE Induces Apoptosis and Alters Cell-Cycle Residence
WE causes a dose-dependent reduction of cell viability. For example, after 24 h treatment of Jurkat cells with 1.6 mg/mL of WE, the percentage of viable cells was 64.4% and at 3.2 mg/mL cells viability achieved 16.6%. The calculated IC50value (the inhibitory concentration causing cell toxicity by 50%
following one cell-cycle exposure) was 2.3 mg/mL. Concentrations similar or smaller than the IC50
were used in the following experiments.
Further analyses were carried out to discriminate whether the inhibitory effect of WE on cell viability was the result of apoptotic cell death. After 6 h of treatment at 0.4 and 0.8 mg/mL, WE significantly increased the percent of apoptotic cells (3.4- and 4.1-fold increase, respectively, versus untreated cells). After 24 h of treatment, the percent of apoptotic cells was statistically significant starting from 0.4 mg/mL, where 33.1% ˘ 3.7% of apoptotic events was observed versus 3.1% ˘ 0.2% of untreated cells (Figure1). An increase in necrotic events was also recorded starting from 0.80 mg/mL (11.6% ˘ 1.9% versus 1.7% ˘ 0.2% of untreated cells). At the highest tested concentration of WE (1.6 mg/mL), both apoptotic and necrotic events markedly increased, but the percentage of apoptotic cells was significantly higher than that of necrotic cells (53.2% versus 28.2%, respectively) (Figure1A). When cells were treated with WFA, WDA or their association, we observed an increase in the fraction of apoptotic cells only for WFA at all the concentrations tested (Figure1B). The proapoptotic effect of the association WFA plus WDA was very similar to that of WFA (Figure1B). In Figure1C, we compared the fold increase in the percent of apoptotic cells recorded after treatment with WE, WFA or WFA plus WDA. The concentrations of WFA and WDA are those found in the extract at 0.20, 0.40 and 0.80 mg/mL. Even if WFA and WFA plus WDA possess a proapoptotic effect, the effect of WE is significantly higher than that observed for WFA or the association.
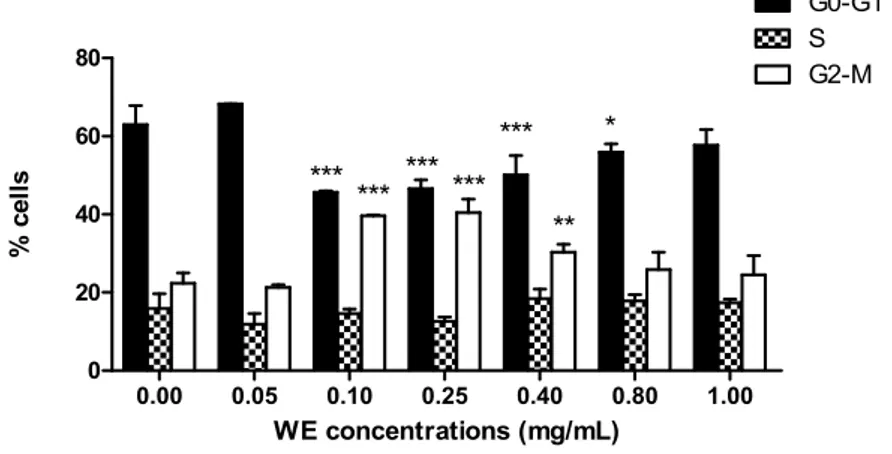
In the following experiments, we highlighted the cytostatic effect of WE. After 24 h treatment at increasing concentrations of WE, we observed an increasing number of cells in G2/M phase starting from 0.1 mg/mL (39.6% ˘ 0.1% versus 22.4% ˘ 1.2% of untreated cells), accompanied by a decrease in cells in phase G0/G1 (45.7% ˘ 0.1% versus 63.0% ˘ 2.2% of untreated cells) (Figure2). WE showed the same trend up to 0.4 mg/mL, where we detected an increase in cells in G2/M phase (30.3% ˘ 0.9%) and a decrease in cells in G0/G1 phase (50.1% ˘ 2.2%). At the highest concentrations tested, the cell-cycle distribution was similar to that of untreated cells (Figure2).
2.3. WE Increases Intracellular Ca2+([Ca2+]i)
We explored the ability of WE to modulate [Ca2+]i on viable cells after 6 and 24 h of Jurkat
treatment with WE. The extract increased [Ca2+]iin a dose- and time-dependent manner. At 6 h, [Ca2+]i
was significantly enhanced only at the highest concentration (0.4 mg/mL) tested [837.5 ˘ 86.9 MFI (mean fluorescence intensity) versus 410.5 ˘ 12.4 MFI of untreated cells] (Figure3). After 24 h of WE, we recorded a significant increase in [Ca2+]iat all tested concentrations, starting from 0.1 mg/mL
(535.5 ˘ 61.5 MFI versus 399.7 ˘ 26.9 MFI of untreated cells) and becoming 3.7 fold higher than control at the highest tested concentration (1530 ˘ 27.7 MFI). Dead cells were analyzed separately as unique cluster. We observed an increase in [Ca2+]i(data not shown) that confirms the involvement of Ca2+in
Toxins 2016, 8, 147 4 of 15 Toxins 2016, 8, 147 3 of 14 WFA 113.65 ± 2.84 6.54 ± 0.11 19.81 ± 0.63 5.68 ± 0.14 96.85 ± 1.98 WDA 39.42 ± 1.44 1.64 ± 0.07 4.96 ± 0.26 1.97 ± 0.07 110.57 ± 2.11 withanolide B tr 2.03 ± 0.34 6.36 ± 0.65 ‐ ‐ withanone ‐ 1.99 ± 0.29 15.95 ± 1.18 ‐ ‐ LOD: limit of detection, LOQ: limit of quantification, tr = trace. 2.2. WE Induces Apoptosis and Alters Cell‐Cycle Residence
WE causes a dose‐dependent reduction of cell viability. For example, after 24 h treatment of Jurkat cells with 1.6 mg/mL of WE, the percentage of viable cells was 64.4% and at 3.2 mg/mL cells viability achieved 16.6%. The calculated IC50 value (the inhibitory concentration causing cell toxicity by 50% following one cell‐cycle exposure) was 2.3 mg/mL. Concentrations similar or smaller than the IC50 were used in the following experiments.
Further analyses were carried out to discriminate whether the inhibitory effect of WE on cell viability was the result of apoptotic cell death. After 6 h of treatment at 0.4 and 0.8 mg/mL, WE significantly increased the percent of apoptotic cells (3.4‐ and 4.1‐fold increase, respectively, versus untreated cells). After 24 h of treatment, the percent of apoptotic cells was statistically significant starting from 0.4 mg/mL, where 33.1% ± 3.7% of apoptotic events was observed versus 3.1% ± 0.2% of untreated cells (Figure 1). An increase in necrotic events was also recorded starting from 0.80 mg/mL (11.6% ± 1.9% versus 1.7% ± 0.2% of untreated cells). At the highest tested concentration of WE (1.6 mg/mL), both apoptotic and necrotic events markedly increased, but the percentage of apoptotic cells was significantly higher than that of necrotic cells (53.2% versus 28.2%, respectively) (Figure 1A). When cells were treated with WFA, WDA or their association, we observed an increase in the fraction of apoptotic cells only for WFA at all the concentrations tested (Figure 1B). The proapoptotic effect of the association WFA plus WDA was very similar to that of WFA (Figure 1B). In Figure 1C, we compared the fold increase in the percent of apoptotic cells recorded after treatment with WE, WFA or WFA plus WDA. The concentrations of WFA and WDA are those found in the extract at 0.20, 0.40 and 0.80 mg/mL. Even if WFA and WFA plus WDA possess a proapoptotic effect, the effect of WE is significantly higher than that observed for WFA or the association. Figure 1. Percentage of viable, necrotic and apoptotic cells after 24 h treatment of Jurkat cells with increasing concentrations of: DMSO extract obtained from the roots of W. somnifera (WE) (A); and
Figure 1.Percentage of viable, necrotic and apoptotic cells after 24 h treatment of Jurkat cells with increasing concentrations of: DMSO extract obtained from the roots of W. somnifera (WE) (A); and withaferin A (WFA), withanolide A (WDA) or WFA plus WDA (B). Fold increase in the percent of apoptotic cells after treatment with different concentrations of WE, WFA, or WFA plus WDA (C). * p < 0.05; ** p < 0.01; *** p < 0.001 versus untreated cells.
Toxins 2016, 8, 147 4 of 14 withaferin A (WFA), withanolide A (WDA) or WFA plus WDA (B). Fold increase in the percent of apoptotic cells after treatment with different concentrations of WE, WFA, or WFA plus WDA (C). * p < 0.05; ** p < 0.01; *** p < 0.001 versus untreated cells. In the following experiments, we highlighted the cytostatic effect of WE. After 24 h treatment at increasing concentrations of WE, we observed an increasing number of cells in G2/M phase starting from 0.1 mg/mL (39.6% ± 0.1% versus 22.4% ± 1.2% of untreated cells), accompanied by a decrease in cells in phase G0/G1 (45.7% ± 0.1% versus 63.0% ± 2.2% of untreated cells) (Figure 2). WE showed the same trend up to 0.4 mg/mL, where we detected an increase in cells in G2/M phase (30.3% ± 0.9%) and a decrease in cells in G0/G1 phase (50.1% ± 2.2%). At the highest concentrations tested, the cell‐ cycle distribution was similar to that of untreated cells (Figure 2).
Figure 2. Cell‐cycle distribution following 24 h treatment of Jurkat with increasing concentrations of WE. * p < 0.05; ** p < 0.01; *** p < 0.001 versus untreated cells. 2.3. WE Increases Intracellular Ca2+ ([Ca2+]i)
We explored the ability of WE to modulate [Ca2+]i on viable cells after 6 and 24 h of Jurkat treatment with WE. The extract increased [Ca2+]i in a dose‐ and time‐dependent manner. At 6 h, [Ca2+]i was significantly enhanced only at the highest concentration (0.4 mg/mL) tested [837.5 ± 86.9 MFI (mean fluorescence intensity) versus 410.5 ± 12.4 MFI of untreated cells] (Figure 3). After 24 h of WE, we recorded a significant increase in [Ca2+]i at all tested concentrations, starting from 0.1 mg/mL (535.5 ± 61.5 MFI versus 399.7 ± 26.9 MFI of untreated cells) and becoming 3.7 fold higher than control at the highest tested concentration (1530 ± 27.7 MFI). Dead cells were analyzed separately as unique cluster. We observed an increase in [Ca2+]i (data not shown) that confirms the involvement of Ca2+ in the antileukemic effect of WE.
Figure 3. Fraction of living cells with increased [Ca2+]i following 6 and 24 h exposure to increasing concentrations of WE. * p < 0.05; ** p < 0.01; *** p < 0.001 versus untreated cells. 0.00 0.05 0.10 0.25 0.40 0.80 1.00 0 20 40 60 80 G0-G1 S G2-M *** *** *** * ** *** *** WE concentrations (mg/mL) % c ells
Figure 2.Cell-cycle distribution following 24 h treatment of Jurkat with increasing concentrations of WE. * p < 0.05; ** p < 0.01; *** p < 0.001 versus untreated cells.
2.4. WE Induces Oxidative Stress
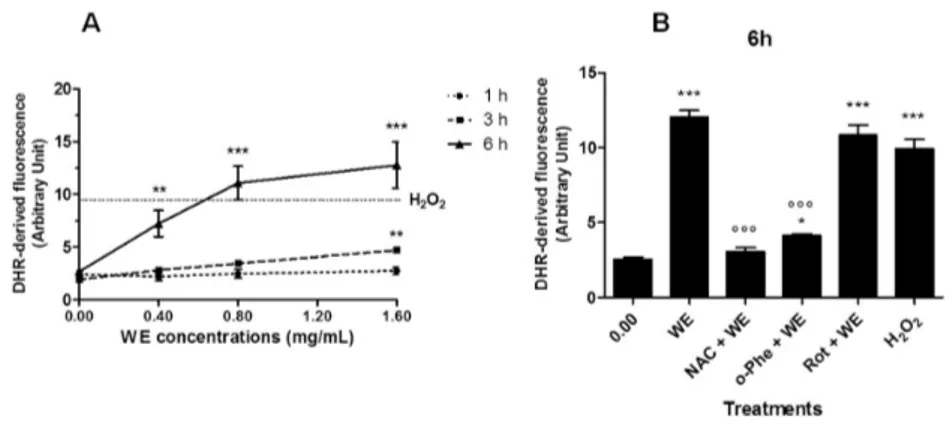
WE extract increased ROS production in a dose-dependent manner in Jurkat cells (Figure4A). Most of the ROS were generated between 3 and 6 h of incubation. After 6 h treatment with WE, 0.8 and 1.6 mg/mL of WE led to ROS levels similar or even higher than those promoted by a mildly toxic dose of H2O2(0.1 mM for 15 min), included as a positive control. After longer times of treatment
(18 and 24 h), ROS generation reached a plateau (data not shown). N-acetylcysteine (NAC) and o-phenantroline (o-Phe) significantly inhibited the ROS generation induced by WE (0.8 mg/mL for 6 h), while rotenone (Rot) was unable to afford a protective effect (Figure4B).
Toxins 2016, 8, 147 5 of 15 Toxins 2016, 8, 147 4 of 14 withaferin A (WFA), withanolide A (WDA) or WFA plus WDA (B). Fold increase in the percent of apoptotic cells after treatment with different concentrations of WE, WFA, or WFA plus WDA (C). * p < 0.05; ** p < 0.01; *** p < 0.001 versus untreated cells. In the following experiments, we highlighted the cytostatic effect of WE. After 24 h treatment at increasing concentrations of WE, we observed an increasing number of cells in G2/M phase starting from 0.1 mg/mL (39.6% ± 0.1% versus 22.4% ± 1.2% of untreated cells), accompanied by a decrease in cells in phase G0/G1 (45.7% ± 0.1% versus 63.0% ± 2.2% of untreated cells) (Figure 2). WE showed the same trend up to 0.4 mg/mL, where we detected an increase in cells in G2/M phase (30.3% ± 0.9%) and a decrease in cells in G0/G1 phase (50.1% ± 2.2%). At the highest concentrations tested, the cell‐ cycle distribution was similar to that of untreated cells (Figure 2). Figure 2. Cell‐cycle distribution following 24 h treatment of Jurkat with increasing concentrations of WE. * p < 0.05; ** p < 0.01; *** p < 0.001 versus untreated cells. 2.3. WE Increases Intracellular Ca2+ ([Ca2+]i)
We explored the ability of WE to modulate [Ca2+]i on viable cells after 6 and 24 h of Jurkat
treatment with WE. The extract increased [Ca2+]i in a dose‐ and time‐dependent manner. At 6 h, [Ca2+]i
was significantly enhanced only at the highest concentration (0.4 mg/mL) tested [837.5 ± 86.9 MFI (mean fluorescence intensity) versus 410.5 ± 12.4 MFI of untreated cells] (Figure 3). After 24 h of WE,
we recorded a significant increase in [Ca2+]i at all tested concentrations, starting from 0.1 mg/mL
(535.5 ± 61.5 MFI versus 399.7 ± 26.9 MFI of untreated cells) and becoming 3.7 fold higher than control at the highest tested concentration (1530 ± 27.7 MFI). Dead cells were analyzed separately as unique
cluster. We observed an increase in [Ca2+]i (data not shown) that confirms the involvement of Ca2+ in
the antileukemic effect of WE. Figure 3. Fraction of living cells with increased [Ca2+]i following 6 and 24 h exposure to increasing concentrations of WE. * p < 0.05; ** p < 0.01; *** p < 0.001 versus untreated cells. 0.00 0.05 0.10 0.25 0.40 0.80 1.00 0 20 40 60 80 G0-G1 S G2-M *** *** *** * ** *** *** WE concentrations (mg/mL) % c ells
Figure 3.Fraction of living cells with increased [Ca2+]ifollowing 6 and 24 h exposure to increasing
concentrations of WE. * p < 0.05; ** p < 0.01; *** p < 0.001 versus untreated cells.
Toxins 2016, 8, 147 5 of 14 2.4. WE Induces Oxidative Stress WE extract increased ROS production in a dose‐dependent manner in Jurkat cells (Figure 4A). Most of the ROS were generated between 3 and 6 h of incubation. After 6 h treatment with WE, 0.8 and 1.6 mg/mL of WE led to ROS levels similar or even higher than those promoted by a mildly toxic dose of H2O2 (0.1 mM for 15 min), included as a positive control. After longer times of treatment (18
and 24 h), ROS generation reached a plateau (data not shown). N‐acetylcysteine (NAC) and o‐ phenantroline (o‐Phe) significantly inhibited the ROS generation induced by WE (0.8 mg/mL for 6 h), while rotenone (Rot) was unable to afford a protective effect (Figure 4B).
Figure 4. Reactive oxygen species (ROS) generation in WE‐treated cells: (A) Jurkat exposed to increasing concentrations of WE for 1 h, 3 h or 6 h. Cells treated with H2O2 0.1 mM for 15 min represent
the positive control (dotted line parallel to x‐axis). (B) Cells were treated for 6 h with WE 0.8 mg/mL in the absence or presence of o‐phenanthroline (o‐Phe, 10 μM), rotenone (Rot, 2 μM) or N‐ acetylcysteine (NAC, 10 mM). Cells treated with H2O2 0.1 mM for 15 min represent the positive
control. * p < 0.05, ** p < 0.01, *** p < 0.001 versus control, and °°° p < 0.001 versus WE.
2.5. Co‐Treatment of Cells with WE and NAC Significantly Decreases WE‐Induced Apoptosis
Because of the crucial role of ROS in the bioactivity of WE, we investigated whether the alteration of the redox state induced by NAC treatment could play a role in the apoptosis induced by WE. We observed a significant decrease in the WE‐induced apoptotic events following 24 h of Jurkat co‐ treatment with WE plus NAC (10 mM). The WE‐induced apoptotic events were significantly reduced from 35% after 0.40 mg/mL of WE to 10% after WE plus NAC and from 38% after 0.80 mg/mL of WE to 12% after WE plus NAC (Figure 5). Figure 5. Apoptotic events after 24 h of Jurkat treatment with WE in the absence and presence of N‐ acetyl cysteine (NAC) (10 mM). * p < 0.05; ** p < 0.01 versus WE. 0.40 0.80 0 20 40 60 WE WE + NAC * ** WE concentrations (mg/mL) % ap op to ti c cel ls
Figure 4. Reactive oxygen species (ROS) generation in WE-treated cells: (A) Jurkat exposed to increasing concentrations of WE for 1 h, 3 h or 6 h. Cells treated with H2O20.1 mM for 15 min
represent the positive control (dotted line parallel to x-axis). (B) Cells were treated for 6 h with WE 0.8 mg/mL in the absence or presence of o-phenanthroline (o-Phe, 10 µM), rotenone (Rot, 2 µM) or N-acetylcysteine (NAC, 10 mM). Cells treated with H2O20.1 mM for 15 min represent the positive
control. * p < 0.05, ** p < 0.01, *** p < 0.001 versus control, and˝˝˝p < 0.001 versus WE.
2.5. Co-Treatment of Cells with WE and NAC Significantly Decreases WE-Induced Apoptosis
Because of the crucial role of ROS in the bioactivity of WE, we investigated whether the alteration of the redox state induced by NAC treatment could play a role in the apoptosis induced by WE. We observed a significant decrease in the WE-induced apoptotic events following 24 h of Jurkat co-treatment with WE plus NAC (10 mM). The WE-induced apoptotic events were significantly reduced from 35% after 0.40 mg/mL of WE to 10% after WE plus NAC and from 38% after 0.80 mg/mL of WE to 12% after WE plus NAC (Figure5).
Toxins 2016, 8, 147 5 of 14 2.4. WE Induces Oxidative Stress WE extract increased ROS production in a dose‐dependent manner in Jurkat cells (Figure 4A). Most of the ROS were generated between 3 and 6 h of incubation. After 6 h treatment with WE, 0.8 and 1.6 mg/mL of WE led to ROS levels similar or even higher than those promoted by a mildly toxic dose of H2O2 (0.1 mM for 15 min), included as a positive control. After longer times of treatment (18
and 24 h), ROS generation reached a plateau (data not shown). N‐acetylcysteine (NAC) and o‐ phenantroline (o‐Phe) significantly inhibited the ROS generation induced by WE (0.8 mg/mL for 6 h), while rotenone (Rot) was unable to afford a protective effect (Figure 4B).
Figure 4. Reactive oxygen species (ROS) generation in WE‐treated cells: (A) Jurkat exposed to increasing concentrations of WE for 1 h, 3 h or 6 h. Cells treated with H2O2 0.1 mM for 15 min represent
the positive control (dotted line parallel to x‐axis). (B) Cells were treated for 6 h with WE 0.8 mg/mL in the absence or presence of o‐phenanthroline (o‐Phe, 10 μM), rotenone (Rot, 2 μM) or N‐ acetylcysteine (NAC, 10 mM). Cells treated with H2O2 0.1 mM for 15 min represent the positive
control. * p < 0.05, ** p < 0.01, *** p < 0.001 versus control, and °°° p < 0.001 versus WE.
2.5. Co‐Treatment of Cells with WE and NAC Significantly Decreases WE‐Induced Apoptosis
Because of the crucial role of ROS in the bioactivity of WE, we investigated whether the alteration of the redox state induced by NAC treatment could play a role in the apoptosis induced by WE. We observed a significant decrease in the WE‐induced apoptotic events following 24 h of Jurkat co‐ treatment with WE plus NAC (10 mM). The WE‐induced apoptotic events were significantly reduced from 35% after 0.40 mg/mL of WE to 10% after WE plus NAC and from 38% after 0.80 mg/mL of WE to 12% after WE plus NAC (Figure 5). Figure 5. Apoptotic events after 24 h of Jurkat treatment with WE in the absence and presence of N‐ acetyl cysteine (NAC) (10 mM). * p < 0.05; ** p < 0.01 versus WE. 0.40 0.80 0 20 40 60 WE WE + NAC * ** WE concentrations (mg/mL) % ap op to ti c cel ls
Figure 5. Apoptotic events after 24 h of Jurkat treatment with WE in the absence and presence of N-acetyl cysteine (NAC) (10 mM). * p < 0.05; ** p < 0.01 versus WE.
Toxins 2016, 8, 147 6 of 15
Moreover, we co-treated cells with WE andL-asparagine (1–2 mM): under this condition, we did not record any modulation of the proapoptotic potential of WE (data not shown).
2.6. WE Induces ICD
Based on the cytotoxic activity of WE and its ability to increase intracellular ROS and Ca2+levels,
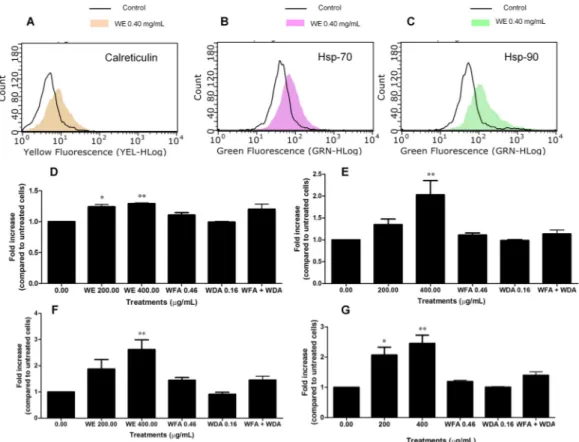
we preliminarily explored the capacity of WE to induce ICD. To this aim, the exposure of some DAMPs on the extracellular membrane of Jurkat cells was examined. After 6 h of treatment, we did not observe any effect of WE on calreticulin translocation (data not shown). Longer treatment times (24 h) caused calreticulin translocation on the extracellular membrane (Figure6A,D), with a mean fluorescence of 8.39 at 0.2 mg/mL and 8.72 at 0.4 mg/mL compared to 6.83 of the control (Figure6A). Similarly, cells treated with WE showed an increase in both Hsp-70 and Hsp-90 expression only after 24 h of treatment (Figure6E,F, respectively). As an example, at 0.2 mg/mL Hsp-70 fluorescence was 57.92 compared to 42.17 of the control and Hsp-90 mean fluorescence was 144.14 compared to 58.45 of untreated cells; at 0.4 mg/mL, the fluorescence of both Hsp-70 and Hsp-90 increased to 85.22 and 151.09, respectively (Figure6B,C, respectively). Finally, we measured the release of adenosine triphosphate (ATP) from dying cells after 6 and 24 h of treatment with WE. At 6 h, we did not record any modulation of ATP levels (data not shown). After 24 h, we observed a significant increase in ATP levels at both the tested concentrations of the extract (2- and 2.45-fold increase, respectively) (Figure6G).
Toxins 2016, 8, 147 6 of 14
Moreover, we co‐treated cells with WE and L‐asparagine (1–2 mM): under this condition, we did not record any modulation of the proapoptotic potential of WE (data not shown).
2.6. WE Induces ICD
Based on the cytotoxic activity of WE and its ability to increase intracellular ROS and Ca2+ levels, we preliminarily explored the capacity of WE to induce ICD. To this aim, the exposure of some DAMPs on the extracellular membrane of Jurkat cells was examined. After 6 h of treatment, we did not observe any effect of WE on calreticulin translocation (data not shown). Longer treatment times (24 h) caused calreticulin translocation on the extracellular membrane (Figure 6A,D), with a mean fluorescence of 8.39 at 0.2 mg/mL and 8.72 at 0.4 mg/mL compared to 6.83 of the control (Figure 6A). Similarly, cells treated with WE showed an increase in both Hsp‐70 and Hsp‐90 expression only after 24 h of treatment (Figure 6E,F, respectively). As an example, at 0.2 mg/mL Hsp‐70 fluorescence was 57.92 compared to 42.17 of the control and Hsp‐90 mean fluorescence was 144.14 compared to 58.45 of untreated cells; at 0.4 mg/mL, the fluorescence of both Hsp‐70 and Hsp‐90 increased to 85.22 and 151.09, respectively (Figure 6B,C, respectively). Finally, we measured the release of adenosine triphosphate (ATP) from dying cells after 6 and 24 h of treatment with WE. At 6 h, we did not record any modulation of ATP levels (data not shown). After 24 h, we observed a significant increase in ATP levels at both the tested concentrations of the extract (2‐ and 2.45‐fold increase, respectively) (Figure 6G). We also tested the induction of ICD by the two main constituents of WE extract (i.e., WFA and WDA), used at the concentrations found in the WE extract at 0.40 mg/mL. Treatment with WFA and WDA alone or in association for 24 h did not cause a statistically significant modulation of calreticulin translocation, Hsp‐70 and Hsp‐90 expression or ATP release (Figure 6D–G). Figure 6. Fluorescence hystograms of: immunolabeled calreticulin (A); Hsp‐70 (B); and Hsp‐90 (C). Modulation of the expression of: calreticulin (D); Hsp‐70 (E); Hsp‐90 (F); and of ATP release (G) after treatment with WE, WFA, WDA or WFA plus WDA. Histograms are representatives of three independent experiments. * p < 0.05, ** p < 0.01 versus untreated cells.
Figure 6.Fluorescence hystograms of: immunolabeled calreticulin (A); Hsp-70 (B); and Hsp-90 (C). Modulation of the expression of: calreticulin (D); Hsp-70 (E); Hsp-90 (F); and of ATP release (G) after treatment with WE, WFA, WDA or WFA plus WDA. Histograms are representatives of three independent experiments. * p < 0.05, ** p < 0.01 versus untreated cells.
We also tested the induction of ICD by the two main constituents of WE extract (i.e., WFA and WDA), used at the concentrations found in the WE extract at 0.40 mg/mL. Treatment with WFA and
Toxins 2016, 8, 147 7 of 15
WDA alone or in association for 24 h did not cause a statistically significant modulation of calreticulin translocation, Hsp-70 and Hsp-90 expression or ATP release (Figure6D–G).
2.7. WE Induces DNA Damage
To evaluate the ability of WE to induce DNA damage, H2A.X phosphorylation was analyzed. H2A.X phosphorylation at Ser 139 represents a sensitive marker for DNA strand breakage [18]. WE induced a dose-dependent increase in H2A.X phosphorylation, which was eight times higher than untreated cells at the highest tested concentration (0.80 mg/mL). This increase was similar to the phosphorylation induced by etoposide 10 µM, used as positive control (Figure7).
Toxins 2016, 8, 147 7 of 14
2.7. WE Induces DNA Damage
To evaluate the ability of WE to induce DNA damage, H2A.X phosphorylation was analyzed. H2A.X phosphorylation at Ser 139 represents a sensitive marker for DNA strand breakage [18]. WE induced a dose‐dependent increase in H2A.X phosphorylation, which was eight times higher than untreated cells at the highest tested concentration (0.80 mg/mL). This increase was similar to the phosphorylation induced by etoposide 10 μM, used as positive control (Figure 7).
Figure 7. Relative expression of phosphorylated H2A.X (P‐H2A.X) induced by WE in Jurkat cells after 6 h of treatment. Etoposide (10 μM) was used as positive control. *** p < 0.001 versus untreated cells. 3. Discussion In this study, we demonstrated the in vitro antileukemic effect of the root extract of W. somnifera in a T‐lymphoblastoid cell line. The high‐performance liquid chromatography (HPLC) analysis performed on WE revealed the presence of WFA, WDA and to a lesser extent withanolide B. Withanolides, in particular WFA and its acetyl derivative, are highly bioactive and show anticancer activity [19–21]. Of note, its dihydroderivative is not active, thus suggesting that an unsaturated lactone moiety in ring A of WFA is important for its biological activity. In our experimental settings, WE significantly induced apoptosis in a remarkable proportion of cells. Moreover, it blocked cell proliferation through an accumulation of cells in the G2/M phase starting from the lowest tested concentrations. Cell‐cycle dysregulation represents a hallmark of cancer [22] and targeting the checkpoint signaling pathway, which usually leads to an arrest at G1/S or G2/M boundaries, is an effective therapeutic strategy [23]. Our results confirm the antiproliferative and proapoptotic effect reported for withanolides and for a methanolic crude Withania leaf extract in different leukemia cell lines [24,25]. However, the IC50 calculated for the above mentioned methanolic leaf extract was much lower than that calculated in our study. The difference could be imputable to the different part of plant (root versus leaf) used and/or the method of extraction (the methanolic leaf extract was subjected to a sequential solvent extraction, which progressively concentrated the active components of
Withania leaves).
Different mechanisms can be involved in the proapoptotic activity of our WE. Numerous studies reported that intracellular Ca2+ mobilization plays a crucial role in apoptosis [26,27] and that calcium ionophores exhibit proapoptotic activity [28]. Since WE exhibited a marked proapoptotic ability, we measured [Ca2+]i and demonstrated that further to the treatment of Jurkat cells with WE, [Ca2+]i significantly increased. The underlying mechanisms need to be explored, however we can hypothesize that the proapoptotic mechanism of WE involves intracellular Ca2+ accumulation.
Fruits of W. somnifera contain different enzymes including L‐asparaginase, which catalyzes the
conversion of the aminoacid asparagine to aspartate and ammonia. Through this mechanism, L‐ asparaginase depletes the cellular levels of asparagine and induces the death of leukemic cells that 0.00 Etopo side 0.20 0.40 0.80 0 5 10 15
***
***
WE concentrations (mg/mL) P-H2 A. XFigure 7.Relative expression of phosphorylated H2A.X (P-H2A.X) induced by WE in Jurkat cells after 6 h of treatment. Etoposide (10 µM) was used as positive control. *** p < 0.001 versus untreated cells. 3. Discussion
In this study, we demonstrated the in vitro antileukemic effect of the root extract of W. somnifera in a T-lymphoblastoid cell line. The high-performance liquid chromatography (HPLC) analysis performed on WE revealed the presence of WFA, WDA and to a lesser extent withanolide B. Withanolides, in particular WFA and its acetyl derivative, are highly bioactive and show anticancer activity [19–21]. Of note, its dihydroderivative is not active, thus suggesting that an unsaturated lactone moiety in ring A of WFA is important for its biological activity. In our experimental settings, WE significantly induced apoptosis in a remarkable proportion of cells. Moreover, it blocked cell proliferation through an accumulation of cells in the G2/M phase starting from the lowest tested concentrations. Cell-cycle dysregulation represents a hallmark of cancer [22] and targeting the checkpoint signaling pathway, which usually leads to an arrest at G1/S or G2/M boundaries, is an effective therapeutic strategy [23]. Our results confirm the antiproliferative and proapoptotic effect reported for withanolides and for a methanolic crude Withania leaf extract in different leukemia cell lines [24,25]. However, the IC50
calculated for the above mentioned methanolic leaf extract was much lower than that calculated in our study. The difference could be imputable to the different part of plant (root versus leaf) used and/or the method of extraction (the methanolic leaf extract was subjected to a sequential solvent extraction, which progressively concentrated the active components of Withania leaves).
Different mechanisms can be involved in the proapoptotic activity of our WE. Numerous studies reported that intracellular Ca2+mobilization plays a crucial role in apoptosis [26,27] and that calcium ionophores exhibit proapoptotic activity [28]. Since WE exhibited a marked proapoptotic ability, we measured [Ca2+]i and demonstrated that further to the treatment of Jurkat cells with WE, [Ca2+]i
significantly increased. The underlying mechanisms need to be explored, however we can hypothesize that the proapoptotic mechanism of WE involves intracellular Ca2+accumulation.
Toxins 2016, 8, 147 8 of 15
Fruits of W. somnifera contain different enzymes including L-asparaginase, which catalyzes the conversion of the aminoacid asparagine to aspartate and ammonia. Through this mechanism,
L-asparaginase depletes the cellular levels of asparagine and induces the death of leukemic cells that are unable to synthesize asparagine.L-asparaginase exhibits cytotoxic effects on patient-derived leukemic blasts [29]. A specific phytochemical analysis should be performed to detect the presence ofL-asparaginase in our extract. However, in our experimental conditions, the co-treatment of cells
with WE plusL-asparagine did not affect the proapoptotic potential of WE. The latter finding may suggest that our extract does not containL-asparaginase. Thus, it is conceivable that the presence of
L-asparaginase does not play a critical role in the cytotoxic activity of WE.
As already mentioned, the main component of our WE is WFA. Many studies have demonstrated the role of WFA inducing oxidative stress as an anticancer strategy on different tumor cell lines, such as prostate cancer, breast cancer, pancreatic cancer, leukemia, and melanoma [30–34]. ROS-mediated apoptosis by WFA was shown to depend on both intrinsic and extrinsic pathways. Mitochondrial membrane potential loss, release of cytochrome c and translocation of Bax, as well as increase in caspase-8 activity were observed together with the decrease of Bid, as crosstalk between intrinsic and extrinsic pathways [32]. Accordingly, we demonstrated that WE increased intracellular ROS levels. The remarkable inhibition of the proapoptotic potential of WE after co-treatment with NAC confirms the key role of ROS production in the apoptosis induced by WE. Similar data were obtained in both estrogen receptor (ER) positive- and ER negative-breast cancer cell lines, where the apoptotic effect of WFA was blunted by the presence of antioxidants [30].
Notably, selectivity by WFA towards cancer cells was observed in pancreatic and breast cancer cells, as compared to normal human fibroblasts and normal human mammary epithelial cell line [30,34]. ROS levels in cancer cells are close to the threshold and a ROS-mediated apoptotic mechanism represents an established indicator of cancer selectivity for an anticancer compound [35].
WE extract caused a dose-dependent ROS generation in Jurkat cells. This finding is in agreement with previous studies reporting the ROS-generating ability of a similar WE extract [32] and some of its components such as WFA [32,33,36–38]. ROS generation induced by WE extract reached a plateau after 6 h of incubation. This suggests that the extract rapidly induces a pro-oxidative status in intoxicated cells. Similar results were obtained by Malik [32], who found a significant ROS increase following 1 to 3 h of exposure to WFA [38]. The co-incubation of cells with WE extract and NAC, an established ROS scavenger, quenched the ROS generation induced by WE. This finding is in conformity with previous data that reported that NAC attenuates Withania-induced ROS production in several cell lines [32,36–38]. Co-incubation with o-Phe, an iron chelator that breaks Fenton reaction and stops ROS generation [39], attenuated ROS generation to a similar extent as NAC. These data strengthen the notion that WE causes the cellular formation of ROS. Since analyses performed on melanoma cell lines treated with WFA recorded mitochondrial ROS generation [33], we investigated whether the mitochondrial respiratory chain is involved in this process. Rot, a prototypical Complex I inhibitor [40], did not affect WE-induced ROS production, suggesting that this complex is not involved in this process and that further studies will be needed to individuate the exact site of ROS production.
ROS production and endoplasmic reticulum (ER) stress are critical event promoting ICD, which is also associated with the expression and/or release of DAMPs [41]. For example, calreticulin is a DAMP usually located on the lumen of ER and translocated on the extracellular membrane in case of ER stress [41]. ER regulates many cellular events including [Ca2+]i levels. Alterations in Ca2+
homeostasis causes ER stress [42]. In our experimental settings, WE treatment causes ROS production and increases [Ca2+]i levels. Accordingly, to the best of our knowledge, we demonstrated for the
first time the ability of Withania to induce ICD starting from the lowest tested concentrations, as indicated by the up-regulation of calreticulin, Hsp-70, Hsp-90, and ATP release. The expression of these molecules increases the immunogenic profile of tumor cells, thus promoting the innate immune system response [43]. However, WFA and WDA that represent the two main constituents of our WE extract did not induce ICD either alone or in association. Recent evidence shows that WFA does not
Toxins 2016, 8, 147 9 of 15
alter the expression of Hsp-90 either in lymphoma or in pancreatic cells, and inhibits Hsp-90 with an ATP-independent mechanism [44–46]. The anticancer activity of WFA depends on the inhibition of critical kinases and cell-cycle regulators controlled by Hsp-90 [44,45]. Hsp-90 is a molecular chaperone involved in regulating protein folding and modulating a number of oncogenic client proteins playing a critical role in oncogenesis and cancer progression. Hsp-90 depends upon different co-chaperones for its function. WFA blocks the association of Hsp-90 to Cdc37, i.e., its co-chaperone, thus acting as a potent Hsp-90-client modulating agent [46]. The different activity of the two withanolides and WE could be imputable to the complex nature of WE. In other words, the combined effects of the bioactive molecules of the extract could differently influence DAMPs’ expression.
An immunostimulatory activity of an aqueous/alcoholic (1:1) root extract of Withania has been reported on BALB/c mice and on ex vivo and in vitro macrophages [47]. The immunostimolatory activity of Withania together with the induction of ICD represents a promising strategy for the generation of a tumor-specific response.
Finally, we analyzed the genotoxic potential of WE. Our results showed that the treatment of Jurkat cells with WE significantly boosts H2A.X phosphorylation, which is an index of the ability of a compound to interact with DNA thus triggering a genotoxic lesion. However, some recent in vivo studies reported the lack of genotoxicity of one of the most important constituents of Withania, i.e., WFA, and demonstrated its ability to provide protection against the 7,12-dimethylbenz(a)anthracene-induced genotoxicity [48,49]. As with the different behavior of WE and withanolides in ICD induction, the different genotoxic profile of WE and WFA could be due to the matrix effects. Genotoxic studies on complex products of natural origin are usually performed on single phytochemicals rather than on the product in its complexity. The matrix effect can cause an incomplete release of a key constituent from the vegetal matrix or modulate its bioavailability. This means that the use of toxicity data concerning the pure phytochemical are unsuited for the purposes of assessing the risk derived from the use of the same phytochemical within the complex vegetal matrix [2]. The use of Withania is suggested in different contexts including naturopathic care for anxiety [50], anti-infertility care [51], and osteoarthritis care [52]. Its genotoxicity should be carefully considered for an accurate assessment of its risk–benefit profile. It is important to note that the H2A.X phosphorylation test used in our study is able to detect only premutational, thus reparable DNA lesions. For this reason, further experiments are needed to define the net and actual mutagenic effect of the lesions caused by WE and to directly relate the DNA damage to the mutagenic effect.
4. Experimental Section 4.1. WE Preparation
Withania somnifera roots were collected during the balsamic period (summer) and authenticated by Dr. Paolo Scartezzini, Maharishi Ayurveda Product Ltd., Noida, India. The quality control was performed by Vedic Herbs s.r.l. (Caldiero, VR, Italy), which gifted us with a sample of root powder (voucher #12/11). The extract was prepared by mixing 10 g of Withania root powder with 100 mL of DMSO. The extract was vortexed for 15 min at room temperature and centrifuged to discard any insoluble part. The experiments and the HPLC analysis were performed using this stock solution of 100 mg/mL.
4.2. HPLC Analysis
WE was subjected to RP-HPLC-DAD analysis to identify and quantify the main phytomarkers. The reference compounds WFA, WDA, withanolide B, and withanone were purchased from Extrasynthese, Lyon, France. WFA and WDA were used as external standards to set up and calculate appropriate calibration curves. The analyses were performed using a Jasco modular HPLC (model PU 2089, Jasco Corporation, Tokyo, Japan,) coupled to a diode array apparatus (MD 2010 Plus) linked to an injection valve with a 20 µL sampler loop. The column used was a Kinetex XB-C18 (5 µm,
Toxins 2016, 8, 147 10 of 15
15 cm ˆ 0.46 cm) with a flow rate of 0.6 mL/min. The analyses were performed at 25˝C with mobile
phase and gradient chosen according to literature [17].
Following chromatogram recording, sample peaks were identified by comparing their ultraviolet (UV) spectra and retention time with those of the pure standards. Dedicated Jasco software (PDA version 1.5, Jasco Corporation, 2004) was used to calculate peak area by integration.
4.3. Validation
The individual stock solutions of each phytomarkers were prepared in ethanol or acetonitrile. The calibration curves of the considered compounds were prepared within different range: 500–50 µg/mL for WFA, and 100–10 µg/mL for WDA. Each calibration solution was injected into HPLC in triplicate. The calibration graphs were provided by the regression analysis of the peak area of the analytes versus the related concentrations. The analysis of the extract was performed under the same experimental conditions. The obtained calibration graphs allowed the determination of the concentration of the phytomarkers inside the extract.
Limit Of Detection (LOD) and LOQ were calculated following the approach based on the standard deviation of the response and the slope for WFA and WDA, on signal and noise ratio for withanolide B and withanone, as presented in the “Note for guidance on validation of analytical procedures: text and methodology”, European Medicine Agency ICH Topic Q2 (R1). The accuracy was reported as percent of recovery and was estimated by adding known amount of analyte in the studied sample.
4.4. Cell Cultures
Human T-lymphoblastoid cells (Jurkat) were provided from LGC standards (LGC Group, Middlesex, UK). Cells were grown in suspension in Roswell Park Memorial Institute (RPMI) 1640 supplemented with 10% heat-inactivated bovine serum, 1% penicillin/streptomycin solution, and 1%
L-glutamine solution (all obtained from Biochrom, Merck Millipore, Darmstadt, Germany). Cells were incubated at 37˝C with 5% CO
2. To maintain exponential growth, the cultures were diluted to never
exceed the maximum suggested density of 3 ˆ 106cells/mL.
4.5. Cell Treatment
Cells were treated with increasing concentrations of WE (0.0–1.6 mg/mL) for 1, 3, 6 or 24 h, according to the experimental requirements, or with WFA, WDA or WFA plus WDA for 24 h. WFA and WDA were tested at the concentrations found in the WE extract at 0.2, 0.4 and 0.8 mg/mL: 0.23–0.92 µg/mL for WFA; 0.08–0.32 µg/mL for WDA. Etoposide 10 µM and hydrogen peroxide 0.1 mM were used as positive controls. In some experiments, a co-treatment of WE with NAC or
L-asparagine was performed.
4.6. Analysis of Cell Viability and Induction of Apoptosis
To determine cells’ viability, Guava ViaCount Reagent (Merck Millipore, Darmstadt, Germany) was used according to manufacturer’s instructions. Briefly, cells were appropriately diluted with the reagent containing 7-amino-actinomycin D (7-AAD) and incubated at room temperature in the dark for 5 min before detection with flow cytometer. Furthermore, to discriminate between necrotic and apoptotic events, Guava Nexin Reagent (Merck Millipore) was used. Through the use of 7-AAD and annexin V-phycoerythrin, the assay allows the discrimination of apoptotic and necrotic events. Cells were incubated with the reagent for 20 min at room temperature in the dark and then analyzed via flow cytometry. IC50 was calculated by interpolation from dose–response curve. Concentrations ď IC50
Toxins 2016, 8, 147 11 of 15
4.7. Cell-Cycle Analysis
After treatment with WE for 24 h, cells were fixed with 70% ice-cold ethanol and, after washing, suspended in 200 µL of Guava Cell Cycle Reagent (Merck Millipore), containing propidium iodide. At the end of incubation at room temperature for 30 min in the dark, samples were analyzed via flow cytometry.
4.8. Measurement of [Ca2+]i
After WE treatment for 6 or 24 h, [Ca2+]iwas analyzed by using Fura Red™, AM (Thermo Fisher
Scientific, Carlsbad, CA, USA), according to manufacturer’s instructions. Briefly, after treatment, cells were incubated with the dye that freely permeates the cytoplasmic membrane but, once inside the cells, is hydrolyzed by the intracellular esterases and trapped into the cells. The fluorescence of this molecule is enhanced once it binds Ca2+. To determine the optimal concentration of dye, a titration of Fura RedTM, AM was performed by loading Jurkat cells with a range of concentrations recommended by the manufacturer (1–10 µM). The exposure of cells to Fura Red can cause cell death [53]. Thus, the use of the lowest concentration of Fura Red is recommended. Following this experimental phase, the concentration of 1 µM was adopted.
To detect intracellular calcium levels, Jurkat cells were incubated at 37˝C for 30 min in PBS
without calcium and magnesium. This buffer condition allows to detect the intracellular calcium stores and exclude the secondary increase in [Ca2+]idue to Ca2+entry [54]. Moreover, the removal of external
Ca2+reduces the non-specific fluctuations in [Ca2+]
inormally observed during the first 20–30 s of
sample acquisition via flow cytometry. Results are expressed as MFI. 4.9. Detection of ROS Production
ROS production was determined after 1, 3, 6, 18 or 24 h of WE treatment by using the probe dihydrorhodamine (DHR, 10 µM) [55], which was added during the last 15 min of incubation. Hydrogen peroxide was used as positive control. Additionally, cells were pre- treated for 30 min with Rot (2 µM) or o-Phe (10 µM) and co-treated for 6 h with WE (0.8 mg/mL). In some experiments, cells were co-treated for 6 h with WE (0.8 mg/mL) plus NAC (10 mM). After three washing in PBS, cellular fluorescence was imaged using a Leica DMLB/DFC300F fluorescence microscope (Leica Microsystems, Wetzlar, Germany) equipped with an Olympus ColorviewIIIu CCD camera (Polyphoto, Milan, Italy). Fluorescence images (100 cells per sample from randomly selected fields) were digitally acquired and processed for fluorescence determination at the single cell level on a personal computer using the public domain program, Image J. Mean fluorescence values were determined by averaging the fluorescence of at least 100 cells/treatment condition/experiment.
4.10. Analysis of Calreticulin Translocation, Hsp-70 and Hsp-90 Expression, and ATP Release
After 6 or 24 h of treatment, cells were washed and incubated with phycoerythrin-labeled calreticulin antibody (1:100, Abcam, San Francisco, CA, USA) or isotope-matched negative control (isotypic mouse IgG1 K Alexa Fluor 488®) (eBioscience, San Diego, CA, USA).
To analyze Hsp-70 and Hsp-90 expression, cells were incubated with an anti-Hsp-70 or anti-Hsp-90 antibody (1:100, Abcam, for both antibodies) and, after washing, incubated with fluorescein isothyocianate-labeled secondary antibody (1:100, Sigma, Merck Millipore, Darmstadt, Germany) or the isotype control. Mean fluorescence was detected via flow cytometry.
The kit ATPLite™ 1step (Perkin Elmer, Waltham, MA, USA) was used for the detection of ATP extracellular concentration. Jurkat cells were seeded and treated with WE in Hank's Balanced Salt Solution (HBSS) or complete medium for 6 and 24 h, respectively. At the end of incubation, supernatants were collected and treated with 100 µL of ATPLite 1step reagent containing luciferase and D-luciferin. After shaking for 2 min at 700 rpm using the orbital microplate shaker 711/+
Toxins 2016, 8, 147 12 of 15
(Asal srl, Florence, Italy), luminescence of the samples was measured in a 96-well black plate using the microplate reader Victor X3 (Perkin Elmer).
4.11. DNA Damage Analysis
Phosphorylation of histone P-H2A.X was used as marker of WE genotoxic potential. After, 6 h of treatment with WE, cells were fixed, permeabilized and incubated for 30 min in the dark at room temperature with an anti-P-H2A.X-Alexa Fluor®antibody (Merck Millipore). Etoposide 10 µM was used as positive control. Samples were analyzed via flow cytometry.
4.12. Flow Cytometry
EasyCyte 5HT (Merck Millipore) was used to perform all flow cytometric analyses, with the exception of the measurements of [Ca2+]
iperformed by using a FACSCanto II (BD Bioscience, Franklin
Lakes, NJ, USA). For each sample, approximately 5000 events were evaluated. 4.13. Statistical Analysis
All results are expressed as mean ˘ SEM of at least three independent experiments. Differences between treatments were assessed by t test or one-way ANOVA and Dunnet or Bonferroni was used as post-tests. All statistical analyses were performed using GraphPad InStat 5.0 version (GraphPad Prism, San Diego, CA, USA, 2007). p < 0.05 was considered significant.
Acknowledgments: This work was supported by FARB—Finanziamenti di Ateneo alla Ricerca di base 2012 (RFBO124222).
Author Contributions:C.F. and P.S. conceived and designed the experiments; E.T., C.C., E.C., E.d.G., M.T., A.R.D., and B.C. performed the experiments; C.F., E.T., C.C., S.P., A.G., and M.T. analyzed the data; and C.F., E.T., C.C., P.S., G.V., A.G., and P.H. wrote the paper.
Conflicts of Interest:The authors declare no conflict of interest. References
1. Global Status Report on Noncommunicable Diseases 2014. Available online: http://www.who.int/nmh/ publications/ncd-status-report-2014/en/ (accessed on 22 December 2015).
2. Fimognari, C.; Ferruzzi, L.; Turrini, E.; Carulli, G.; Lenzi, M.; Hrelia, P.; Cantelli-Forti, G. Metabolic and toxicological considerations of botanicals in anticancer therapy. Expert Opin. Drug Metab. Toxicol. 2012, 8, 819–832. [CrossRef] [PubMed]
3. Rivera, E.; Gomez, H. Chemotherapy resistance in metastatic breast cancer: The evolving role of ixabepilone. Breast Cancer Res. 2010, 12 (Suppl. 2), 1–12. [CrossRef] [PubMed]
4. Kroemer, G.; Galluzzi, L.; Kepp, O.; Zitvogel, L. Immunogenic cell death in cancer therapy. Annu. Rev. Immunol. 2013, 31, 51–72. [CrossRef] [PubMed]
5. Hou, W.; Zhang, Q.; Yan, Z.; Chen, R.; Zeh, H.J., III; Kang, R.; Lotze, M.T.; Tang, D. Strange attractors: DAMPs and autophagy link tumor cell death and immunity. Cell Death Dis. 2013, 4, e966. [CrossRef] [PubMed] 6. Newman, D.J.; Cragg, G.M.; Snader, K.M. Natural products as sources of new drugs over the period
1981–2002. J. Nat. Prod. 2003, 66, 1022–1037. [CrossRef] [PubMed]
7. Chen, S.T.; Dou, J.; Temple, R.; Agarwal, R.; Wu, K.M.; Walker, S. New therapies from old medicines. Nat. Biotechnol. 2008, 26, 1077–1083. [CrossRef] [PubMed]
8. Newman, D.J.; Cragg, G.M. Natural products as sources of new drugs over the 30 years from 1981 to 2010. J. Nat. Prod. 2012, 75, 311–335. [CrossRef] [PubMed]
9. Nance, C.L. Clinical efficacy trials with natural products and herbal medicines. In Phytotherapies: Efficacy, Safety and Regulation; Ramzan, I., Ed.; John Wiley & Sons Inc.: Hoboken, NJ, USA, 2015; pp. 65–88.
10. Shanafelt, T.D.; Call, T.G.; Zent, C.S.; Leis, J.F.; LaPlant, B.; Bowen, D.A.; Roos, M.; Laumann, K.; Ghosh, A.K.; Lesnick, C.; et al. Phase 2 trial of daily, oral Polyphenon E in patients with asymptomatic, Rai stage 0 to II chronic lymphocytic leukemia. Cancer 2013, 119, 363–370. [CrossRef] [PubMed]
Toxins 2016, 8, 147 13 of 15
11. Kulkarni, S.K.; Dhir, A. Withania somnifera: An Indian ginseng. Prog. Neuropsychopharmacol. Biol. Psychiatry 2008, 32, 1093–1105. [CrossRef] [PubMed]
12. Masevhe, N.A.; McGaw, L.J.; Eloff, J.N. The traditional use of plants to manage candidiasis and related infections in Venda, South Africa. J. Ethnopharmacol. 2015, 168, 364–372. [CrossRef] [PubMed]
13. Khanna, D.; Sethi, G.; Ahn, K.S.; Pandey, M.K.; Kunnumakkara, A.B.; Sung, B.; Aggarwal, A.; Aggarwal, B.B. Natural products as a gold mine for arthritis treatment. Curr. Opin. Pharmacol. 2007, 7, 344–351. [CrossRef] [PubMed]
14. Nosalova, G.; Fleskova, D.; Jurecek, L.; Sadlonova, V.; Ray, B. Herbal polysaccharides and cough reflex. Respir. Physiol. Neurobiol. 2013, 187, 47–51. [CrossRef] [PubMed]
15. Jain, S.; Shukla, S.D.; Sharma, K.; Bhatnagar, M. Neuroprotective effects of Withania somnifera Dunn. in hippocampal sub-regions of female albino rat. Phytother. Res. 2001, 15, 544–548. [CrossRef] [PubMed] 16. Rai, M.; Jogee, P.S.; Agarkar, G.; Santos, C.A. Anticancer activities of Withania somnifera: Current research,
formulations, and future perspectives. Pharm. Biol. 2016, 54, 189–197. [CrossRef] [PubMed]
17. Chaurasiya, N.D.; Uniyal, G.C.; Lal, P.; Misra, L.; Sangwan, N.S.; Tuli, R.; Sangwan, R.S. Analysis of withanolides in root and leaf of Withania somnifera by HPLC with photodiode array and evaporative light scattering detection. Phytochem. Anal. 2008, 19, 148–154. [CrossRef] [PubMed]
18. Sharma, A.; Singh, K.; Almasan, A. Histone H2AX phosphorylation: A marker for DNA damage. Methods Mol. Biol. 2012, 920, 613–626. [PubMed]
19. Vyas, A.R.; Singh, S.V. Molecular targets and mechanisms of cancer prevention and treatment by withaferin a, a naturally occurring steroidal lactone. AAPS. J. 2014, 16, 1–10. [CrossRef] [PubMed]
20. Choudharymy, M.I.; Yousuf, S.; Atta-Ur-Rahman. Withanolides: Chemistry and antitumor activity. In Natural Products; Ramawat, K.G., Merillon, J.M., Eds.; Springer-Verlag: Berlin, Germany; Heidelberg, Germany, 2013; pp. 3465–3495.
21. Ichikawa, H.; Takada, Y.; Shishodia, S.; Jayaprakasam, B.; Nair, M.G.; Aggarwal, B.B. Withanolides potentiate apoptosis, inhibit invasion, and abolish osteoclastogenesis through suppression of nuclear factor-kappaB (NF-kappaB) activation and NF-kappaB-regulated gene expression. Mol. Cancer Ther. 2006, 5, 1434–1445. [CrossRef] [PubMed]
22. Stewart, Z.A.; Westfall, M.D.; Pietenpol, J.A. Cell-cycle dysregulation and anticancer therapy. Trends Pharmacol. Sci. 2003, 24, 139–145. [CrossRef]
23. Shapiro, G.I.; Harper, J.W. Anticancer drug targets: Cell cycle and checkpoint control. J. Clin. Investig. 1999, 104, 1645–1653. [CrossRef] [PubMed]
24. Oh, J.H.; Lee, T.J.; Kim, S.H.; Choi, Y.H.; Lee, S.H.; Lee, J.M.; Kim, Y.H.; Park, J.W.; Kwon, T.K. Induction of apoptosis by withaferin A in human leukemia U937 cells through down-regulation of Akt phosphorylation. Apoptosis 2008, 13, 1494–1504. [CrossRef] [PubMed]
25. Senthil, V.; Ramadevi, S.; Venkatakrishnan, V.; Giridharan, P.; Lakshmi, B.S.; Vishwakarma, R.A.; Balakrishnan, A. Withanolide induces apoptosis in HL-60 leukemia cells via mitochondria mediated cytochrome c release and caspase activation. Chem. Biol. Interact. 2007, 167, 19–30. [CrossRef] [PubMed] 26. Kruman, I.; Guo, Q.; Mattson, M.P. Calcium and reactive oxygen species mediate staurosporine-induced
mitochondrial dysfunction and apoptosis in PC12 cells. J. Neurosci. Res. 1998, 51, 293–308. [CrossRef] 27. Nicotera, P.; Orrenius, S. The role of calcium in apoptosis. Cell Calcium 1998, 23, 173–180. [CrossRef] 28. Salvioli, S.; Ardizzoni, A.; Franceschi, C.; Cossarizza, A. JC-1, but not DiOC6(3) or rhodamine 123, is a
reliable fluorescent probe to assess∆Ψ changes in intact cells: Implications for studies on mitochondrial functionality during apoptosis. FEBS Lett. 1997, 411, 77–82. [CrossRef]
29. Oza, V.P.; Parmar, P.P.; Kumar, S.; Subramanian, R.B. Anticancer properties of highly purifiedL-asparaginase from Withania somnifera L. against acute lymphoblastic leukemia. Appl. Biochem. Biotechnol. 2010, 160, 1833–1840. [CrossRef] [PubMed]
30. Hahm, E.R.; Moura, M.B.; Kelley, E.E.; Van, H.B.; Shiva, S.; Singh, S.V. Withaferin A-induced apoptosis in human breast cancer cells is mediated by reactive oxygen species. PLoS ONE 2011, 6, e23354. [CrossRef] [PubMed]
31. Li, X.; Zhu, F.; Jiang, J.; Sun, C.; Wang, X.; Shen, M.; Tian, R.; Shi, C.; Xu, M.; Peng, F.; et al. Synergistic antitumor activity of withaferin A combined with oxaliplatin triggers reactive oxygen species-mediated inactivation of the PI3K/AKT pathway in human pancreatic cancer cells. Cancer Lett. 2015, 357, 219–230. [CrossRef] [PubMed]
Toxins 2016, 8, 147 14 of 15
32. Malik, F.; Kumar, A.; Bhushan, S.; Khan, S.; Bhatia, A.; Suri, K.A.; Qazi, G.N.; Singh, J. Reactive oxygen species generation and mitochondrial dysfunction in the apoptotic cell death of human myeloid leukemia HL-60 cells by a dietary compound withaferin A with concomitant protection by N-acetyl cysteine. Apoptosis 2007, 12, 2115–2133. [CrossRef] [PubMed]
33. Mayola, E.; Gallerne, C.; Esposti, D.D.; Martel, C.; Pervaiz, S.; Larue, L.; Debuire, B.; Lemoine, A.; Brenner, C.; Lemaire, C. Withaferin A induces apoptosis in human melanoma cells through generation of reactive oxygen species and down-regulation of Bcl-2. Apoptosis 2011, 16, 1014–1027. [CrossRef] [PubMed]
34. Nishikawa, Y.; Okuzaki, D.; Fukushima, K.; Mukai, S.; Ohno, S.; Ozaki, Y.; Yabuta, N.; Nojima, H. Withaferin A Induces Cell Death Selectively in Androgen-Independent Prostate Cancer Cells but Not in Normal Fibroblast Cells. PLoS ONE 2015, 10, e0134137. [CrossRef] [PubMed]
35. Trachootham, D.; Alexandre, J.; Huang, P. Targeting cancer cells by ROS-mediated mechanisms: A radical therapeutic approach? Nat. Rev. Drug Discov. 2009, 8, 579–591. [CrossRef] [PubMed]
36. Kakar, S.S.; Jala, V.R.; Fong, M.Y. Synergistic cytotoxic action of cisplatin and withaferin A on ovarian cancer cell lines. Biochem. Biophys. Res. Commun. 2012, 423, 819–825. [CrossRef] [PubMed]
37. Yu, S.M.; Kim, S.J. Production of reactive oxygen species by withaferin A causes loss of type collagen expression and COX-2 expression through the PI3K/Akt, p38, and JNK pathways in rabbit articular chondrocytes. Exp. Cell Res. 2013, 319, 2822–2834. [CrossRef] [PubMed]
38. Yu, S.M.; Kim, S.J. Withaferin A-caused production of intracellular reactive oxygen species modulates apoptosis via PI3K/Akt and JNKinase in rabbit articular chondrocytes. J. Korean Med. Sci. 2014, 29, 1042–1053. [CrossRef] [PubMed]
39. Sestili, P.; Diamantini, G.; Bedini, A.; Cerioni, L.; Tommasini, I.; Tarzia, G.; Cantoni, O. Plant-derived phenolic compounds prevent the DNA single-strand breakage and cytotoxicity induced by tert-butylhydroperoxide via an iron-chelating mechanism. Biochem. J. 2002, 364, 121–128. [CrossRef] [PubMed]
40. Teeter, M.E.; Baginsky, M.L.; Hatefi, Y. Ectopic inhibition of the complexes of the electron transport system by rotenone, piericidin A, demerol and antimycin A. Biochim. Biophys. Acta 1969, 172, 331–333. [CrossRef] 41. Krysko, D.V.; Garg, A.D.; Kaczmarek, A.; Krysko, O.; Agostinis, P.; Vandenabeele, P. Immunogenic cell death
and DAMPs in cancer therapy. Nat. Rev. Cancer 2012, 12, 860–875. [CrossRef] [PubMed]
42. Rao, R.V.; Ellerby, H.M.; Bredesen, D.E. Coupling endoplasmic reticulum stress to the cell death program. Cell Death Differ. 2004, 11, 372–380. [CrossRef] [PubMed]
43. Garg, A.D.; Nowis, D.; Golab, J.; Vandenabeele, P.; Krysko, D.V.; Agostinis, P. Immunogenic cell death, DAMPs and anticancer therapeutics: An emerging amalgamation. Biochim. Biophys. Acta 2010, 1805, 53–71. [CrossRef] [PubMed]
44. McKenna, M.K.; Gachuki, B.W.; Alhakeem, S.S.; Oben, K.N.; Rangnekar, V.M.; Gupta, R.C.; Bondada, S. Anti-cancer activity of withaferin A in B-cell lymphoma. Cancer Biol. Ther. 2015, 16, 1088–1098. [CrossRef] [PubMed]
45. Yu, Y.; Hamza, A.; Zhang, T.; Gu, M.; Zou, P.; Newman, B.; Li, Y.; Gunatilaka, A.A.; Zhan, C.G.; Sun, D. Withaferin A targets heat shock protein 90 in pancreatic cancer cells. Biochem. Pharmacol. 2010, 79, 542–551. [CrossRef] [PubMed]
46. Grover, A.; Shandilya, A.; Agrawal, V.; Pratik, P.; Bhasme, D.; Bisaria, V.S.; Sundar, D. Hsp90/Cdc37 chaperone/co-chaperone complex, a novel junction anticancer target elucidated by the mode of action of herbal drug Withaferin A. BMC Bioinf. 2011, 12. [CrossRef] [PubMed]
47. Malik, F.; Singh, J.; Khajuria, A.; Suri, K.A.; Satti, N.K.; Singh, S.; Kaul, M.K.; Kumar, A.; Bhatia, A.; Qazi, G.N. A standardized root extract of Withania somnifera and its major constituent withanolide-A elicit humoral and cell-mediated immune responses by up regulation of Th1-dominant polarization in BALB/c mice. Life Sci. 2007, 80, 1525–1538. [CrossRef] [PubMed]
48. Panjamurthy, K.; Manoharan, S.; Balakrishnan, S.; Suresh, K.; Nirmal, M.R.; Senthil, N.; Alias, L.M. Protective effect of Withaferin-A on micronucleus frequency and detoxication agents during experimental oral carcinogenesis. Afr. J. Tradit. Complement. Altern. Med. 2008, 6, 1–8. [CrossRef] [PubMed]
49. Panjamurthy, K.; Manoharan, S.; Menon, V.P.; Nirmal, M.R.; Senthil, N. Protective role of withaferin-A on 7,12-dimethylbenz(a)anthracene-induced genotoxicity in bone marrow of Syrian golden hamsters. J. Biochem. Mol. Toxicol. 2008, 22, 251–258. [CrossRef] [PubMed]
50. Cooley, K.; Szczurko, O.; Perri, D.; Mills, E.J.; Bernhardt, B.; Zhou, Q.; Seely, D. Naturopathic care for anxiety: A randomized controlled trial ISRCTN78958974. PLoS ONE 2009, 4, e6628. [CrossRef] [PubMed]
Toxins 2016, 8, 147 15 of 15
51. Ahmad, M.K.; Mahdi, A.A.; Shukla, K.K.; Islam, N.; Rajender, S.; Madhukar, D.; Shankhwar, S.N.; Ahmad, S. Withania somnifera improves semen quality by regulating reproductive hormone levels and oxidative stress in seminal plasma of infertile males. Fertil. Steril. 2010, 94, 989–996. [CrossRef] [PubMed]
52. Chopra, A.; Lavin, P.; Patwardhan, B.; Chitre, D. A 32-week randomized, placebo-controlled clinical evaluation of RA-11, an Ayurvedic drug, on osteoarthritis of the knees. J. Clin. Rheumatol. 2004, 10, 236–245. [CrossRef] [PubMed]
53. Wendt, E.R.; Ferry, H.; Greaves, D.R.; Keshav, S. Ratiometric analysis of fura red by flow cytometry: A technique for monitoring intracellular calcium flux in primary cell subsets. PLoS ONE 2015, 10, e0119532. [CrossRef] [PubMed]
54. Verriere, V.; Higgins, G.; Al-Alawi, M.; Costello, R.W.; McNally, P.; Chiron, R.; Harvey, B.J.; Urbach, V. Lipoxin A4 stimulates calcium-activated chloride currents and increases airway surface liquid height in normal and cystic fibrosis airway epithelia. PLoS ONE 2012, 7, e37746. [CrossRef] [PubMed]
55. Royall, J.A.; Ischiropoulos, H. Evaluation of 2’,7’-dichlorofluorescin and dihydrorhodamine 123 as fluorescent probes for intracellular H2O2in cultured endothelial cells. Arch. Biochem. Biophys. 1993, 302, 348–355.
[CrossRef] [PubMed]
© 2016 by the authors; licensee MDPI, Basel, Switzerland. This article is an open access article distributed under the terms and conditions of the Creative Commons Attribution (CC-BY) license (http://creativecommons.org/licenses/by/4.0/).