Dipartimento di Matematica e Informatica
Dottorato di Ricerca in Matematica e Informatica XXXI Ciclo
Visual Behavior Analysis in Retail Scenario
Vito Santarcangelo
Tesi di Dottorato di Ricerca
“Anche al Sud si pu`o” Alberto Camporesi
Abstract
The retail world is today highly competitive and has seen its logics completely rev-olutionized by the introduction of e-commerce that have prompted a reaction from the retail market, requiring greater attention to the consumer. We therefore moved from the world of traditional marketing (generic flyer) to that of 1to1 marketing (specific attention to the customer, profiling and personalization of the assortment offer). In this context the need arises to introduce innovative tools that can allow the physical sales spaces to be kept competitive, interacting more with the customer in order to create a more relevant commercial proposal. As a consequence, the computer vision represented one of the possible means to carry out the behavioral analysis of the consumer useful for dynamically adapting the assortment proposal. DOOH (Digital Out Of Home) in its most widespread form of interactive point-of-sale kiosks is one of the best tools to get in touch with the customer, create a synergy with him, listen to his needs in order to improve the offer, the level of service and therefore customer satisfaction. Next to DOOH, it is necessary to introduce further and time-continuous monitoring tools, which map the entire customer’s shopping experience into the point of sale. For this purpose the egocentric vision is intro-duced through the use of cam narratives on board the trolleys, which allow a timely story of the consumer, called Visual Market Basket Analysis (evolution of Market Basket Analysis), which generates process functional alerts to the improvement of the service offered. The story of these approaches is provided in this PhD thesis, which tells the three-year course carried out, its experiments and possible future de-velopments. This study has been conducted thanks to the support of Centro Studi S.r.l., a sister company of a privately owned consumer goods distribution company called Orizzonti Holding Group, located in southern Italy. The study has been im-plemented through an industrial application approach, in a real context (Futura Supermarkets). Consequently, the PhD thesis has considered the typical difficulties of a challenging environment, starting from the creation and acquisition of a dataset to the integration of the approach in the current business processes.
Acknowledgements
A sincere thank you goes to my tutor Professor Sebastiano Battiato, a fantastic person and a model to be followed. He made this PhD unforgettable due to his professionalism and humanity. In addition, I want to say thank you to Professor Giovanni Maria Farinella, who has always been available and willing to offer his support. These two people made the environment of the University of Catania and the IPLab laboratory unique. The organized summer schools are something that I will always carry in my heart. Thanks also to Professor Alberto Camporesi (special supporter), to Costantino Di Carlo and Valerio Di Carlo, who have financed the PhD and who represent a very high-quality company in southern Italy. I thank my family and Stefania who also always supported me during my PhD. A special thank you is for my scientific guide, Professor Egidio Cascini, who has always supported my passion for research. A further thank you goes to Filippo Stanco, Dario Allegra and Diego Sinit`o, good friends who made my days in Catania more pleasant. A hug and a final thank you goes to all those people I met at the department of mathematics and computer science of the University of Catania and in the IPLab laboratory. They are another confirmation of the fact that the people of Sicily are special.
Contents
Abstract ii
Acknowledgements iii
1 INTRODUCTION 1
1.1 Scope of the thesis . . . 1
1.1.1 Context . . . 2
1.1.2 Marketing 3.0 . . . 3
1.1.3 DOOH . . . 4
1.1.4 Customer Tracking . . . 7
1.2 Papers and Patents . . . 10
2 BEHAVIOR ANALYSIS IN RETAIL CONTEXT 13 2.1 DOOH and Retail . . . 13
2.2 Face Detection . . . 14 2.3 Datasets . . . 16 2.4 Gender Recognition . . . 20 2.4.1 Face Detection . . . 20 2.4.2 Face Representation . . . 20 2.4.3 Gender Classification . . . 21
2.4.4 State of the Art Results . . . 22
2.5 Age Estimation . . . 25
2.6 Research Proposal . . . 26
2.7 Behavioral Analysis System . . . 27
2.8 Benchmark Analysis . . . 31
2.9 Google Cloud Platform . . . 32
2.9.1 Google Cloud Platform: Image Analysis . . . 34
2.10 Embedded Device Tests . . . 40
2.11 Thermal Cameras . . . 42
2.12 GDPR and DOOH . . . 43
3 VISUAL MARKET BASKET ANALYSIS 50 3.1 Market Basket Analysis . . . 50
3.1.1 Terminology . . . 50
3.1.2 How it works . . . 51
3.2 MBA technical approach . . . 52
3.2.1 Apriori . . . 52
3.2.2 Eclat . . . 53
3.2.3 Pattern-growth . . . 53
3.2.4 Observation . . . 55
3.3 Egocentric vision for Visual Market Basket Analysis . . . 56
3.3.1 Methods for VMBA . . . 58
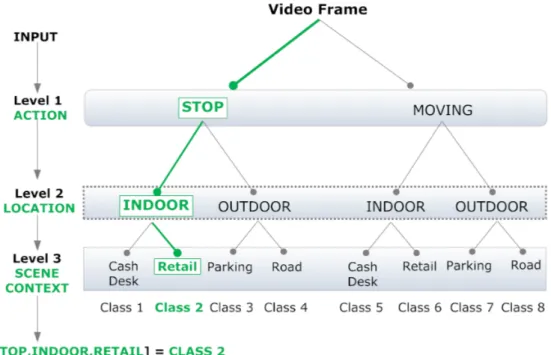
3.3.2 Actions . . . 59
3.3.3 Location . . . 60
3.3.4 Scene Context . . . 60
3.3.5 Classifications . . . 61
3.3.6 VMBA15 Dataset . . . 63
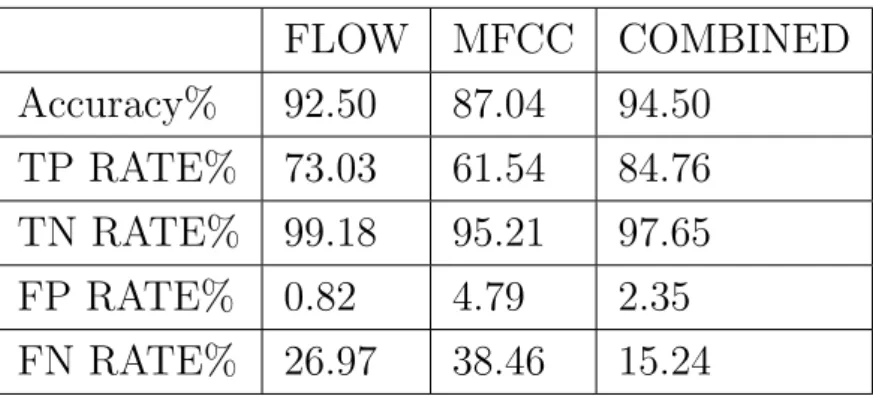
3.3.7 Experimental settings and results . . . 64
3.4 Patented System . . . 67
3.5 Deep Learning Overview . . . 73
3.5.1 CNN structure . . . 74
3.5.2 CNN training . . . 76
3.5.3 Deep Learning Frameworks . . . 82
3.5.4 Code and test . . . 84
3.5.5 R-CNN . . . 87
3.5.6 Retail CNN Approach . . . 90
3.6 VMBA with 14 classes . . . 92
3.6.1 Proposed Method . . . 94
3.6.2 Experimental Settings and Results . . . 97
3.6.3 Overall Classification . . . 100
4 FUTURE DEVELOPMENT 104
4.1 Introduction . . . 104
4.2 DOOH on infrared spectrum . . . 104
4.2.1 Face extraction . . . 105
4.2.2 Gender Recognition . . . 106
4.2.3 Infrared Analysis . . . 106
4.3 VMBA Evolution . . . 108
Chapter 1
INTRODUCTION
1.1
Scope of the thesis
The thesis focuses on behavioral analysis in the whole of retail scenarios. Today, the retail world is one of the areas of application of the Computer Vision where many possible implementations can be developed. In fact, Computer Vision allows to carry out important developments and analyzes in the world of supermarkets. Today, knowing the consumer is a plus to orient marketing choices and to greatly improve the appeal of their points of sale, which become spaces that are greatly optimized for the 1to1 sale. In this context, the present PhD thesis is divided into two directions aimed at carrying out the customer’s ‘behavior analysis’ within the point of sales. More specifically, to perform behavioral analysis it is necessary to work on two goals: analyzing the interaction of the customer using digital signage devices and tracking the customer inside the point of sale. This context itself lends to an application of the Computer Vision, since it is possible to reach the goals of behavioral analysis of the consumer thanks to the analysis of the multimedia flows acquired through distributed cameras. The first goal is implemented through Computer Vision techniques as Gender/Age Estimation, Emotion Detection, Pose Estimation techniques to map the customer’s propensity to purchase through NLP (Neuro-linguistic programming). To achieve this objective, it was necessary to apply algorithms to photos/videos acquired through digital signage devices (interactive totem). The second goal is implemented by using a customized approach of Video Synopsis techniques (video summarization) applied to shopping carts equipped with egocentric camera. Compared to other approaches (e.g., WIFI, BLE), Computer Vision allows to minimize the costs for monitoring the retail scenario, allows for
adaptations to dynamic changes of the store and allows for continuous monitoring of the consumers’ experience. The approach described in the PhD thesis has been named Visual Market Basket Analysis. To achieve this target, the videos have been acquired by micro-cameras placed on the carts, in a store of an important supermarket chain in southern Italy, called Futura. The approaches presented in this thesis for the two above mentioned goals are innovative and patented. The ‘behavior analysis’ is integrated into the ambitious goal of creating a ‘visual genome’ of the point of sale.
1.1.1
Context
The last 20 years are characterized by a rapid evolution in the communication media and consequently a revolution in the Marketing and Communication strategy. The evolution of these recent years is not very far from the Industrial Revolution or the massive spread of televisions in households. Just 20 years ago, Google was not existing, just 10 years ago Facebook and Instagram were not there. The way we consume is rapidly changing: The Observatory of Mobile B2C Strategy from Polytechnic of Milano is highlighting how the Mobile advertising is increasing this year 53% vs 2014 in Italy [8]. Speed is the key word for Companies who want to efficiently communicate with consumers: they need to be able to change, learn and update knowledge in a fast-paced environment. Content & Innovation are the 2 new key pillars of the marketing mix for a successful communication. The real challenge for Companies and Brands in the digital world is to be able to create and maintain a connection with the target audience. They need to deliver a meaningful content that resonate in a turbulent and noisy framework. They need to be able to attract the attention in a world where the competition is not anymore limited to the competitors’ products voice, but is enlarged to a set of completely different industries such as television shows, films, videos and even sports events. Digital communication has, in fact, an ambivalent profile, being able to increase visibility for small and local brands or companies in the same way of a big multinational, but also creating a tremendous amount of noise. The pure emotional involvement is not enough anymore if not anchored to the relevant set of values of the addressed target. From the classic consumer centric marketing approach of Marketing 2.0 based mainly
on gender/ age/occupation segmentation, marketing is rapidly evolving to a “values key set” segmentation approach in Marketing 3.0 [9].
1.1.2
Marketing 3.0
This approach [10] is more adaptable to the shift from the “one-to-one” communica-tion to the ”‘many-to-many” world of Social Networks, where everybody is able to influence, build, comment, share and shape a product or a service, through his direct action and contribution via the digital media. GFK has developed the ValueScope⃝R
model [11] measuring 54 Personal Values demonstrating that:
• Personal Values are at the core of human kind attitudes, motivations and behaviors;
• They encompass all dimensions of life and are directly linked to the choices we make;
• They provide a common ground for understanding differences between and within cultures and demographics;
• They are relatively stable over time and enable to spot gradual societal changes. Reassembling the values in key “value types” they can be used in innovation pro-cesses to develop products that get to the heart of consumers’ needs by considering their aspirations and helping people to meet them. They can be used in communi-cations to establish messages that will deeply resonate with consumers and provide stronger cut through. They can also provide a more insightful way to encourage consumers’ loyalty, as value set is normally more stable in terms of time.
This context is related to the new digital born generation, the so called Genera-tion Y or Millenials, that are the key target for almost all the marketers around the world and the most skeptical to standard advertising and communication. They are considered as the trendsetters’ productive stream of the population. The ones able to rapidly spread words of mouth and declare the ultimate judgment on a product or service success or failure. This generation is constituted by people who were born from early 80’s until early ’00. They are characterized by a natural and extensive use of digital technology and a great familiarity with communication. Being ex-posed their entire life to TV commercials, magazines and slogans, Millennias are
extremely diffident to standard advertising and just do not trust this way of being approached anymore. They tend to refuse the “one-direction” product communica-tion and their attencommunica-tion is quite low, unless entertained, stimulated and involved in a cocreated content. The attention to content becomes therefore key to establish a relationship with this target, with a process that primarily focus on the key value type identification and adapt the message and the style even dramatically to the media supporting it. Brands Companies are not only deputed to satisfy a need but are asked to actively take part in playing a role to define a value frame for a “better world”. Brand entertainment, communities, story-telling and edutainment are some of the most efficient way to do it. Some of the most famous examples of these trends are Companies as PG who started branding the commercials with the PG logo not anymore only as a quality statement, but as a true values proposition and a community umbrella. Brands as Dove with their “natural Beauty” campaign or Coca-Cola with the new released “Taste the feeling” campaign were able to per-form a shift from a gender/need/taste pillars segmentation to a logo used as the carrier of the key brand value and promise. Looking forward it will be key also for the retail industry to start segmenting the audience in a more deep and complex way, delivering more complex content than just “You can find the product X, better displayed and at a better price”. Opportunities of buying products are already not limited to proximity anymore, trust engagement is just a “never-ending-feed” pro-cess for new generations and competition is not anymore limited to other retailers. Embracing analytical cultures and invisible analytics, to address this fast changing world can help also the retail industry to become expert at converting that data into business success. The result is improved customer engagement, insight that informs creativity and better ways to customize offers [12]. Invisible analytics (identified by GFK as one of the most prominent technical trends of 2016) could, for example, be the key ingredient in the effective use of augmented and virtual reality in retail environments.
1.1.3
DOOH
A possible example of implementation of the presented scenario is DOOH. Digital out of home (DOOH) symbolizes the dynamic media distributed across placed-based
Figure 1.1: Examples of DOOH devices (jumbotrons and interactive kiosk)
networks through digital signage devices [1] as addressable screens, kiosks, jukeboxes and jumbotrons, with the aim to engage customers and extend the effectiveness of marketing experience. An example of DOOH is provided by Futura Point kiosk, ap-peared in 2012, whose functionalities are patented [2]. Futura Point is a web-oriented kiosk, characterized by a touchscreen monitor, a barcode 1D/2D reader, a printer for coupons, a camera and a computer. DOOH applications are one of the most im-portant topic for retail environment [6], due to the change of traditional marketing into 1to1 approach, providing a custom shopping experience for the user. DOOH has received considerable interest from retailers and governmental institutions be-cause of the benefits obtained in better managing and respond to the preferences of the users [7]. The implementation of DOOH scenario requires more and more tech-nology, then there is an integration of Computer Vision techniques [13], Artificial Intelligence modules and Internet of Things. In fact, Computer vision provides algo-rithms to automatically collect soft biometrics of people in front of a smart screen or in a delimited controlled area. It is of great interest for industry. These approaches are mainly based on face detection module and involve gender recognition [14], age estimation [25], emotion recognition, gesture and pose detection algorithms [15]. In fact, the input about gender is very important to customize the shopping experience because it is possible to define two defined clusters, one for male and one for female. Thanks to the Age Estimation, it is possible to define some clusters for different age
targets. Combining gender, age and ethnicity input, emotion detection and skele-tal tracking analysis, it is possible to improve the dynamicity interactive of DOOH applications. Artificial Intelligence provides semantic networks for a support ontol-ogy based on knowledge-base. In an interconnected world of devices, also DOOH is an Internet of Things scenario, in fact, all the interactive interfaces are inter-connected sharing information for the dynamic interaction with the user. All these technologies are targeted to the analysis of the behavioral state of the buyer. In our patented approach about behavioral analysis [16], we consider at first the 4 possible “response modes” defined by Miller Heiman in “The New Strategic Selling” [17] that are: Growth, Trouble, Even Keel, Overconfident. These Concepts, specifically developed for B2B Buyer-Vendor transaction cases suggest that: Buyers in Growth mode perceive that by buying a product or service, they will produce growth for their company (opened to vendor offerings). In Trouble mode, buyers perceive that they have to fill rapidly a business gap (e.g. it is losing customers, losing money, decreasing productivity) and understand that something must change (opened to vendor offerings). Buyers in Even Keel mode do not perceive a large enough gap between their position and their goal, then there is no urgency to change anything (closed to vendor offerings). Buyers in Overconfident mode believe that they are doing so well that the suggestion that your offering might improve their situation is practically an insult (closed to vendor offerings). In fact, they have a weak grasp of the reality and their mind is then closed to suggestions before to the natural fall to the trouble mode. These concepts have been developed, applied and conceptually adapted, also to the B2C case and specifically utilized to tailor properly the Commu-nication to each specific Customer Response Mode detected or targeted, considering the related variability as a function of the situation and information perceived by the individuals. This approach requires to consider also psychological aspects, as the Color Psychology Analysis [18] and Neuro-linguistic programming (NLP) analy-sis [19]. Neuro-linguistic programming (NLP) is an approach developed by Richard Bandler and John Grinder (in the 1970s) to communication, personal development, and psychotherapy. NLP teaches the ability to calibrate or “read” people (sensory awareness). It means the ability to interpret changes in muscle tone, skin color and shininess, lower lip size and breathing rate and location. From these and other indications it is possible to determine what effect these changes can have on other
Figure 1.2: Response Modes
people.
This information serves as feedback as to whether the other person is or not in a specific, desired state of study or interaction. An important and often overlooked point is to know the singling out moment when the other person is in the state that you desire to detect. The development of this system is a multidisciplinary topic (computer vision, artificial intelligence, psychology and marketing) and it can improve current applications, providing new DOOH systems thanks to the use of an approach of complete ‘reading’ of people mind. The whole analysis could be validated further via a correlation between a set of actual behaviors and responses, determined in experimental and properly authorized sites, to achieve scientific levels of results acceptance, eventually differentiating the readings by considering specific applications. In the second chapter we will focus on the Behaviour Analysis starting from the basics until the last updates in the field, considering also two important commercial benchmarks.
1.1.4
Customer Tracking
Understanding customer behavior within the store is a very useful analysis for mar-keting purposes of a point of sale. There are numerous approaches to monitor-ing the consumer through, for example, the use of people countmonitor-ing devices, smart carts equipped with RFID technology, smartphone applications interconnected to the point-of-sale WIFI or BLE system, distributed camera systems within the point of sale. The people counting systems, in fact, make it possible to monitor the flows of people at the point of sale, considering the directions of movement. They are
Figure 1.3: People counter
particularly useful for activating alerts, for example at the cash desk and at the departments served (e.g. butchers, delicatessen). However, this is a minimal infor-mation, useful for statistical purposes, but not very analytical, by virtue of the fact that the number of passages and the direction of travel is taken from the counting system in a certain position.
An evolution is represented by the tracking of the carts using RFID technol-ogy. This system provides for the installation in the point of sale of control points equipped with readers with RFID antenna (e.g. UHF.VHF) and on each cart a passive or active RFID. Passive RFID is cheap, it can be masked as a label, it does not require power as it is activated by the magnetic field induced by the reader. Active RFID, on the other hand, requires a greater investment as it has a battery and is larger than a label. Normally, for cost-effectiveness we rely on an important number of passive RFID carts. The passage of an RFID at a gate determines the detection of the passage. By interpolating the various passages of the carts between the various gates distributed, it is possible to reconstruct the customer’s journey at the point of sale. It is thus possible to obtain the cold and hot areas of a point of sale based on the number of passes for the individual RFID gates.
Recently, with the advent of smartphones in everyday life, it has been possible to evaluate consumer tracking solutions through app interconnected with the WIFI intranet network of the point of sale. In this way it is possible to geolocalize the device and carry out promotional activities in the store. However, the user is required to use the application within the point of sale. A valid alternative to these tracking
Figure 1.4: RFID Cart Tracking
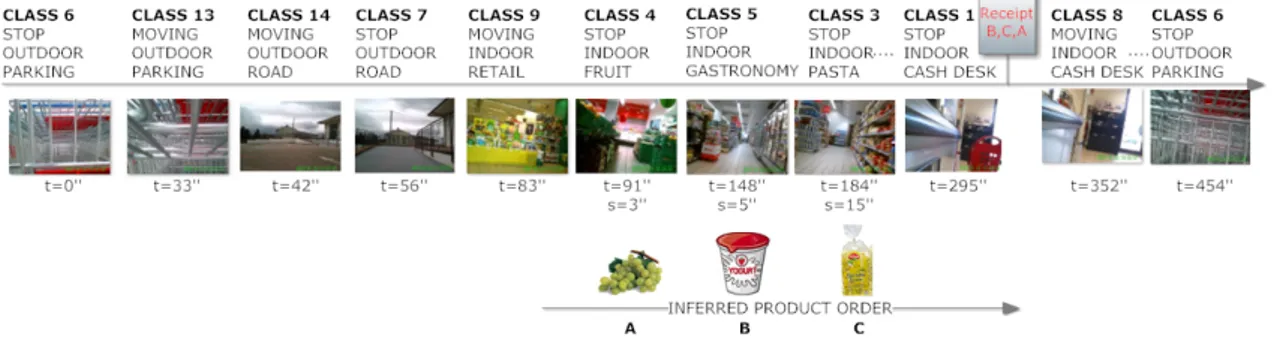
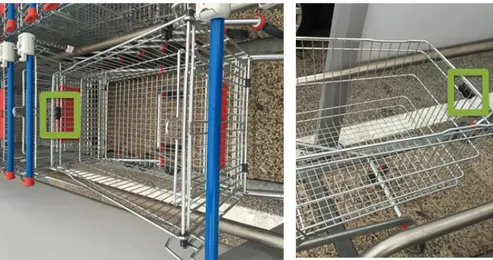
systems is represented by the use of video surveillance systems, usually present at the point of sale, and which can be authorized by the territorial management of the work also for organizational and production improvement purposes. However, the number and positioning of the cameras is constrained on a regulatory basis in order to limit the invasiveness of these continuous-cycle active shooting systems. In addition, it is very difficult to place cameras to map the entire layout, adapting dynamically to the sales point of the store. Hence the opportunity to use self-centered, non-invasive vision systems on board the carts in order to monitor the shopping cart on time to reconstruct consumer behavior. This approach has been defined as Visual Market Basket Analysis, as it allows to carry out a timely monitoring of the shopping cart using the computer vision. This aspect will be dealt with in depth in the third chapter, considering a first traditional approach based on descriptors and machine learning and a second advanced approach based on deep learning. The described system has also been the subject of an invention patent.
An evolution combining also the traditional market basket analysis and consid-ering by viewing also the picking and releasing activities by the users is presented as future development within the final chapter.
Figure 1.5: Egocentric vision on shopping carts
1.2
Papers and Patents
In this section we report the list of papers and patents produced during this PhD.
Conference Papers:
• V. Santarcangelo, G.M. Farinella, S. Battiato, ‘Gender Recognition: Methods, Dataset and Results’, IEEE International Conference on Multimedia Expo Workshops (ICMEW), 2015
Results of this paper are presented in the sections 2.3, 2.4 of this thesis • V. Santarcangelo, G.M. Farinella, S. Battiato, ‘Egocentric Vision for Visual
Market Basket Analysis’,ECCV Workshops, 518-531, 2016
Results of this paper are presented in the section 3.3 of this thesis
• M. I. Tariq, V. Santarcangelo, ‘Analysis of ISO 27001: 2013 Controls Effec-tiveness for Cloud Computing’, ICISSP, 201-208, 2016
The approach about cloud computing cited in this paper is presented in the section 2.9 of this thesis
• M. Giacalone, V. Santarcangelo, ‘Big Data Process Analysis: From Data Min-ing to Process MinMin-ing’, CLADAG, 2017
Analysis dealt in this paper is presented in the section 4.4 of this thesis • V. Santarcangelo, ‘An innovative approach for the GDPR compliance in Big
Data era’, SIS, 2018
• V. Santarcangelo,’Tools for Risk Control of Data Management’, ASA Pescara, 2018
Analysis dealt in this paper is presented in the section 2.12 of this thesis Journal Papers:
• V. Santarcangelo, G.M. Farinella, A. Furnari, S. Battiato, ‘Market Basket Analysis From Egocentric Videos’, Pattern Recognition Letters, Volume 112, Pages 83-90, 2018
Results of this paper are presented in the section 3.6 of this thesis Patents:
• A. Camporesi, V. Santarcangelo, ‘Sistema per la misurazione della variazione dello stato comportamentale di un interlocutore’,17/11/2016, Patent: 0001425894 This patent is described in the section 2.7 of this thesis
• A. Camporesi, A. Meccariello, V. Santarcangelo, ‘Metodo di identificazione avanzata basato sulla visione artificiale in un´area delimitata’,15/02/2017, Patent: 0001427186
This patent is cited in the section 4.3 of this thesis
• A. Camporesi, V. Santarcangelo, ‘Metodo di localizzazione intelligente di oggetti basato sulla computer vision in un’area delimitata’,28/03/2017, Patent: 0001427883 • A. Camporesi, V. Santarcangelo,
‘EMOTIONAL/BEHAVIOURAL/PSYCHO-LOGICAL STATE ESTIMATION SYSTEM ‘, Patent Pending: WO/2017/054871 This patent is described in the section 2.7 of this thesis
• V. Santarcangelo, G. M. Farinella, S. Battiato, A. Camporesi, ‘Advanced Kinesthesis Analysis based on Artificial Vision and Audio Analysis for Pro-cess Control in a Delimited Area’, International Patent, 18 January 2017, PCT/IT2017/000007
This patent is described in the section 3.4 of this thesis Other publications:
• M. Giacalone, C. Cusatelli, V. Santarcangelo, ‘Big Data Compliance for Inno-vative Clinical Models’, Big Data Research 12, 35-40, 2018
• M. Giacalone, C. Cusatelli, A. Romano, A. Buondonno, V. Santarcangelo, ‘Big Data and forensics: An innovative approach for a predictable jurisprudence’, Information Science, 426, 160-170, 2018
Chapter 2
BEHAVIOR ANALYSIS IN
RETAIL CONTEXT
2.1
DOOH and Retail
Digital out of home (DOOH) symbolizes the dynamic media distributed across placed-based networks through digital signage devices as addressable screens, kiosks, jukeboxes and jumbotrons, with the scope of engaging customers and extending the effectiveness of marketing experience [27]. DOOH application is one of the most important topic for retail environment, due to the change of traditional marketing into 1to1 approach, providing a custom shopping experience for the user. DOOH has received considerable interest from retailers and governmental institutions be-cause of the benefits obtained in better managing and respond to the preferences of the users [7]. As a result, Computer Vision covers an important role for providing solutions for this scope [28]. Then, it is very important to exploit computer vision algorithms to automatically collect soft biometrics of people in front a smart screen. It is of great interest for industry [26]. These approaches are based on face detection module [1] and start with gender recognition algorithm. Infact, the input about gender is very important to customize the shopping experience because it is possible to define two defined clusters, one for male and one for female. An other impor-tant approach useful for DOOH is Age Estimation, infact, it is possible to define some clusters for different age targets. Combining gender, age and ethnicity input, emotion detection and skeletal tracking analysis, it is possible to improve DOOH applications. The two most important inputs of DOOH application are Gender and Age, then, in this chapter it is presented a full analysis about these two themes, with
Figure 2.1: Example of DOOH device (jumbotrons)
also an applied benchmark analysis and a patent about a behavioral analysis system.
2.2
Face Detection
To introduce the complexity about computer vision approaches starting from the identification of a face, it is important to evaluate how human beings perceive faces and their importance in social relationships. It is a fact that human beings can recognize the faces of family members from images at extreme resolution. The reason is not clear but it is a clear case of a cognitive process of information minimization. Border analysis is not enough to recognize, and face is processed somehow as a ”whole” and not as composed by parts. In fact, from splitted parts of faces we can obtain new combined faces, that we recognize as other faces. It is very important to underline that eyebrows and impact of skin pigmentation are very important for the identification of faces and that faces can be recognized despite extreme distortions.
Faces seem to be encoded in memory in exaggerated caricature way: average face (averaged from a number of persons), some typical face, face created by taking bid deviation from average. Such faces are recognized even better than typical ones. Newborn babies turn more attention to more face-like objects (upper row) than not face-like. From negative picture it is impossible to identify faces and face recognition is strongly compensated for the direction of illumination. Moreover, studies about response of neural cell of monkey in the face processing area of the
Figure 2.2: Example of extreme distorsion of faces
Figure 2.3: Response of neural cells of human brain
brain show that response to something like face is much more stronger than for hand (millions and millions of cells are processing at the same time). Also in the measurement from human brain it is possible to see that signal from face-like picture is much stronger than from other objects. These considerations shown about faces indicate how sophisticated is information processing in biological systems. What is very amazing is getting correct results despite extreme distortions. For the most part, we do not know how this is done and we have difficulty in thinking how to develop algorithms which would have similar capabilities. The main problems for face detection are the high dimensionality, the heterogeneity of poses, lighting, occlusions, facial expressions (the face is not a rigid object), the presence of beard, glasses, mustache, and make-up.
The main approaches considered to implement the cognitive model of the face can be divided into:
• Knowledge-based (encode human knowledge of what constitutes a typical face by considering relationships between facial features - e.g., The central part of the face has constant luminosity. The difference in intensity between the central part and the upper part is significant; usually presents with two sym-metrical eyes, a nose and a mouth)
• Feature-invariant (based on invariant structural features with several possible factors - e.g., edge, intensity, color and shape)
• Template matching (based on pre-calculated feature patterns with which to inspect an image by region)
• Appareance-based (templates or templates are created starting from a training set representing the variability of the subjects)
For face detection the well-known Viola and Jones approach is usually used (ap-pearance based method).
2.3
Datasets
To properly approaching to Gender and Age recognition themes, in the various in-volved contexts, benchmark face datasets have been introduced. Large datasets are usually required to properly test and measure the performances. Face image datasets can be grouped in two main categories: constrained and unconstrained [25]. Constrained datasets are mainly composed of faces usually used for biometrical ap-plication purpose. A constrained dataset is characterized by images with controlled poses of the acquired subjects and pre-defined scene conditions. Examples of con-strained datasets are AR [34], Lab2 [35], FEI Database [36], FERET [37], PAL [38], MORPH [39], better detailed in the following.
• AR dataset
It is characterized by over 3,000 color images of 116 people (63 men and 53 women) acquired at the Computer Vision Center of the U.A.B. under strictly controlled conditions with respect to the possible variabilities. The images are related to frontal view faces with different facial expressions, illumination conditions, and occlusions (e.g. sun glasses and scarf). This dataset is public
available at the following URI :
http://www2.ece.ohio-state.edu/~aleix/ARdatabase.html. • Lab2 dataset
This dataset is characterized by visible light images and near-infrared images of 50 subjects (12 females and 38 males). For each subject there are 20 visible light face images and the same number of near-infrared face images. Variability is related to facial expression and pose. Moreover images were acquired under four different source point illumination conditions: frontal illumination, left illumination, right illumination, both left and right illumination. The dataset can be found at the following URI:
http://www.yongxu.org/databases.html. • FEI face database
It is a Brazilian face database that contains 2800 images (14 images for each of the 200 individuals, 100 males and 100 females) which have been acquired with homogeneous background. The acquired images are characterized of profile rotation up to about 180 degrees. The dataset can be obtained at http: //fei.edu.br/~cet/facedatabase.html.
• FERET database
FERET contains 14051 grayscale images of human faces with different views (frontal, left and right profiles). It represents one of the most known and used dataset for face recognition purposes. Information on how to obtain the dataset are available at the following website : http://www.itl.nist.gov/ iad/humanid/feret/feret_master.html.
• PAL dataset
The PAL DB is characterized by 575 face images of adults ranging from 19 to 93 years of age (225 males and 350 female). The official website of this dataset is https://pal.utdallas.edu/facedb/.
Despite constrained dataset are frequently used in literature, in real application domain (such as DOOH) the images to be analyzed are taken in unconstrained settings. A lot of state of art approaches reach really good performances on
constrained datasets but could not have the same accuracy on image acquired on real life. So, in the recent years unconstrained datasets have been intro-duced. Unconstrained datasets are built considering images acquired by real life, with different poses and scene conditions. These datasets are principally built collecting images from public repository (e.g., Flickr) with the use of web image crawlers. The unconstrained face datasets currently used in literature are LFW [39] , Gallagher [48], Genki-4K [49] , Image of Groups [50], Kin-Face [51]. Gallagher and Image of Groups are unconstrained image of groups datasets, and are the most difficult one where testing these approaches. The development of dataset more and more useful for these application is a target to consider in the today research.
• Labeled Faces in the Wild (LFW)
It can be considered the most important unconstrained face dataset up today. It contains more than 13000 images of faces collected from the web (10256 male and 2977 female images). Each face has been labeled with the name of the person pictured. 1680 of the people pictured have two or more distinct photos in the dataset. The official link to obtain the LFW dataset is http: //vis-www.cs.umass.edu/lfw/.
• Gallagher dataset
It is a collection of 931 real life digital images of people. The dataset can be downloaded from the author’s website: http://chenlab.ece.cornell.edu/ people/Andy/GallagherDataset.html.
• GENKI-4K dataset
It contains over 3,000 color face images labeled as either “smiling” or “non-smiling” by human coders (1539 females and 1,506 males extracted by Danis-man et al [40].). The images contains faces spanning a wide range of illu-mination conditions, geographical locations, personal identity, and ethnic-ity. GENKI-4K can be downloaded at the link http://mplab.ucsd.edu/ wordpress/?page_id=398 .
• Image of Groups
28,231 faces labeled with age and gender. This is a useful dataset for the studies of groups of people in unconstrained settings. It can be downloaded at http://chenlab.ece.cornell.edu/people/Andy/ImagesOfGroups.html. • UB KinFace
It comprises 600 images related to 400 people (most of them are real-world collections of public figures as celebrities and politicians from Internet). It can be organized into 200 groups (child, young parent and old parent images). The dataset is available online at : http://www1.ece.neu.edu/~yunfu/research/ Kinface/Kinface.htm.
• CASIA WebFace dataset
The dataset [91] contains photos of actors and actresses born between 1940 and 2014 from the IMDb website. Images of the CASIA WebFace dataset include random variations of poses, illuminations, facial expressions and image resolu-tions. In total, there are 494,414 face images of 10,575 subjects. The dataset is available online at : http://classif.ai/dataset/casia-webface/.
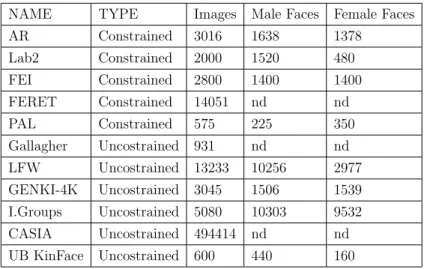
Following table summarizes the main characteristics of the datasets and, when-ever it is available, the number of male/female subjects.
Table 2.1: Face Datasets for Gender Recognition
NAME TYPE Images Male Faces Female Faces
AR Constrained 3016 1638 1378 Lab2 Constrained 2000 1520 480 FEI Constrained 2800 1400 1400 FERET Constrained 14051 nd nd PAL Constrained 575 225 350 Gallagher Uncostrained 931 nd nd LFW Uncostrained 13233 10256 2977 GENKI-4K Uncostrained 3045 1506 1539 I.Groups Uncostrained 5080 10303 9532 CASIA Uncostrained 494414 nd nd UB KinFace Uncostrained 600 440 160
Figure 2.4: GENERAL PIPELINE OF A GENDER RECOGNIZER
2.4
Gender Recognition
Gender recognition approaches share a pipeline composed by three main modules (see Fig.2): face detection, face representation and gender classification. In this section we detail the components of a gender recognition method by considering the current state-of-the-art.
2.4.1
Face Detection
As first stage of a gender recognition engine, the faces of the people present into the acquired images have to be detected. To this purpose the well-known Viola and Jones object detection framework is usually used [33]. It is able of processing images in real time achieving high detection rates. The solution exploits the Integral Image representation so that Haar-like features can be computed at any scale or location in constant time. A learning algorithm based on AdaBoost [46] is used to select the most discriminative features bases for classification purposes. Combining different classifiers in a cascade the background regions of the image are discarded while faces are detected.
2.4.2
Face Representation
When faces are detected a discriminative representation have to be computed. Usu-ally a pre-processing step to remote geometric variabilities (e.g., by aligning faces with respect to the eyes positions) as well as photometric variabilities (e.g., light conditions) is perfomed [1]. The obtained images are hence processed to extract features to be sual into the gender classification module. Different features methods have been used for gender recognition. Almost all approaches for gender recognition are based on LBP, HOG, SIFT features. These features can be combined also with
Color Histograms (CH) and Gabor features to improve the performances. It is use-ful to synthesize these approaches to better understand their application on gender recognition.
• LBP descriptor
It considers spatial comparison of local neighborhood of a pixel and creates labels which are then aggregated in histograms. LBP descriptors (and the related variants) are robust to illumination and to the rotation variations. LBP are useful to capture textures (e.g., beard).
• SIFT descriptor
The SIFT descriptor is invariant to scale, translation, rotation, partially in-variant to illumination changes and robust to local geometric distortion. • HOG method
It considers the image divided into a block structure cell-based. The block is characterized by the histogram of oriented gradients as a function of the edges. Histograms are subjected to normalization of contrast.
LBP, SIFT and HOG approaches have been also combined with the CH and Gabor features for gender recognition [20] [23]. The histogram of the colors (CH) extracts the characteristics on the distribution of the ”colors” of the image, instead, Gabor filters are used to encode texture. Moreover, recent approaches uses CNN features (Convolutional Neural Network) reaching good results [44]. Once the features are extracted and the image is represented, a classifier is applied.
2.4.3
Gender Classification
The most used methods for gender classification are SVM (with RBF Kernel) and Adaboost combined with Linear SVM. A Support vector machine (SVM) [41] is a powerful classifier for two classes based problems: gender recognition problem (male vs female) is a good application scenario. The Adaptative boosting approach (Ad-aboost) [42] is an ensemble learning based method able to build a strong classifier from a combination of weak classifiers. In CNN (Convolutional Neural Network)
approaches it is possible to find also Softmax classifier. Softmax is a generalization of a Logistic Regression classifier to multiple classes, that yields the actual proba-bility scores for each class label.
2.4.4
State of the Art Results
In this paragraph we review the results obtained by the current state of the art approaches. For each approach we briefly describe the main ingredients used to build the gender recognizer, which dataset have been used in the experimental phase and well and the obtained results. The comparison among the different approaches is obtained by considering the results claimed by the authors in their papers. In this way approaches which used the same dataset in the experiments are straightforward compared. The comparison is reported in Table 2.
• Danisman et al. [40]
This approach shows as the use of a pre-processing step can improve the per-formances of gender recognition on unconstrained datasets. The method pro-posed by the authors is compro-posed by face detector, a face alignment step to remove geometric variability, and a histogram equalization in which the face images are normalized with respect to a specific probability density function obtained considering the average face of the training dataset to remove illumi-nation variability. Classification is obtained exploiting the SVM classifier with RBF kernel. This method has been tested on unconstrained datasets. The ac-curacy obtained on the LFW, Genki-4k and Groups datasets are respectively 91.87%, 91.07%, 88.16%.
• Ersi et al. [20]
The gender classification approach is based on the combination of LBP, SIFT and CH descriptors. Classification is obtained by exploiting a SVM with RBF kernel. The accuracy obtained on the Gallagher database (unconstrained im-ages from the web) is 91.6%.
• Liu et al. in [21]
which captures pairwise statistics of localized histogram of gradient distri-butions. For classification purpose both Adaboost and SVM are compared indipendendly or in cascade (boosting for feature selection and SVM for classi-fication). The performances reached on LFW face dataset by considering only the GSS descriptor are 88.96%, whereas the combination of HOG31, LBP and GSS features achieved an accuracy of 95.76%.
• Borgi et al. in [22]
This work proposes a new approach for gender classification called multi-regularized learning (MRL). It considers as first step a dimensional reduction of the faces feature space. Then the proposed multi-regularization feature learning approach is applied for classification purpose. The method obtained 92.83% of accuracy on the AR dataset, whereas an accuracy of 94% is reached on the FEI dataset.
Table 2.2: Performances [40] [20] [21] [22] [23] [43] [44] [45] [93] [44] [94] Groups 88.16 91.34 90.14 Genki-4K 91.07 LFW 91.87 95.80 98.00 96.86 97.31 98.90 98.00 Gallagher 91.60 88.60 AR 92.83 FEI 94.00 FERET 98.78 KinFace 96.50 Feret+Morph 89.70 • Ren et al. in [23]
This work considers a combination of the SIFT, HOG and Gabor filters as final descriptor for gender recognition. The classification is obtained through RealAdaboost with the use of a penalty term that considers the complexity of the feature combination. The combinations of the feature spaces with the penalty term reduces the computational complexity. The approach has been tested on both constrained and unconstrained datasets obtaining the following results: 98.78% on FERET, 96.50% on KINFACE, 98.01% on LFW.
• Eidinger et al. [43]
The authors presented a pipeline based on with four steps: detection, align-ment, representation and classification. The detection is obtained by the use of Viola and Jones face detector, the alignment method is done considering the position of 68 specific facial features, the final classification is obtained by the use of a Dropout-SVM on LBP and FPLBP representation. The results of the method on Gallagher Dataset is of 88.6%.
• Jia et al. [44]
This contribution address the important challeng of training the gender clas-sifier by considering a big dataset represented in a high dimensional feature space (four million images and 60 thousand features). The proposed approach use an ensemble of linear classifiers, and achieves an accuracy of 96.86% on the most challenging public database, Labelled Faces in the Wild (LFW). • Carcagni et al. [45]
The paper presents a comparison among LBP, HOG and SWLD (Spatial Weber Local Descriptor) descriptors for gender recognition on constrained dataset. Specifically, the authors have used a fusion of FERET and MORPH datasets for testing purposes. The best accuracy is obtained by using HOG descriptors coupled with SVM and exploiting RBF Kernel (89,70%).
• Jia et al. [92]
This work presents an interesting comparison between CNNs with approaches with other types of vision features from different facial regions, introducing a novel approach. Specifically, the authors have used CNN features with Soft-max classifier on the Labeled Faces in the Wild (LFW) dataset achieving an accuracy of 98.90%, and on the Images of Groups (GROUPS) dataset, achiev-ing an accuracy of 91.34% for cross-database gender classification.
• Antipova et al. [93]
In this paper authors presents an approach of gender recognition based on CNN features with Softmax classifier. The accuracy obtained on the Labeled Faces in the Wild (LFW) dataset is 97,31%.
• Santana et al. [94]
This approach considers a combination of LBP, HOG and CNN features for gender recognition. They used SVM as classifier and achieved the highest accuracy on the LFW and GROUPS in a cross-database setting, 98% and 90.14% respectively.
To complete the analysis, it is important to consider also the impact of the im-age resolution regarding the performances obtained by a gender classifier. Andreu et al. [47] performed tests on different dataset (FERET, PAL, AR) considering them at different resolution. The study shows that a size between 22x18 and 90x72 pixels is recommended for the problem of gender recognition. The authors pointed out that a size of 45x36 pixels provides enough information to infer the gender recognition from images.
The results reported above show that the best performances are obtained on con-strained datasets (98.78%) [23]. Considering unconcon-strained datasets, the feature descriptors better performing are CNN [92] (98.80%) and the combination of HOG, SIFT and Gabor descriptors [23] (98.01%). It is important to notice that some datasets (e.g., the one with images of groups) are more complex than others in gender recognition, due to the fact of the presence of groups of people, children, different ethnic groups and a large age gap.
2.5
Age Estimation
Although humans are able to perform age estimation from human face images with a certain accuracy, it is a pretty complex task to be performed automatically. Ini-tially, the first approaches of automatic age estimation were based on anthropometric models (e.g. craniofacial growth, skin aging, facial lines and wrinkle estimator). An evolution was represented by Active Appearance Model (AAM) considering both shape and texture [32]. The evolution of these approach has been similar to Gender recognition, then Age estimation is based on a pipeline composed by three main modules: face detection, face representation, gender classification. Almost all ap-proaches for age estimation are based on LBP, HOG, SIFT and CLBP (Completed Local Binary Pattern) features with the combination of Gabor Filter. Methods for the classification are mainly SVM classifier with RBF Kernel. In Age Estimation
approaches, datasets are divided mainly in 5 Age Groups : 16-24, 25-39, 40-59 and 60+. However, the presence in the dataset of a little number of pictures for the class 60+ make system not very robust for detection of seniors. The results of the state of the art show that the best performances on constrained dataset are obtained considering CLBP approach (73%) and as expected, considering the confusion ma-trix for the age classes, most of the confusion occurs between adjacent classes [1]. Combining LBP+SIFT+HOG [20] it is possible to reach 63% of accuracy in uncon-strained image of groups datasets, that represent an example of application in the real context. CNN approaches [95] reach lower results (59.90%).
2.6
Research Proposal
Research proposal for DOOH is about the analysis of digital signage applications and the study of methods about gender, age, ethnicity, emotion, clothing attributes and skeletal/gesture recognition [29] to develop a system for the behavioral state analysis of a buyer. The behavior analysis of a buyer can be defined analyzing the 4 possible “response modes” defined by Miller Heiman in “The New Strategic Selling” [28] approach that are: Growth, Trouble, Even Keel, Overconfident. These Concepts, specifically developed for B2B Buyer-Vendor transaction cases suggest that: Buyers in Growth mode perceive that by buying a product or service, they will produce growth for their company (opened to vendor offerings). In Trouble mode, buyers perceive that they have to fill rapidly a business gap (e.g. it is losing customers, losing money, decreasing productivity) and understand that something must change (opened to vendor offerings). Buyers in Even Keel mode do not perceive a large enough gap between their position and their goal, then there is no urgency to change anything (closed to vendor offerings). Buyers in Overconfident mode believe that they are doing so well that the suggestion that your offering might improve their situation is practically an insult (closed to vendor offerings). In fact they have a weak grasp of the reality and their mind is then closed to suggestions before to the natural fall to the trouble mode. These concepts have been developed, applied and conceptually adapted, also to the B2C case and specifically utilized to tailor properly the Communication to each specific Customer Response Mode detected or targeted, considering the related variability as a function of the situation and
information perceived by the individuals. The core of this research in DOOH is to project and develop a system for the “response mode” recognition, through a combination of inputs as that of Gender, Age, Ethnicity, Emotion and Skeletal’s systems combined to feedback from device interaction (e.g. text input, page choice, opinion mining, social network interaction, pir sensor feedbacks) thanks also to the use of semantic networks. This research field requires to consider also psychological aspects, as the Color Psychology Analysis [30] and Neuro-linguistic programming (NLP) analysis [31]. Neuro-linguistic programming (NLP) is an approach developed by Richard Bandler and John Grinder (in the 1970s) to communication, personal development, and psychotherapy. NLP teaches the ability to calibrate or ’read’ people (sensory awareness). It means the ability to interpret changes in muscle tone, skin colour and shininess, lower lip size and breathing rate and location. From these and other indications it is possible to determine what effect these changes can have on other people. This information serves as feedback as to whether the other person is or not in a specific, desired state of study or interaction. An important and often overlooked point is to know the singling out moment when the other person is in the state that you desire to detect. The development of this system is a multidisciplinary topic (computer vision, artificial intelligence, psychology and marketing) and it can improve current applications, providing new DOOH systems thanks to the use of an approach of complete ‘reading’ of people mind. The whole analysis could be validated further via a correlation between a set of actual behaviors and responses, determined in experimental and properly authorized sites, to achieve scientific levels of results acceptance, eventually differentiating the readings by considering specific applications.
2.7
Behavioral Analysis System
To develop this approach, a patent about a system for measuring the variation of the behavioral state of an interlocutor has been written and granted by Centro Studi. Now it is reported the description of the invention. The recognition of emotions through computer vision applied to the face of an interlocutor is one of the main areas of current research, however, the result of this analysis risks being in itself not
very reliable as it is mainly linked to the characteristics of a person’s face in a deter-mined moment, without considering environmental boundary factors and the body language in toto (NLP). According to what is known, both in the culture of NLP (neuro-linguistic programming) and sales strategies there are response modalities (”response modes”) or behavioral states. In the literature, the ”response modes” presented by Robert B. Miller in the text ”The NEW Strategic Selling” [52] are:
- Growth (Development): in which the interlocutor ”is always ready to say YES” to get something better that introduces a ”discrepancy” to fill with a consequent high probability of sales / interaction success;
- Trouble (Crisis): in which there is a ”defeat” to be solved immediately, with a consequent high probability of sales / interaction success;
- Even Keel (Satisfied): in which there is no ”discrepancy” to fill, resulting in a low probability of sales / interaction success;
- Overconfident (Too Optimistic): in which the user is convinced that he has more than what he actually has, with the consequent probability of a successful sale / interaction.
Knowing how to determine the ”behavioral state” of an interlocutor in a given moment, and being able to measure the variation of the behavioral state over time, is a fundamental tool to better direct communication in any field and to predict the relative probability of success of the interaction. In particular, the patent finds application in any scenario in which there is interaction with the user and the need to obtain feedback on his behavioral state. In order to implement this system it is necessary to consider the potential of neuro-linguistic programming, which al-lows to model the behavior of people in order to obtain useful input in communi-cation. In this context, the technical task underlying the present invention is to propose a system for determining the behavioral state and measuring its variation over time. Moreover, the present invention extends Miller’s ”response modes” by introducing two possible combinations for each ”mode”, RATIONAL (with a precise perception by the interlocutor), NOT RATIONAL (with the absence of a precise perception by the ’party). Consequently, the 4 ”modes” CRISIS (C), DEVELOP-MENT (S), TOO OPTIMIST (TO), APPROVED (A) specialize through the two RATIONAL (1) and NON RATIONAL (0) states in 8 ”modes”: RATIONAL CRI-SIS (C1), NON-RATIONAL CRICRI-SIS (C0), RATIONAL DEVELOPMENT (S1),
NON-RATIONAL DEVELOPMENT (S0), TOO VERY RATIONAL OPTIMISM (TO1), TOO MANY NON-RATIONAL OPTIMIST (TO0), RATIONAL APPA-RATUS (A1), NON-RATIONAL APPROVED (A0).
In particular, it is an object of the present invention to provide an automatic system characterized by a camera 11, a camera with sensors for the ”skeletal / gesture recognition” 12, color sensor 13, microphone 14, proximity sensor ( PIR or ultrasonic) 15, pressure sensor for floor 16, possible sensor magnetometer SQUID 17, input device (keyboard, touchscreen monitor, joystick, mouse) 18, output de-vice (display, monitor) 19, and from information from social networks, loyalty loops, speaker barriers, user flow monitoring systems (e.g. systems with RFID technol-ogy) 21, indoor environmental information (brightness, humidity, temperature) 7 and outdoor (weather) 22. The specified technical task and the specified purpose are substantially achieved by a system for measuring the variation of the behavioral state of an interlocutor comprising the technical characteristics exhibited in one or more of the appended claims. Further characteristics and advantages of the present invention will become clearer from the indicative, and therefore not limiting, de-scription of a preferred but not exclusive embodiment of a system for measuring the variation of the behavioral state of an interlocutor, as illustrated in the accompany-ing figure 2.5, which is a schematic representation of a system in accordance with the present invention. The system for measuring the variation of the behavioral state of an interlocutor in accordance with the present invention is applicable in any case within a closed or closed delimited area. As an example, this delimited area can be that of a shopping center, a local council, a service station, any DOOH scenario (digital out of home). In fact, the system lends itself, for example, to be integrated into interactive multimedia totems or gaming devices (such as slot machines). The system provides, initially, to associate with the genus sizes 23, age 24, facial expres-sion 25, position of the ocular pupils 26 (extracted from the face test 1), shape of body 2, detected colors 3, tone of heading 27, type of breath 28 (extracted from the acquired audio signal 4), distance 5, position of the feet 29, speed of interaction with the input devices 6 detected in the area delimited ”A” a corresponding value. In a database 10, the measured values are saved. This information is accompanied by any choices made using input devices 30, information extracted from social networks (using opinion mining algorithms), loyalty circuits, user flow monitoring systems or
cash barriers 21, from weather information 22 and indoor environmental conditions 7 (including any information on the level of ELF waves obtaind magnetometers). The group of sensors 8 is mounted on board an embedded device or a personal computer 9 equipped with a tcp / ip network interface. The values obtained are then interpreted according to the reference values present in the database 10, which represent the basis of knowledge for interpreting the recorded data. This knowledge base contains the scheme of interpretation of NLP, logic related to the psychology of colors, logics for the joint interpretation of data (semantic tree structures) and mathematical models for self-learning and not. For processing unit 20 we can mean a common computer or a server containing the database 10. The communication of the data collected to the unit 9 occurs via the tcp / ip network protocol. Advan-tageously, the device 9 can also be a remote server. Alternatively, the embedded device 9 can be queried via a tcp / ip (wifi / ethernet) network interface to obtain a real-time feedback via a web interface html based on a standard logic of real-time data interpretation. This device 9 can therefore be queried by devices such as PCs, notebooks, PDAs, smartphones, tablets with web browsers and tcp / ip connectiv-ity. The device 9 can in turn be integrated into the central unit of an interactive totem. In addition to monitoring the measured values in real-time, it is therefore possible to check their time evolution. The system returns with respect to a time frame established by the user the variation of the behavioral state, measured in the various time instants by means of the algorithm referred to below. Considered ”N1” the first number describing the synthesis value obtained from the information (gen-der, age, facial expression, position of the pupils, colors) obtained by means of the acquisition with camera and color sensor, ”N2” the synthesis value obtained from the information of the sensor camera to the skeleton recognition (template), ”N3” the synthesis value obtained from the voice / breath information, ”N4” the synthe-sis value obtained from the interaction detected by input devices, ”N5” the value of synthesis obtained from the distance of the interlocutor, ”N6” the synthesis value obtained from the additional information (social networks, loyalty circuits), ”N7” the synthesis value obtained from the historical information, ”N8” the synthesis value obtained from the information relating to the indoor and outdoor environ-ment, ”N9” the synthesis value obtained from the additional additional information
obtained from the sensors (e.g. electric fields) at a determined moment ”t0” of de-tection the numerical value that describes the behavioral state ”I (t0)” is a number obtained after a normalization of the data, which include values of importance of the individual components, ie: V1 = 1 - (N1 / N1max); V2 = 1 - (N2 / N2max); V3 = 1 - (N3 / N3max) ... Vn = 1 - (Nn / Nnmax) with N1max, N2max, N3max, ... Nnmax established on the basis of theoretical knowledge. Defined 1, 2, 3 ... n (weights of importance of the single components, 0 i 1) the value that identifies a behavioral state ”IC” for n = 3 is established by the formula:
IC = ((γ1) × V 1 + (γ2) × V 2 + (γ3) × V 3)) (γ1)2+ (γ2)2 + (γ3)2
This value in relation to a numerical reference threshold value (depending on the knowledge base and mathematical models) determines its behavioral state. In addition to giving feedback on the behavioral state, the system 2.6 is able to suggest a type of action to be taken with the interlocutor and the relative probability of success.
2.8
Benchmark Analysis
In order to understand how the major world players are dealing with this issue, the Google Cloud library and an embedded device provided by Centro Studi have been taken into consideration. Although the costs are accessible and the high-performance system, the risk of using Google Cloud services is linked to a possible violation of the GDPR, as Google Cloud acts as the controller, transferring the entire management responsibility to the customer (Data Controller). In tests carried out in retail contexts, also thanks to the help of semantics, the Google library does not perform correctly on individual products. In context analysis, on the other hand, it is more reliable. Excellent performances have been found thanks to the use of the OCR module. Regarding the recognition of the face and emotions, the system is particularly efficient.
Figure 2.5: Blocks scheme of patented system (A environment, processing unit 20, server 9)
2.9
Google Cloud Platform
To introduce the Google Cloud approach, it is important to introduce the com-parison about Cloud approaches [97]. In fact, we have to consider the differences between Paas, Saas and Iaas cloud services. Software as a Service, also known as cloud application services, represent the most commonly utilized option for busi-nesses in the cloud market. SaaS utilizes the internet to deliver applications to its users, which are managed by a third-party vendor. A majority of SaaS applications are run directly through the web browser, and do not require any downloads or
Figure 2.6: Detailed scheme of patented system (inputs read, IC behavioral state, system outputs)
installations on the client side. Platform as a Services (PaaS) provide cloud compo-nents to certain software while being used mainly for applications. PaaS provides
a framework for developers that they can build upon and use to create customized applications. All servers, storage, and networking can be managed by the enter-prise or a third-party provider while the developers can maintain management of the applications. Infrastructure as a Services (IaaS) are made of highly scalable and automated compute resources. IaaS is fully self-service for accessing and monitoring things like compute, networking, storage, and other services, and it allows businesses to purchase resources on-demand and as-needed instead of having to buy hardware outright. Google, along with Microsoft, was one of the first big companies to offer PaaS services for the consumer market. An example of PaaS service is Google Cloud Platform.
2.9.1
Google Cloud Platform: Image Analysis
Google Cloud Vision API allows developers to understand the content of an image by encapsulating powerful machine learning models in an easy to use REST API. It is possible to classify images into thousands of categories (e.g., ”sailboat”, ”lion”, ”Eiffel Tower”) [96], detect individual objects and faces within the images, and find and read printed words within the images by OCR. It is possible to generate metadata for an image catalog, moderate offensive content, or enable new marketing scenarios through image sentiment analysis. With this platform it is very easy to detect broad sets of objects in images, from flowers, animals, or transportation to thousands of other object categories commonly found within images. Vision API enables also to detect different types of inappropriate content such as violent content. Vision API uses the power of Google Image Search to match results with celebrities, logos, or news events. It considers Visually Similar Search to find similar images on the web. Optical Character Recognition (OCR) enables to detect text within images, along with automatic language identification. Then, with this platform it is possible to detect sets of categories within an image, ranging from modes of transportation to animals. Label detection is definitely the most interesting annotation: this feature adds semantics to any image or video stream by providing a set of relevant labels (i.e. keywords) for each uploaded image. Labels are selected among thousands of object categories and mapped to the official Google Knowledge Graph. This allows image classification and enhanced semantic analysis, understanding, and reasoning. Technically, the actual detection is performed on the image as a whole, although
Figure 2.7: Label Detection of an olive oil bottle
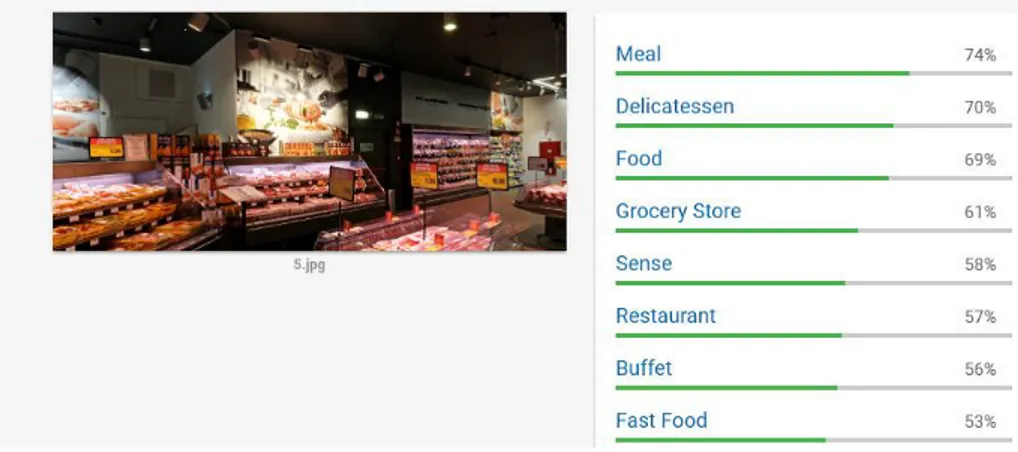
Figure 2.8: Label Detection of a meat department
an object extraction phase may be executed in advance on the client in order to extract a set of labels for each single object. In this case, each object should be uploaded as an independent image. However, this may lead to lower-quality results if the resolution is not high enough, or if the object context is more relevant than the object itself — for the application’s purpose. In the following images, we have provided some examples about label detection. Testing this platform on an olive oil bottle, it is possible to notice some misclassification: liqueur/drink/juice are provided as best results, confirming the very difficult topic of the product retail classification. Good results are provided in the analysis of retail scenes (meat and vegetable department).
We have also tested an interesting feature of this platform concerning the detec-tion of popular product logos within an image. In fact, it is possible to see in the following image how the logo has been detected.
Figure 2.9: Label Detection of vegetable department
Figure 2.10: Logo detection in a supermarket
Figure 2.11: OCR of an Olive Oil Bottle
The Vision API, in fact, runs OCR - similar to the model which is used in Google Translate - to extract the following text from the image. In addition to a bounding box for the entire text, the platform also get a bounding box for the position of each word in the image, to analyze it further or translate it.
Figure 2.12: OCR of a meat department
2.9.2
Google Cloud Face and Emotion Detection
The platform is very useful also to detect multiple faces within an image, along with the associated key facial attributes like emotional state or wearing headwear. Face detection aims at localizing human faces inside an image. It’s a well-known problem that can be categorized as a special case of a general object-class detection problem. It is important to define that:
• It is NOT the same as Face Recognition, although the detection/localization task can be thought of as one of the first steps in the process of recognizing someone’s face. This typically involves many more techniques, such as facial landmarks extraction, 3D analysis, skin texture analysis, and others;
• It usually targets human faces only.
If you ask the Google Vision API to annotate your images with the FACEDETEC-TION feature, you will obtain the following:
• The face position (i.e. bounding boxes);
• The landmarks positions (i.e. eyes, eyebrows, pupils, nose, mouth, lips, ears, chin, etc.), which include more than 30 points;
• The main face orientation (i.e. roll, pan, and tilt angles);
• Emotional likelihoods (i.e. joy, sorrow, anger, surprise, etc), plus some additional information (under exposition likelihood, blur likelihood, headwear likelihood, etc.).
Figure 2.13: Face Detection Test
Figure 2.14: Face 1 results
We have carried on our study giving some examples about face detection in an image concerning a couple. The algorithm detects the two faces and for each face the relative emotions, with a score from 1 to 5 and a confidence factor. Comparing OpenCV with Google Cloud Vision [98] on the Cohn-Kanade AU-Coded Facial Expression Database with Fisherface technique, the OpenCV implementation got the best performance.
Figure 2.15: Face 2 results
Furthermore, the platform detects also general attributes of the image, such as dominant colors and appropriate crop hints.
Figure 2.16: Attribute Face Detection Test
It is very important to underline that behind the development of Google Cloud Vision there is Fei-Fei Li, director of the Stanford Artificial Intelligence Lab (SAIL) and the Stanford Vision Lab. Among her best-known work is the ImageNet project, which has revolutionized the field of large-scale visual recognition. Fei-Fei is the recipient of the 2014 IBM Faculty Fellow Award and the 2012 Yahoo Labs FREP Award.
2.10
Embedded Device Tests
A further benchmark analysis was provided by the use of an embedded device pro-vided by Centro Studi S.r.l. This device is equipped with processing unit (based on deep learning model) and acquisition unit and can be interfaced via USB port. Un-fortunately, for reasons of intellectual property Cento Studi S.r.l. has not provided any further technical specifications.
Figure 2.18: Device used during tests.
The device can be used for the identification of the human body (skeletal anal-ysis), tracking of the hand, identification of the face and its recognition (from the previously loaded tranining database). In particular, it makes the following useful processing for a behavioral analysis:
• FACE DIRECTION ANALYSIS; • DETERMINATION OF THE AGE; • SANCTIFICATION OF SEX;