II
Acknowledgment
Firstly, I would like to express my sincere gratitude to my advisor Prof. Bartolomeo Schirone for the continuous support of my Ph.D study and related research. His guidance helped me in all the time of research and writing of this thesis.
Besides my advisor, I would like to thank the rest of my thesis committee: Prof.Maurizio Badiani, Prof. Massimo Trabalza Marinucci .
My sincere thanks also goes to Dr. Corrado Battisti, for his Great support and efforts in this research through his motivation, and immense knowledge that enrich my thesis Also my thanks goes to Dr . Fabio Recanatesi for his Ideas in this research and for his support for this study with GIS program techniques especially patch analysis idea that it would not be possible to conduct this research withoutthis part .
I would like to thank the Europian union for the support of such kind of projects in my country which give me this opportunity to continue my study and get this Degree , great thanks goes to professora. Charlotte vallino for her Wisdom and her support for this projec .Thiswork was funded by the DEBPAL2 Project “Reinforcing CapacityBuilding for Defending Biodiversity in the Palestinian Territo-ries”, which is financed by the European Commission-DG Researchand Innovation, through the 7th Framework Programme (GrantAgreement no. 294936).
I will never forget my University in Palestine ( ALQuds University ) where I spent my great years in getting my previous degrees , especially my professor Dr. Mutaz Qutob who believe in my abilities and give me this opportunity for Dr. Abd ALKarim ALshareef ,Dr. Khalid Salem and Dr. Jehad Abbadi for Their support to this project and their help during the field works in the selected sites of this project .
Sincere thanks goes to my current University ( Tuscia University ) where I spent Different three years from my life to get this degree , for My Department Agriculture and Forest , Nature & Energy ( DAFNE )
for our Laboratory teams represented with Dr. Avra schirone for her great emotion with me like amother her in Italy during the study period .
III My thanks continues to Dr. Federico vessilla for his correction also of this thesis and his support during those three years .
For Michela Celestine for her support and her effort for the study of herbarium techniques and her field trips support .
Thanks also continue to Dr. Marco simone for his support and friendly encouragement Thanks continue to the two anonymous reviewers and the Editor providing fur-ther useful comments and suggestions that largely improved a firstdraft of the manuscript for our published Work (Threat analysis for a network of sites in West Bank (Palestine): Anexpert-based evaluation supported by grey literature and localknowledge ) .
I would like to thank the Palestinian Ministry of Agriculture for their support in this research with important Information and Maps
Also thanks goes to the Palesitinan Environmental Quality and Applied research center (ARIJ) for their support with important information used in this study .
My sincere thanks from the deap of heart goes to my father and all my family without them I will never get this opportunity
Final thanks with agreat love goes to my friends Marcella ballderi, Lamia Amoura , Echrak Aissa , Sabina Y eva , for their special continuos support until this moments , and all my friends without them I will never get this strong ability to continue …….. Thanks ………..
IV
Dedication
This research is dedicated
………..To my country
……..My family
….My friends
Iman AL-Hirsh
6-6-2016
Viterbo – Italy
1
Table of Contents
Chapter one : Introduction1.1 Forest in the WestBank ... 12
1.2 Palestinian forest types according to the Quézel classification ... 17
1.3 forestation program history in the West Bank ... 22
1.4 Forest and range resources in Palestine ... 25
1.5 Forests Functions ... 26
1.6 Facts about Forest Changes in the West Bank between 1970-2007 ... 29
Chapter two: Habitat Fragmentation 2.1 : Habitat fragmentation and ecological corridor for conservation ... 36
2.2 : Main Biodiversity indicators for sustainable development in the OPT ... 38
2.3: Palestine habitat situation ... .46
2.4 Effectiveness of corridors ... 57
2.5 Corridor Design Guidelines ... 59
2.6 Aims ... 63
2.7 Hypothesis from this study ... .64
2.8 Work Flow ... . .66
Chapter three : Material and Methodology 3.1 : Study Area ... 67
3.2 Descriptive taxonomy of direct threats... ... .76
3.3 Measurement of direct threats... ... ..76
3.4 Significance analysis... ... .77
3.5 Knowledge analysis... ... ..78
3.6 Statistical analysis ... ...79
3.7 Quantifying landscape ... ... ...80
3.8 Cultivation possibility for Plant target Species in Sulfit , Hebron , Jenin , Jericho.. ... ... 82
Chapter 4 Results & Discussion 4.1 : Results for Threat analysis approach ... ... .85
4.2 : Significance analysis... ... ...85
4.3 : Knowledge analysis... ... ...86
4.4 : Comparison between magnitude and knowledge... ... ...87
4.5 Results for the Quantifying landscape metrics in ( Sulfit , Jenin ,Hebron , Jericho ) ... 96
4.6 Sulfit Patch Analysis Results ... ... .96
4.7 Jenin land use Patch analysis results ... ... ..105
4.8 Hebron Landuse Patch analysis results ... ... ...113
4.9 Jericho landuse patch analysis ... ... .120
4.10 Landscape level metric value for Hebron , Jenin , Jericho and Sulfit ... ... .128
4.1 Third step in the work : Planning for reducing the fragmentation by achieving connection between fragmented habitat by introduce ecological corridor ... ... ..132
4.12 Target species of plant ecological corridor planning ... ... ...132
4.13 Importance of the target Species in traditional food ... ... 132
4.14 Geographical Distribution of the Target 5 species in Palestine ... ... .138
2
Chapter Five : analysis for the necessity of ecological corridor( Case study Ramat Hanadiv )...154
Conclusion ... 167
Recommendation ... 168
3
List of figures
Figure 1.1 Type of Palestine vegetation cover during the period 1800 and 2011 A and B
respectively ... 15
Figure 1.2 Palestine Geographical and Agro-ecological zones ……… ... ..17
Figure 1.3 forest types in The WestBank ……… ... .22
Figure 1.4. Abu Ghnaim Mountain Forests situation in 1997 and 2003. ... 23
Figure 1.4. Forest, natural reserves and pastures Area in West Bank Districts……… ... 26
Figure 1.5Main components of the TEV of Palestinian forests ……….. … ... ..27
Figure 1.6. Forest types changes in different periods in Hebron District……… ... …30
Figure 1.7. Forest types changes in different periods in Jenin District……… ... .30
Figure 1.8 Forest types changes in different periods in Sulfit District……….. .... .30
Figure 1.9 Total forest area changes in Jenin District during the period 1974-2007 ... 31
Figure 1.10 Forest Types changes during the period 1974-2007 in Jenin District ... 31
Figure 1.11. Total forest area changes in Sulfit District during the period 1974-2007 ... 32
Figure 1.12. Forest types changes during the period 1974-2007 in Sulfit District ... 32
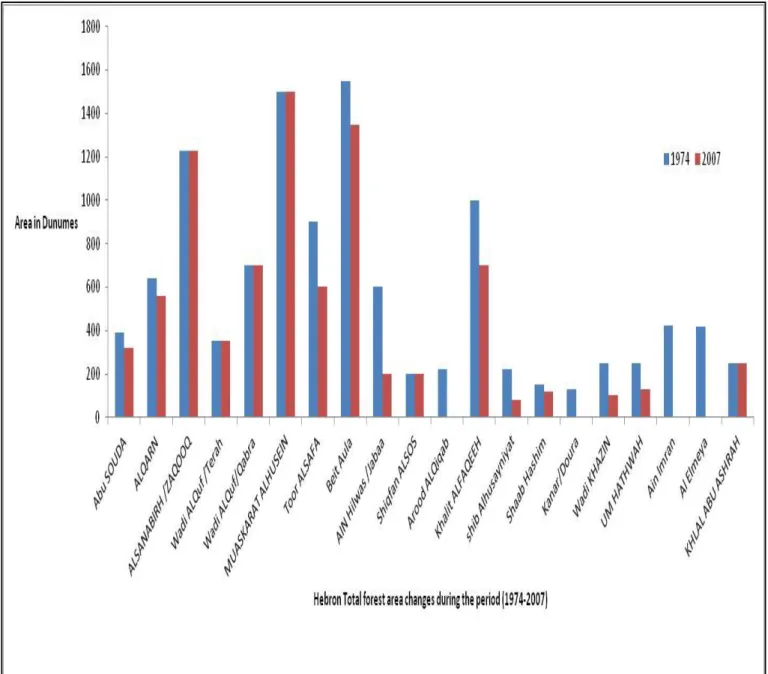
Figure 1.13 Total Forest Area changes in Hebron District during the period 1974-2007 ... 33
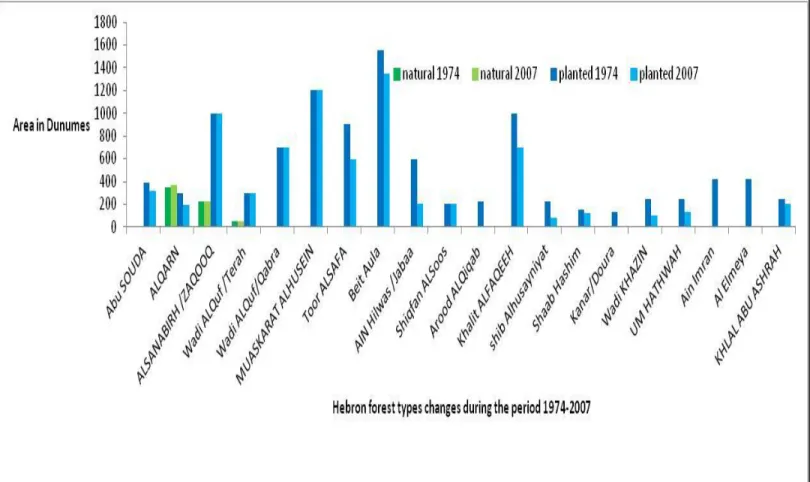
Figure 1.14. Forest types changes during the period 1974-2007 in Hebron District ... 34
Figure 1.15. Total forest area changes in Jericho District during the period 1974-2007………… . ..34
Figure 1.16. Forest area changes during 2002-2010……... . ...35
Figure 1.17 Shrubs area changes during 2002-2010……... . ...35
Figure 2.1 Landuse type in Sulfit During the year (2002,2010 ) ………... ... 42
Figure 2.2 Land use type in Hebron ( 2002 ,2010)……… …………... ... .43
Figure 2.3 Land use type changes in Jenin in (2002, 2010 )……… ……. ... 44
Figure 2.4 Land use type in Jericho 2002 , 2010 )……… ……… . ... ... 45
Figure 2.5. Map reflects the real situation of the West Bank and its fragmentation by different factors. ……….. ... ... .48
Figure 2.6 Habitat Fragmentation by road and the reduce of Biodiversity ……… . ... 50
Figure 2.7 corridor Roles ……….……... ... .. 54
Figure 2.8 corridor types ……… ... ... ...56
4
Figure 2.10 Corridor different types ... 60
Figure 3.1 Map for the Study Area in the WestBank , the location of ecological selected sites is shown ... 68
Figure 3.2 Geographical location map for ( Jenin , Sulfit , Jericho & Hebron ) ……….83
Figure 4.1 Histogram reporting the averaged scoresfor magnitude and knowledge of local threats (total value for all sites)...89
Figure 4.2 Total averaged scores for magnitude at each site (total value for all threats). Values are in decreasing order of total magnitude ... 90
Figure 4.3 percentage for Sulfit landuse classes at class level ... 97
Figure 4.4Number of Patches for Sulfit landuse classes at class level ... 97
Figure 4.5 Mean Patch Size (MPS) for sulfit landuse classes at class level ... 98
Figure 4.6 Area Weight Mean Shape Index for Sulfit landuse classes at class level ... 98
Figure 4.7 Mean Patch Fractal Dimension for Sulfit land use classes at class level ... 99
Figure 4.8 Area Weight Mean Patch Fractal Dimension (AWMPFD) for Sulfit land use classes ... 99
Figure 4.9 Mean patch Area Ratio ( MPAR ) for Sulfit land use classes at class level ... 100
Figure 4.10 Mean Shape Index (MSI) for sulfit landuse classes at class level ... 100
Figure 4.11Total Edge (TE) for Sulfit landuse classes at class level ... 101
Figure 4.12 Edge Density (ED) for Sulfit landuse classes at class level ... 101
Figure 4.13 Patch Size Standard Deviation (PSSD) for Sulfit landuse classes at class level ... 102
Figure 4.14 Percentage for Jenin landuse classes ... 104
Figure 4.15 Number of patches for Jenin landuse classes ... 104
Figure 4.16 Mean patch size (MPS) for Jenin landuse classes at class level……… ... 105
Figure 4.17 Area Weight Mean Shape Index (AWMSI) for Jenin land use classes at class level .. 105
Figure 4.18 Mean Patch Fractal Dimension (MPFD) for Jenin landuse classes at class level ... 106
Figure 4.19 Area Weight Mean Patch Fractal Dimension for Jenin landuses classes at class level 106 Figure 4.20 Mean Patch Area Ratio (MPAR) for Jenin landuse classes at class level ... 107
5 Figure 4.22 Patch size standard Deviation (PSSD) for Jenin landuse classes at class
level………...……… ... ..108
Figure 4.23 Edge Density (ED) for Jenin landuse classes at class level ... 108
Figure 4.24 Total Edge (TE) for Jenin landuse classes at class level ... .109
Figure 4.25 Percentage for each class of Hebron landuse classes ... 112
Figure 4.26 Number of patches for Hebron landuse classes at class level ... 112
Figure 4.27 Mean Patch Size (MPS) for Hebron landuse classes at Class level ... 113
Figure 4.28 Area Weight Mean Shape Index (AWMSI) for Hebron landuse classes at class level ... …113
Figure 4.29 Mean Patch Fractal Dimension ( MPFD) for Hebron landuse classes at class level ……… ... ..114
Figure 4.30 Mean Shape index (MSI) for Hebron landuse classes at class level ... ….114
Figure 4.31 Mean Patch Area Ratio ( MPAR) for Hebron landuse classes at class level ... 115
Figure 4.32 Area Weight Mean Patch Fractal Dimension ( AWMPFD) for Hebron landuse classes ……… ... .115
Figure 4.33 Total Edge ( TE) For Hebron landuse classes at class level ... …….116
Figure 4.34 Patch size Standard Deviation ( PSSD) for Hebron landuse classes at class level ……….. ... 116
Figure 4.35 Edge Density for Hebron land use classes at class level ... ………117
Figure 4.36 Percentage for Jericho landuse classes ... 119
Figure 4.37 Number of Patches ( Num P) for Jericho landuse classes at class level ... ………..119
Figure 4.38 Mean patch size (MPS) for Jericho landuse Classes at class level ... ……….120
Figure 4.39 Area Weight Mean Shape index (AWMSI) for Jericho land use classes at class level ……… ... 121
Figure 4.40 Mean patch fractal Dimension for Jericho landuse classes at class level ... 122
Figure 4.41 Area Weight Mean Patch fractal Dimension (AWMPFD) For Jericho landuse classes … ... 122
Figure 4.42 Mean Patch Area (MPA) for Jericho landuse classes at class level . ………123
Figure 4.43 Mean shape index (MSI) for Jericho landuse classes at class level ... ………….123
Figure 4.44 Total Edge (TE) for Jericho landuse classes at class level ... 124
6
Figure 4.46 Patch size standard Deviation (PSSD) for Jericho landuse classes at class level.. ... 125
Figure 4.47 Total land area of ( Jericho , Jenin , Hebron , Salfit ) ……… ... …….126
Figure 4.48Number of Patches for ( Hebron , Jenin , Jericho , Salfit ) ……… ... ….. 126
Figure 4.49Different Landscape Metrics for (Hebron ,Jericho, Sulfit , Jenin ... 127
Figure 450 Edge Density at landscape level for (Hebron ,Jericho,Salfit , Jenin ) ... 128
Figure 4.51 Mean patch edge (MPE) at landscape level for ( Hebron , Jericho, Jenin, Salfit……128
Figure 4.52Shanon Diversity Index (SDI) and Shannon Evenness Index (SEI) for( Hebron , Jericho,Salfit , Jenin ). ... 129
Geographical Distribution of the Target species in Palestine ... ………..138
Figure 4.53 Agricultural values for WestBank lands ………. ... .139
Cultivation possibilities of the target species in Hebron , Jenin , Sulfit , Jericho ……..…….140-152 Figure 4.54 Vegetation Units of Israel , Jordan & Sinai ……… ... ..153
Figure 5.1 Ramat Hanadiv Location ………154
Figure 5.2 the selected specis in Ramat Hanadiv case study ……… ... 159
Figure 5.3 LARCH model results for the Mountain gazelle……… ... 168
Figure 5.4 Landscape connectivity for Ramat Hanadiv ……… ... …169
7
List of Tables:
Table 1:1. Type of Forest in West Bank and their Geographical location ……….21
Table 1:2 Facts about Forest Changes in the WestBank between 1970-2007 …… ... 27
Table 1:3 Area of forest natural reserves ... 26
Table 2: 1 Land cover classes changes during the 1881 and 2011 ... 41
Table 3:1 Description of the ecological selected sites in the West Bank ... 69
Table 3:2 Threat magnitude for each threats in each selected sites ... ... ....77
Table 3:3 Knowledge Value for each threat in each selected site ... ... ... ...79
Table 3:4 Sulfit cultivation possibility values for the target species for each class type ……… …..83
Table 3:5 Jenin District cultivation possibility values for the target species for each class type …83 Table 3:6 Hebron cultivation possibility values for the target species for each class type……… …84
Table 3:7 Jericho District cultivation possibility values for the target species for each class type ..84
Table 4.1 Significance analysis. Expert scores of threat magnitude for the 8 sites in West Bank.... 86
Table 4:2 Knowledge analysis. Expert scores of threat knowledge for the 8 sites in West Bank...87
Table 4.3 Comparison between magnitude and knowledge (Wilcoxon paired test ... 87
Table 4.4 Averaged scores of magnitude for local threats ... 88
Table 4.5 Total averaged scores of magnitude for each site ... 88
Table 4:6 Land scape Metrics Results for Sulfit ... 96
Table 4.7 Jenin land use Patch analysis results ………. ……… ... 103
Table 4.8 Hebron Landuse Patch analysis results ……… ... ..111
Table 4.9 Jericho landuse patch analysis results ……….. …. ... .118
Table 4.10 Importance of the target Species in traditional food and other ecological and economic Value ……… ... . 138
Table 5.1 Selected Species and their ecosystem for the case study of ecological corridor necessity ... 159
Table 5.2 Summary Data for modeling for selected species in Ramat Hanadiv ... 160
Table 5.3 LARCH analysis results for the Mountain gazelle. Population assessment and network viability assessment ………. ... . 162
12
Introduction
Chapter one :
1.1 Forests in the West Bank
Palestine, as part of the Eastern Mediterranean region, constitutes one of the rich eological region. It is the meeting ground for plant species originating from wide-flung world regions, as far apart as Western Europe, Central Asia and Eastern Africa. This location is also nurturing the Palestinian biological diversity through the abruptness with which climatic zones, desert, steppe, Mediterranean woodland, and even oasis-join one another in this compact geographical area. It is characterized by a large variety of wildlife resources and represents a rich base of flora and fauna where the natural biota is composed by an estimated 2,483 species of plants, 470 species of birds, 95 species of mammals, 7 species of amphibians, and 93 species of reptile that inhabit Palestine (Shmida, 1995). The vegetation of Palestine comprises a considerable number of different plant formations ranging from dense forests to thin patches of desert herbs passing through different forms of plant communities:
1. Maquis (areas containing small trees and shrubs) and Forests: Located in the mountains of Judea, the Carmel and Galilee, these were the main woodlands. In most of the area today, the wild trees have been replaced by cultivated plants and domesticated trees, such as the olive and almond, or have been reforested with the Aleppo pine (Pinus halepensis). Where cultivated land have been abandoned, low herbaceous Mediterranean semi-shrubs grow.
2. Oak Woodlands: On the volcanic rock of the occupied Golan Heights, maquis dominated by the common oak (Quercus robur) grows in areas higher than 500 meters above sea level. Botanists believe that the woodland ranges here have decreased substantially during the past century.
3. Winter Deciduous (Montane) Forests: On Mount Hermon, between 1,300 and 1,800 meters above sea level, winter deciduous trees and shrubs that can withstand the cold and wind flourish.
13 4. Mount Tabor Oak (Quercus ithaburensis) Woodlands: This Mediterranean tree grows in Palestine's drier and warmer coastal areas, although much of these woodlands have been converted into olive groves.
5. Carob and Terebinth Woodlands: These forests cover the limestone hills at the foot of the central mountain range.
6. Lotus and Herbaceous Vegetation: These shrubs are scattered over the hilly south-eastern Galilee, making it look like a park without trees.
7. Savanna Mediterranean: In areas too warm and too dry for Mediterranean trees, the quasi-tropical jujube and spiny trees of Sudanese origin grow.
8. Semi-Steppe: Where Palestine’s Mediterranean region meets the desert, the vegetation changes to semi-shrubs.
9. Cushion-Plants: Mount Hermon plants that grow beyond 1,900 meters above sea level must survive three to five months covered by snow each year and another four to five months of drought. The dominant vegetation here is small, spiny, rounded, dense shrubs known as cushion-plants.
10. Steppe: Semi-shrubs cover the slopes and hills of areas of the country that receive 80 to 250 mm of rain a year. This vegetation formation is often referred to as steppe.
11. Atlantic Terebinth Steppe: On rocky terrain higher than 800 meters a.s.l., the Atlantic terebinth (Pistacia atlantica) grows.
12. Desert: Steppe vegetation gradually gives way to Saharo-Arabian plant species as the climate becomes drier.
13. Sand: Each of Palestine's three sandy areas has a different climate and sand of different origin. Each, therefore, has different kinds of vegetation.
14 14. Oases: The warmest parts of Palestine are the Araba (Arava), the Dead Sea and the Jordan valley. Run-off and underground water accumulate here, enabling trees of Sudanese origin to grow in the oases, and salt-resistant date palms (Phoenix dactylifera) to flourish around desert springs.
15. Desert Savanna: In the Rift Valley, rainfall gradually increases northward from an annual 30 mm around Aila (Eilat) to 150 mm north of Areeha (Jericho). Sudanese trees with long roots take advantage of the high water table in this area of poor rainfall; making parts of it resemble the East African savannas.
16. Araba (Arava) Woodland: The deep sands of the Wadi Araba (Arava Valley) are covered with sparse woodland of trees growing up to 4 meters in height.
17. Swamps and Reed Thickets: Water-logged soils on river banks support dense vegetation.
18. Wet Saline: Salty water moistens the soil throughout the year along the Jordan, the Dead Sea, the Wadi Araba (Arava valley) and on the Mediterranean shore near Akka
15 Figure ( 1.1) Type of Palestine vegetation cover during the period 1800 and 2011 in figures A and B respectively.(Schaffer and Levin ., 2014)
16 The presence of such a rich plant variety represented by trees, shrubs and herbs that survive in different environmental conditions indicates their diverse genetic background. There are 60 species of natural trees and 90 species of bush distributed all over Palestine (Bregheith, 1995).
The Palestinian ecosystems defined here as West Bank and Gaza Strip, including East Jerusalem, are home to an estimated 23,159 hectares of forested areas. These forest environments provide a habitat for a great diversity of flora and fauna. This makes them an important key in protecting the biological resources of Palestine (Roubina Ghattas et al, 2007 )
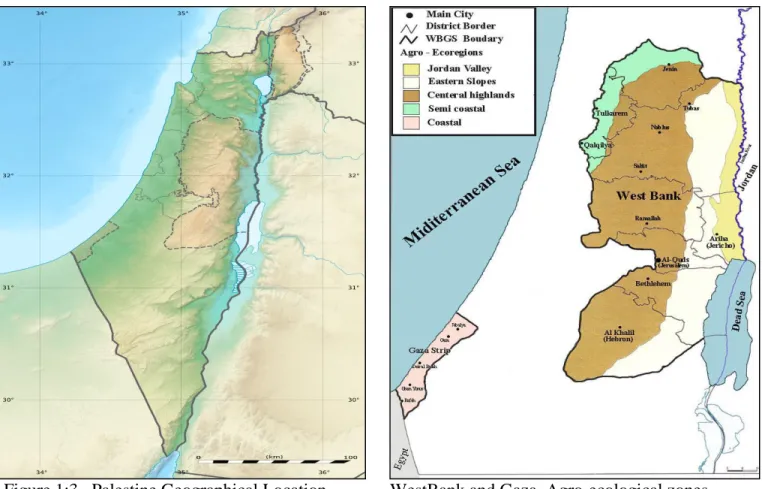
The Palestinian Territories can be divided into five agro-ecological zones as indicated below
Jordan valley The area is wide about 413 km2, low lying (-375 to -200 m below sea level) region
along the western bank of the Jordan river. A semi-tropical region with hot summers and warm winters. It is an arid region with an average annual rainfall of approximately 160 mm. The main agricultural activity in this area is irrigated vegetable production.
Eastern slopes: This area have a size of 594 km2, extend the length of the eastern edge of the West
Bank (-200 to 800 m). This semi-arid region is in the rain shadow of the central highlands with annual precipitation ranging from 200 mm in the south to 400 mm in the north. The main agricultural activity is animal grazing.
Semi-coastal region: This area is 470.5 Km2 wide (the smallest of the West Bank’s agro-ecological
regions) and it is located in the north west corner of the West Bank (100 to 400 m a.s.l.). It is a productive agricultural area receiving 600 mm of annual precipitation. The main agricultural activities are field crop production and citrus trees.
Central highlands: This area of the West Bank is 3144.5 Km2 wide extending from Jenin in the north to Hebron in the south (400 to 1000 m). It is the main catchment area for the West Bank aquifers with annual precipitation ranging from 500 to 800 mm. The main agricultural activity is fruit tree production (e.g. olive trees).
Coastal region: This small strip is 365 Km2 wide and it is located along the coast of the Mediterranean Sea (0 to 100 m a.s.l.). Annual rainfall ranges from 200 mm in the south to 400 mm in
17 the north. The main agricultural activities are irrigated vegetable and citrus tree production. Also horticulture production is prevalent.
Figure 1:3. Palestine Geographical Location WestBank and Gaza Agro-ecological zones
1.2 Palestinian forest types according to the Quézel classification.
According to the Quézel classification, the Palestinian forests can be divided into the following types:
(i) Carob–lentisk maquis corresponding to thermophilic wild olive and pistachio scrubs. This is
a rather dense carpet of low shrubs, consisting of Pistacia lentiscus and other associated species. It occurs scattered together with carob trees, which often attain a height of 4 m or more. Both of the leading plants are evergreen. The carob–lentisk maquis occupies large stretches in Palestine. It is widespread on the western foothills of the mountain belt, on the slopes of Galilee and Nablus, and on dunes and kurkar hills on the Coastal Plain. The soil varies from terra rossa to rendzina and kurkar sandstone.
18 In this association, numerous Mediterranean chamaephytes, such as Cistus villosus, C. salvifolius, Calycotome villosa and Phlomis viscose are found. In the north, the association comprises Mediterranean shrubs such as Olea europaea and Amygdalus communis. On sand dunes, the association includes two leading species, Ceratonia and Pistacia, together with a series of shrubs, such as Retama raetam, Artemisia monosperma and Lycium europeaum (Zohary, 1962).
(ii) Pine forest corresponding to the Mediterranean conifer forests of Aleppo pine, brutia pine, stone pine and Phoenician juniper. This type of forest is dominated by Aleppo pine (Pinus
halepensis) and is often accompanied by shrubs and trees of maquis and garrigue, such as Quercus calliprinos, Pistacia lentiscus, P. palaestina, Arbutus andrachne, Juniperus oxycedrus, Cistus salvifolius, Salvia fruticosa, Calycotome villosa and many other perennial and annual species. The Aleppo pine forest extends from the sea level in Lebanon to an altitude of more than 800 m a.s.l.. It is confined to and scattered on rendzina soils all over the Mediterranean mountain range, clearly indicating its former sphere of distribution, especially considering that rendzina soil moisture content is sufficient to support pine seedlings during the summer. Larger stands have been preserved on Mount Carmel, in the mountains of southern Nablus. Pine forests are very susceptible to fire; unlike other forest and maquis trees, the Aleppo pine is not able to renew growth from its stump and propagates from seed only. In addition, due to its high quality timber, it has been clear cut over large areas (Zohary, 1962).
(iii) Evergreen oak maquis and forest corresponding to sclerophyllous evergreen oak forests of holm oak, cork oak and kermes oak. This is the most typical and common forest and maquis
formation of the Mediterranean part of Palestine. The dominant type of association is the Quercus calliprinos–Pistacia palaestina association. This occurs generally in the form of maquis and comprises, apart from the dominating Quercus and Pistacia, a series of other Mediterranean evergreen trees and shrubs such as Laurus nobilis, Arbutus andrachne and Phillyrea media; and, in addition, Styrax officinalis, Rhamnus palaestina and Crataegus azarolus. The most typical climbers of the maquis are Clematis cirrhosa, Tamus communis and Lonicera etruca. The maquis gives shelter to a large number of beautiful bulb and tuber plants such as the species of Tulipa (Liliaceae), Allium (Liliaceae), Colchicum (Liliaceae), Crocus (Iridaceae), Orchis (Orchidaceae), Ophrys (Orchidaceae) and shade-demanding ferns. Where the maquis is less dense, it offers optimal growth conditions for a wealth of annual and perennial herbs. This type of maquis is common throughout the western mountain belt, from the foot of the Lebanese hills in the north, up to the Judean Mountains (Jerusalem
19 and Hebron) in the south. It is most characteristic of the Mediterranean terra rossa, but it also occurs on certain variants of rendzina (Zohary, 1962).
(iv) Deciduous oak forest corresponding to deciduous forests of zeen oak, afares oak, Lebanese oak, tauzin oak, hornbeam, ash and occasionally beech. This type belongs to a large group of
broadleaved, deciduous forests. It reaches its southern limit of distribution and has different forms of association. It can be found together with a grass community dominated by Desmostachya bipinnata. However, this association has been almost totally destroyed by man and citriculture. On the other hand, a typical oak forest is that which is associated with and accompanied by Styrax officinalis and, under favourable ecological conditions, also by P. palaestina, Crataegus azarolus, Phillyrea media, C. cirrhosa, Anemone coronaria, Cyclamen persicum and Arum palaestinum (Zohary, 1966).
(v) Savannah forests (not included in Quézel classification). This type largely consists of thorny
acacia species (such as A. raddiana), Ziziphus spina-christi, Salvadora persica and other tropical trees and shrubs which are distributed throughout the Jordan Valley, Dead Sea shore and in the southern Coastal Plain. Z. spina-christi is widely spread in the Gaza Strip and other places characterized by high temperatures. It is considered an important series of plant communities for the environmental balance in the valleys, coast and Gaza Strip.
(vi) Riparian forests (not included in Quézel classification). Consisting mainly of various species
of Salix spp. (such as S. acmophylla), Tamarix spp. (such as T. jordanus) and Populus spp. (such as P. euphratica), these predominate near rivers in warm areas. At the same time, forests of Platanus (such as P. orientalis), Fraxinus (such as F. syriaca) and Ulmus (such as U. canescens) occupy cold areas near water sources.
Forest typologies
Of the total forest area, around 79% comprises natural forest, 12% plantations and the remaining 9% is bare land with sparse vegetation. Most of the natural forest area is concentrated on the Eastern Slopes. It consists of a very open pseudo-savanna type with sparse large trees of Ceratonia siliqua and small shrubs such as Pistacia lentiscus and Rhamnus palaestinus. The dry areas of the eastern slopes contain species such as Ziziphus lotus and Retama raetam, while the dwarf shrubs Sarcopoterium spinosum are located between the central highlands area and grasses.
In the Central Highlands, natural forests are represented by Aleppo pine and evergreen oak maquis. The principle tree and shrub species include Quercus caliprinos, C. siliqua, Pistacia palaestina and P. lentiscus. The open garrigue and batha are mostly represented by S. spinosum, Cistus villosus,
20 Phlomis viscosa and Thymus capitatus. These species also grow on the Semi Coast, where, additionally, species such as Euphorbia perelis, Senecio vernalis, Thymelaea hirsutum and Lupinus palaestinus can be found.
The Jordan Valley does not contain any officially designated forests. However, there is a
large area of natural forests, partly protected as Israel declared them nature reserves. Along the River Jordan and the Dead Sea, there is a large area of riparian forest and wetland – considered military land since 1970 – with closed reed trees, such as Tamarix jordanica, and shrubs, such as Atriplex spp., Lycium spp. and Nitraria retusa.
The planted forests are mainly located in the Central Highlands. To a small extent, they can also be found in the Coastal Plain of Gaza where plantations were undertaken at a very low density with species including Acacia spp., E. camaldulensis and Tamarix spp. The main sand dune fixation species in Gaza are Suaeda splendens, Salsola soda, Aster tripolium, Atriplex hasitatata, Ipomaea stolonifera, Salsola kali, Euphorbia peplis, Tamarix nilotica, Artemisia monosperma and Ammopila arenaria. Most of these forests, though ‘naturalized’, are still classified as planted forests (Euroconsult/Iwaco, 1994).
Officially designated bare land with sparse vegetation is concentrated in the Central Highlands and Semi Coast. It should be stressed that actually most of the natural forest area in the Eastern Slopes is currently bare and consists of sparse vegetation (Maurizio et al., 2005).
21 Table 1:1. Type of Forest in West Bank and their Geographical location
Forest Type Internal
climate Ecological topographic Location special environment Geographical Location Area (Ha)
Dunes Forest Eastern
Mediterranean , Irani Turani
Coastal moving coastal sand dunes
Beit Hanoon /Gaza
50
Dunes Forest Eastern
Mediterranean , Irani Turani
Coastal moving coastal sand dunes
Khan Yunis/Gaza
100
Total Forest Dunes 150
planted pine forest (Artificial) Eastern Mediterranean
Semicoastal Semicoastal Jenin / WestBank
546.3 planted pine forest( Artificial) Eastern
Mediterranean
Semicoastal Semicoastal Qalqilia/WestBa nk
15 Total of Planted pine Artificial
Forest in the Semi coastal forests
561.3 Planted pine forest(Artificial ) Eastern
Mediterranean
Mountinous Area
Western Slopes Tulkarim / West Bank
108.8 Planted pine forest( Artificial) Eastern
Mediterranean
Mountinous Area
Western Slopes Sulfit / WestBank
12 Planted pine forest( Artificial) Eastern
Mediterranean
Mountinous Area
Western Slopes Ramallah / WestBank
15 Planted pine forest( Artificial) Eastern
Mediterranean
Mountinous Area
Western Slopes Beithlehem / WestBank
50 Planted pine forest( Artificial) Eastern
Mediterranean
Mountinous Area
Western Slopes Hebron / WestBank
538 Total of planted pine ( Artificial
) forest in the western slopes
723.8 Planted pine forest ( Artificial ) Eastern
Mediterranean
Mountainous Area
Highly mountain Jenin /WestBank
10 Planted pine forest Eastern
Mediterranean
Mountinous Area
Highly Mountain Nablus/WestBan k
62.2 Planted Pine Forest Eastern
Mediterranean
Mountinous Area
Highly Mountain Ramallah/West Bank
102.7 Planted pine forest Eastern
Mediterranean
Mountinous Area
Highly Mountain Jerusalem /WestBank
110 Planted pine forest Eastern
Mediterranean
Mountinous Area
Highly Mountain Beithlehem /WestBank
70.8 Planted pine forest Eastern
Mediterranean
Mountinous Area
Highly Mountain Hebron/WestBa nk
147 Total of Planted Pine ( Artificial)
Forest in the Highly Mountain
502.7
Planted pine forest Eastern Mediterranean
Mountainous Area
Eastern Slopes Jenin /WestBank
258 Planted pine forest Eastern
Mediterranean
Mountainous Area
Eastern Slopes Tubas /WestBank
140 Planted pine forest Eastern
Mediterranean
Mountainous Area
Eastern Slopes Nablus /WestBank
124.4 Total planted pine forests in the
Eastern Slopes
522.4
22 Figure 1.4 forest types in The WestBank
1.3 A forestation programs history in the West Bank
A forestation programs in the West Bank were first implemented during the British Mandate, and then the Jordanian Administration. In 1927, the first law for the protection and development of forests in Palestine were legislated by the British. About 230.6 hectares of mountainous and steep land in the West Bank were planted with Cupressus spp. and Pinus spp. At the same period forest rangers were appointed to implement the law enforcement on the site and all over Palestine. In early 1930s nurseries were established to distribute seedlings to local governments and people as part of a Grand National a forestation scheme. In 1935 and at the British mandate period in Palestine only 90 hectares were afforested in Hebron and Nablus areas.
A forestation continued during the Jordanian Administration and after that by the Israeli occupation authorities. In 1971, the total area of the human-made forests had reached to 3,361.6 hectares, planted mostly with Pinus, Cupressus, Eucalyptus, and Acacia spp. Until 1971, the natural forests and nature reserves were distributed over different parts of the West Bank, occupying an area of 19,541 hectares, with the Jenin district featuring the largest area (18,637.1 hectares). The most prevalent trees were Ceratonia siliqua, Pistacia palaestina, Rhamnus spp., Styrax officinalis, Crataegus azarolus, Arbatus andrachini, wild Pyrus and Prunus, and Olea europaea. The dominant shrubs and woody plants are Sarcopoterium spinosum, Phlomis spp., Salavia spp., Organa syriaca, and Clematis cirrhosa.
As of 1971, Israel stopped all forestry activities and closed forestry nurseries in most districts of the West Bank. The only nursery left functioning was Wadi Al-Quf Nursery in the Hebron district, but its
23 potential was reduced to only ten thousand tree seedlings per year. Since then, both types of natural and human-made forests were exposed too much destruction perpetrated by both Israelis and Palestinians.
Large areas of these forests have been confiscated by Israel and declared as closed military areas and military bases. Large numbers of trees have been uprooted to clear areas for the construction of Israeli colonies. Photos below show the destruction of Abu Ghnaim Mountain to the south of Jerusalem district. Palestinians also deplete many forested areas through wood-cutting used for fuel (either as biomass or for coal production). These activities, combined with natural destructive elements such as wind, snow, soil erosion, ageing, and accidental fires left dramatic scars on forests in the West Bank. They resulted in a vast reduction of the natural and human-made forested areas.
The Palestinian Ministry of Agriculture in 1995 estimated the area of the natural forest at 10,070 hectares and the human-made forest at 1,940 hectares (Breghieth, 1995). The difference in areas is referred to that the Ministry of Agriculture estimates are based on the 1971 forested areas and that they considered each forested area as forest whether it includes trees or not. Most of these forests are located on fertile soil types (Terra Rossas, Brown Rendzinas and Pale Rendzinas) and in areas, which enjoy favorable climatic conditions for agriculture.
Figure 1:4. Abu Ghnaim Mountain Forests situation in 1997 and 2003.
Benefits of biodiversity
Sustainable use of biodiversity is considered a perquisite for sustainable social and economic development; it ensures the continuing provision of goods and services from ecosystems and their
24 components. The Palestinian land has several diverse ecosystems, which have favored the country with rich cultural and natural resources.
An economic valuation of biodiversity provides one way of taking practical decisions on where conservation action is most needed, and a variety of conservation techniques that have to be developed both in situ and ex situ. The wildlife and the cultivated species of agriculture are directly contributing and supporting the main income of people in the West Bank and Gaza Strip.The economical value of several biological products could be categorized as follows:
Food plants
Different parts of useful plants are used by the Palestinians as direct food which includes: food cereals and pulses, root and tubers, oil, fruits and nuts, vegetables, herb, spices, drugs and medicinal plants. Some plants are used for their stems and leaves such as Diplotaxis acris, Rumex roseum, Chenipodium spp., Eryngium creticum, Malva rotundifolia, Lactuca cretica, Cichorium punilum and others. Some other plants are used for their fruits such as Rubus sanctus, Crataegus spp., Pyrus syriaca, Prunus ursina, Prosopis farcta, Ceratonia siliqua, Zizyphus spp., Arbatus andrachne and others. Other useful plants are used as raw material for industrial issues or as forages, fiber plants, and other miscellaneous purposes such as Pistacia palestina, Cistus creticus and Pinus halepensis that are used for producing gums and resins (ARIJ, 1997).
Medicinal plants
The West Bank and Gaza Strip are rich with plants that have different medicinal values, such as herbs, perfumes and dye plants. Medicinal plants were and are used by Palestinians according to traditional ways. Special people called “Al A’atarin” used to collecting medicinal plants from Bedouins and villagers who pick them in the wilderness and sell their useful parts to the public. Medicinal plants contain powerful natural chemical constituents and at the same time they are cheaper than those artificially synthesized. The products of these plants can be used in drugs, industrial food manufacturing, or other industries. The most popularly used medicinal plants in Palestine are: Crocus spp., Colchicium spp., Cyclamen spp., Lilium spp., Scilla spp., Rhus coriaria, Calotropis procera, Indula viscosa, Achillea santolina, Artemisia herba-alba, Matricaria chamomilla, Citrullus colocynthis, Avena sativa, Thymus bovei, Salvia fruticosa, Teucrium polium, Trigonella foenumgercum, Rosa canina, etc. On the other hand, some plants are used as perfumes and dyes such as Achillea aleppica, Achillea santolina, Artemisia monosperma, Anchusa strigosa, Arnebi
25 decumbens, Echuim spp., Isatis lusitanica, Rubia tenuifolia, Reseda luteola, etc. Unfortunately, the over-exploitation of medicinal plants is eroding genetic resources in Palestine.
Forest plants
Forests in Palestine produce timber, used mainly as an energy source (fuel). The major benefit of forests in Palestine is the microclimate they induce, the filtering of air pollutants generated from urban areas, the retention of water in the ground and the fixing the mobile sand, dunes and soils. Recreation and ecotourism can also transform forest areas into major sources of economic revenues. Cupressus spp.,Quercus spp., Acacia spp. and Pinus spp. and Acacia cyanophylla, Eucalyptus spp. and Tamarix spp. are the major forested economic plants in the West Bank and Gaza Strip respectively (ARIJ, GIS Unit).
The beauty of wild flora in the West Bank and Gaza Strip gives a significant ornamental importance to the area. Although ornamental plants are usually cultivated, they remain a significant part of trade in wild plants.
The major families used as ornamental plants are the Rananculaceae, Iridaceae, and Papaveraceae.
1.4 Forest and range resources in Palestine
Twenty seven percent of the total area of Palestine (6207 km2) composed of forests and rangelands. Both areas differ and maintain diverse eco-systems, climate, topography and biological resources. The most dominant either cultivated or wild exiting trees are oak, pines, ceratonia, pistacia, cypress, wild olives, almonds and pears. Areas such as the Jordan Valley and Gaza Strip are covered with tropical forest trees such as Ziziphus, Tamarix, Halexylon, Acacia and others, which have special capability to tolerate temperatures and salinity and the ability to stabilize soils and sand dunes.
Records show that due to confiscation of Palestinian lands for Israeli settlements and over population in Palestine forest and rangeland usage in Palestine have changed over the last fifty years. There has been an increase in wood collection for wood usage in different industries. Local people were very much dependent on forest resources in Palestine, although in present times there are less resources and less people are using such resources for different livelihood aspects.
In recent years, for example, high pressure on plant collection for Oregano was seen, while medicinal plant collection is decreasing in the past several decades.
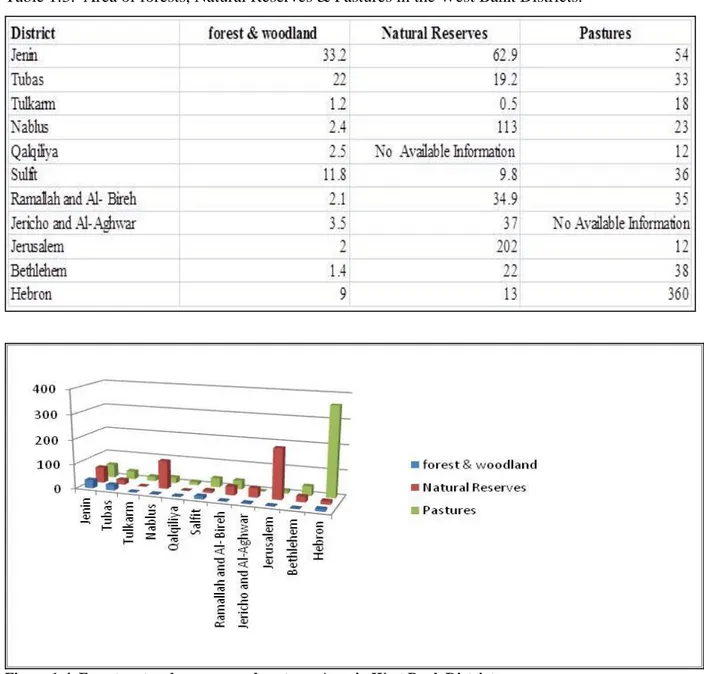
26 Table 1:3. Area of forests, Natural Reserves & Pastures in the West Bank Districts.
Figure 1:4. Forest, natural reserves and pastures Area in West Bank Districts.
Source: Palestinian Central Bureau of Statistics, 2009. Land Use Statistics in the Palestinian Territory, 2008.
1.5 Forests Functions
The main usage of forest and rangeland products in Palestine can be summarized as follows:
Fuel production from natural wood of pistachio and oak trees.
Food from fruits and leaves of oak, pistachio, summaq, Carob and others.
Medicinal usage of oak fruits, pistachio, oregano, mint, phangnalon and others.
27
Broom and other household production.
Filters from Eurocaria and Rebudia.
Fertilizers for farming and nurseries from forest tree leaves.
As decorative plants in gardens and houses.
Souvenirs and other touristic industries from oak, pistachio, pine, cypresses.
In paints and glue.
Gums and honey production.
Tools in agriculture (genetic resources for fruit trees).
Recreational purposes. Source: Palestinian Environmental Authority, 1999.
Figure 1: 5 Main components of the Total Economic Value of Palestinian forests (Merlo, 2005)
Threats and impacts:
Lack of land use management
Lack of management of forest and range resources.
Lack of management of tourists’ activities.
Lack of systematic research and monitoring.
Inadequate clear management vision towards forest resources usage.
Cutting of natural forests and vegetation for fuel and other house hold appliances
Soil erosion and loss of soil natural environmental condition such as desertification.
28
Introduction of exotic species of forest species animal species.
Transportation schemes and road buildings, affecting forest and tree abundance and natural distribution.
Liquid and solid pollution in Forests.
Air and atmospheric pollution and dust lift up from transportation and mining activities.
Water over pumping from forests wadis, springs and watersheds.
Illegal hunting in forests for key species.
Introduction of exotic plant and animal species.
Disappearance of faunal species important for forest balance and ecology.
Manmade fires.
29
1.6
Facts about Forest Changes in the WestBank between 1970-2007
The Table below show the changes in forest areas in all the West Bank district since 1971-2007 for the Natural, Planted and Bare forest.
Table 1:4. Types of forest area changes in different period in the West Bank Districts.
Forest Type District Area (Ha)
1971
Area (Ha) 1999
Area (Ha) 2007
Natural forest Jenin 3,093 1,955 1919,1
Tubas 15,730 15,632 14,730 Qalqilia 150 0 No available data Sulfit 651 631 617.6 Ramallah 60 65 27.8 Hebron 63 63 65
Planted forest Jenin 861 680 814.3
Tulkarim 109 109 108.8 Tubas 170 165 140 Nablus 334 239 186.6 Qalqilia 130 68 15 sulfit 12 12 12 Ramallah 408 163 117.7 Jerusalem 279 199 1100 Hebron 972 807 685 Bethlehem 259 149 120.8 Gaza 4200 200 150
Bare land with sparse vegetation Jenin 1203 686 595.8 Tulkarm 10 10 10 Tubas 600 590 109.2 Qalqilia 209 185 28.7 Sulfit 540 540 479.5 Hebron 30 30 80
30
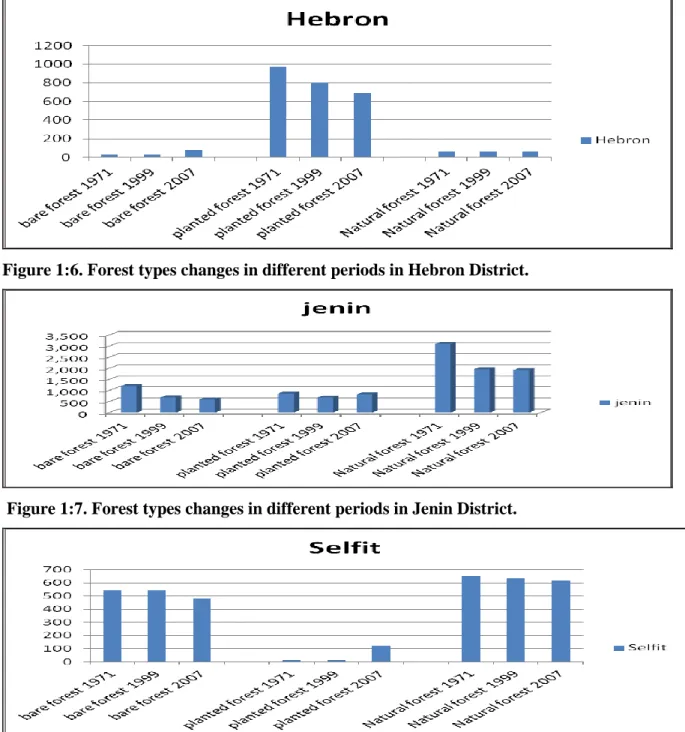
Figure 1:6. Forest types changes in different periods in Hebron District.
Figure 1:7. Forest types changes in different periods in Jenin District.
31
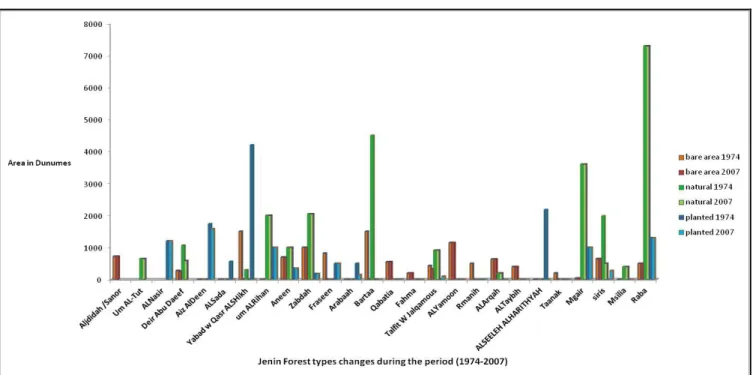
Figure 1:9 Total forest area changes in Jenin District during the period 1974-2007.
Figure 1:10 Forest Types changes during the period 1974-2007 in Jenin District.
32
Figure 1: 11. Total forest area changes in Sulfit District during the period 1974-2007.
33
Figure 1:13 Total forest area changes in Hebron during the period 1974-2007.
34
Figure 1:14. Forest types changes during the period 1974-2007 in Hebron District.
35
Figure 1:16. Forest area changes during 2002-2010.
36
Chapter Two : Habitat fragmentation and ecological corridor for conservation
2. Habitat destruction is the alteration of natural habitats to the point that it is rendered unsuitable to support sensitive species dependent upon it as their home territory. Modifying habitats for agriculture is the chief cause of such habitat loss. Other causes of habitat destruction include Surface mining, deforestation, slash and-burn practices and urban development.
Habitat destruction is presently ranked as the most significant cause of species extinction worldwide. Additional causes of habitat destruction include acidrain, water pollution, introduction of alien species, over grazing andoverfishing . A closely related concept is that of habitat fragmentation, where a habitat is separated into fragments that lack effect ecological connectivity, reducing the viability of some of the sensitive species . The fundamental driver of habitat destruction has been the un prevented human population explosion, which has been a unique event of a single species dominating natural systems of the Earth within the short time span of 10,000 years. The waves of habitat destruction are closely correlated with the numerical expansion of the human population as well as settlement incursions and change in lifestyle.
Habitat fragmentation usually occurs because of human activities such as new roads, parking lots and housing developments. Organisms need their specific habitat for survival, and fragmentation is a leading threat to many terrestrial animals. Not only are these animals separated from the resources they depend on, but they now have to travel across unsuitable areas, such as roads, to reach those resources.
Habitat fragmentation from human activities is not limited to urban areas. Logging is a major cause of habitat fragmentation in forests. Logging creates clear-cut, open ground areas that were once protected by the cover of trees. Logging roads that are built for the logging trucks to travel on can also be cut through forests, disrupting the habitat. Habitats may also become fragmented by natural processes. Rivers serve as natural pathways for both terrestrial and aquatic animals. If the river floods, it may make passage across it by terrestrial animals impossible. On the other hand, aquatic animals that depend on the river to move between two different water bodies will not be able to travel from one place to another if the river dries up.
Fragmented habitats may be subject to the edge effect. The edges of habitats are important parts of the landscape and are so unique that they have their own sets of physical conditions and communities
37 of organisms. When habitats become fragmented, their edges often become more abrupt and transition less smoothly than they would naturally. Edges usually have less diversity and are dominated by a small number of species specially adapted to those areas. When more edges are created, the species inhabiting edges expand into areas that they wouldn't normally be found. This creates new competition for the species native,linked to the originary fragmented habitats, and this can have detrimental effects on those original species. Also, since habitat fragmentation breaks the original habitat into smaller, isolated patches, movement between these patches can become dangerous for dispersing individuals. This is especially true if animals now have to cross something like a busy road. To make passage safer, wildlife corridors should be created.
Wildlife corridors are a thin strip of habitat linking larger patches of wild habitat. They are like
roads for animals, providing a safe way to get from one place to another. Wildlife corridors are often constructed as 'land bridges' across busy roads, or tunnels underground. Nevertheless, this is only a type of habitat connection (Bennett, 1997). Fragmentation and transformation of the natural landscape, creating thousands of patches of habitat, while some patches can have significant social value, such as green buffers or small urban parks, the majority of them have lost many of its ecological functions. On the other hand, the impacts produced by the combined effect of the sprawl of urban, industrial and transports systems, i.e. air or light pollution and noise, are such that they are negatively impacting almost all natural systems (Mallarach, 2000).
38
2.1 Main Biodiversity indicators for sustainable development in the OPT Ecosystem Habitat : Indicators of pressure / threatening processes
Habitat alteration and land conversion from its natural state : i. Deforestation: 59% since 1970 (MOA,1999),
ii. Uprooted Trees: 794162 trees since 10 years (ARIJ GIS,2006) .
iii. Palestinian built up area: increased by 21.3 % in Westbank ( last 5 years) (ARIJ GIS ,2006) and 41.9% in Gaza strip (Issac.et al., 2006).
iv. Israeli colonies area increased by 16.5% (last 5 years) (ARIJ GIS,2006).
Aquatic habitat destruction :
I. Over fishing: 33,8 % rare fish of total fish species in Gaza 8.5 % are very rare fish of total fish species in Gaza.
II. Pollution: 70-80% of the domestic wastewater produced in Gaza reaches the environment untreated and discharged into the Mediterrean sea.
- Indicators of State / loss of Biodiversity
i. Total vegetation cover : Total natural vegetation area forms 25.88% of total West Bank and Gaza Strip area (ARIJ GIS, 2006).
ii. Total forested area : Total forest area forms 1.42% of total West Bank area (ARIJ GIS, 2006).
iii. Protected areas : Total nature reserves area form 12.8% in the West Bank and Gaza strip (ARIJ, 2006)
Indicators of Response /Biodiversity conservation and management
i. Afforested areas : Total afforested areas forms 4.1% in West Bank and Gaza strip. ii. Forested conservation : No conservation programs.
iii. Marine protected areas : Three natural reserves are located in the coastal area of Gaza strip including with a total area estimated by 30 km2
39
Indicators of State/loss of Biodiversity
Species : Extinct, endangered and vulnerable species and ecological communities Rare species: 303 species (14.7 of total species).
Very rare species: 67 species (3.23% of total species). Endemic species: 102 species (4.9% of total species). Endangered endemic species: 47.1 % low frequent species
11.8 % rare species, 5 % very rare species.
Indicators of Response/Biodiversity conservation and management
I identification procedures: No detailed procedures for identifying endangered, rare and threatened species were developed .
Existing strategies : Existing strategies for in situ/ex situ conservation of genetic variation are mentioned in BSAPP( Biodiversity Strategy and action Plan for Palestine , 1999).
Biodiversity is often reduced dramatically by Land Use/Land Cover Changes (LULCC). When land is transformed from a primary forest to a farmland, the loss of forest species within deforested areas is immediate and almost complete. Even when unaccompanied by apparent changes in land cover, similar effects are observed whenever relatively undisturbed lands are transformed to more intensive uses, including livestock grazing, selective tree harvest and even fire prevention. The habitat suitability of forests and other ecosystems surrounding those under intensive use are also impacted by the fragmenting of existing habitat into smaller pieces (habitat fragmentation), which exposes forest edges to external influences and decreases core habitat area. Smaller habitat areas generally support fewer species (island biogeography; Mac Arthur and Wilson, 1967; Diamond, 1975), and for species requiring undisturbed core habitat, fragmentation can cause local and even general extinction. Research also demonstrates that species invasions by non-native plants, animals and diseases may occur more readily in areas exposed by LULCC, especially in proximity to human settlements. For example land cover in Israel underwent great changes between the late 19th century and the present. The most dominant land cover classes in the 1870s were 'open space' (77.8%) followed by 'garrigue' (6.5%) and 'maquis' (6.2%). On the other hand, the most dominant land cover classes at the
40 present were 'agricultural fields' (30%) followed by 'orchards' (17.4%), 'desert shrub steppe' (12.2%) and 'built-up areas' (12%). Some land cover classes shown on the PEF 1870s map did not exist in the present land cover map, such as 'open spaces' (referring to land cover which was not defined on the PEF map) and 'traces of forest' (relating to coastal forests cut down in the 19th century). Conversely, some present-day human-related land cover classes did not exist in the past, such as 'artificial water bodies' and 'planted forest'. Relative to the past land cover classes, the largest decrease in area was in 'marsh land'(-93.4%), 'winter pond' (-70.4%), 'gardens' (-66.9%), 'garrigue (-59.2%) and 'riparian vegetation (-58%) and the classes showing the largest increase from their past area were 'fir trees' (+11710.7%), 'built-up area' (+7165.7%), 'orchards' (+329.7%) and 'vineyards'(+294.1%).
41 Table 1:3 Land cover classes changes during the 1881 and 2011
( Schaffer and Levin., 2014 )
The Figures below represent the Land use changes during the Year 2002, 2010 respectively in four District of the West Bank (Sulfit, Hebron, Jenin, Jericho).
These district were chosen because our study areas in this research included in these Districts (more information will be found about the study areas in the next chapter).
42
43 Figure (2:2) Land use type in Hebron ( 2002 ,2010).
44 Figure 2:3 . Land use type changes in Jenin in (2002, 2010 )
45 (Figure 2:4 Land use type in Jericho 2002 , 2010 )
46
2.3 Palestine habitat situation
The Palestinian population all over the World account today for more than 9 million Palestinians distributed in the Palestinian Territories, Israel, the Arab World and other foreign countries. According to Palestinian Central Bureau of Statistics (PCBS) projections for the year 2004, the Palestinian population living in the Palestinian Territories is 3,827,914 of whom 2,421,491 (63.3%) live in the West Bank and 1,406,423 (36.7%) live in the Gaza Strip. There are approximately 661 Palestinian built-up areas in the West Bank spread over an area of 354,870 dunums(ARIJ database, 2002).
The Israeli territorial strategies of unrealistically limiting border expansion of cities and villages has overloaded infrastructure and increased population density in the built-up areas. It has also translated to the random, unplanned, and unlicensed construction of houses and urban sprawl. Furthermore, it has contributed to rural-urban migration by people who are unable to find housing in the rural areas” (MOPIC 1998:51). The living conditions in the West Bank are according to MOPIC degrading due to population growth and unsatisfactory urban development. Many elements contributed in shaping the patterns of Palestinian urban areas in the West Bank. The topography, the shape of the transportation routes, the surrounding agricultural and hinterlands and other resources, location, the physical structure, planning and control, were among many other elements that contributed to the development and the shaping of the urban patterns. Some Palestinian cities have strategic locations within the West Bank such as Hebron, Ramallah, and Jerusalem. Their urban pattern was shaped as result to their location at the main nodes from which the main and regional roads radiate to connect the West Bank, and the function they perform in relation to their surrounding or other urban centers. In other cities the urban pattern was shaped as a result of their location on areas that have natural resource potentials, water or agriculture such as the cities of Jericho and Qalqiliya. While in cities as Tulkarm, the urban pattern was shaped as a result to their location near the border line, their potential derived from their function as market areas and as nodes of connection with other regions inside the West Bank.
Israeli colonization
The jagged division of the West Bank into areas A, B, C, H1 and H2, according to the different Palestinian-Israeli peace accords has partitioned the territory into isolated cantons, which are physically separated from each other. Israeli colonies, outposts, bypass roads and lately the
47 Segregation Wall have been built on Palestinian lands, separating the Palestinian communities from each other and from their lands. Confiscation of approximately 52% of the West Bank land under various pretexts has imposed enormous limitations on Palestinian built-up areas. Significantly, the Israeli colonization has raised the population density in Palestinian built up areas. Population densities have become even higher if one takes into consideration the segregation imposed by the Oslo Accord. Area A has a population density of 969 people/km2, in Area B the population density reaches 1,118 people/km2, whereas in the East Jerusalem the population density exceeds 4,000 people/km2. The situation in the Gaza Strip is much worse, where population density reaches more than 3,600 people/km2 (PCBS, 1997). In contrast the population density in Israel averages 261 people/km2 (ICBS, 1997). Since the Israeli occupation of the West Bank in 1967, the Israeli land policy in the Palestinian Territories focused on land expropriation for the construction of Israeli colonies on Palestinian lands. The scope and type of land affected by Israeli colonization of the Palestinian territory is determined by the unique geopolitical ambitions of Israel to the Palestinian Territories. Two primary goals guided the expropriation of Palestinian land for the colonization project: expansion and separation from the Palestinian population. Land is therefore chosen for expropriation on hilltops overlooking and surrounding Palestinian built-up areas, areas that block the merging of Palestinian built-up areas while facilitating the merging of colonies, areas that may be easily annexed to Israeli proper in the future, or that secure economic resources, militarily advantage or negotiating leverage. During the years of occupation Israel managed to control 60% of the West Bank, over 30% of the West Bank area is confiscated and expropriated for exclusive Israeli use.
48 Figure 2:5. Map reflect the real situation of the West Bank and its fragmentation by different
factors.
Biological diversity is highly dependent on the quality, quantity, and spatial cohesion of natural areas. Fragmentation of natural habitats severely affects the abundance of species. A solution to this problem is the development of ecological networks, linking core areas of nature by means of corridors and small habitat patches. If wildlife is spread over a large area in small
49 numbers, and if the remaining areas are too small, sooner or later, wildlife species will disappear. Fragmentation severely affects the abundance of species. To allow for repopulating or restocking of small areas and habitats, the areas need to be connected to the remaining core areas for wildlife in the surrounding (Jongman et al. 2011; Snep and Ottburg 2008). For birds, this means that the distance from source areas to their habitat is less than the normal distance they might cover when flying. For non-flying animals it might mean that a physical connection is required that functions as a corridor (e.g., woodlands, streams, rivers, natural grasslands, and so forth; Grift et al. 2013; Van der Sluis et al. 2004). An answer to this problem is the strengthening of an ecological network, linking nature areas by means of corridors and small habitat patches (Opermanis et al. 2012; Van der Sluis et al. 2004; Van der Sluis et al. 2003; Vos et al. 2001). An ecological network consists of habitat patches for a population of a particular species that exchanges individuals by dispersal. Management of land in support of biodiversity covers a wide range of policies and practices. The most basic of these is to set-aside existing biodiversity habitats as conservation reserves from which humans are excluded. Another is the establishment of preserves and parks in which local human populations and tourists participate in the less harmful economic use and preservation of biodiversity lands. More recently, efforts are being made to restore biodiversity habitats on lands stripped of their original habitat, and to manage existing agricultural and urban landscapes to enhance their suitability as habitat by practices including the planting of native plants and the restoration of habitat patches within intensively managed landscapes. Another new land use practice is the establishment of corridors of habitat between existing patches of habitat distributed across landscapes, creating larger effective habitats by connecting smaller patches together and enhancing species migrations. This will be an especially important practice in response to future changes in climate that will cause the habitat ranges of many species to migrate, mostly northward, requiring species migration through managed areas.
Protection of productive agricultural land has become a major priority in many regions of the world. Land degradation by overgrazing and intensive agriculture on marginal lands is a major driver of land loss; a number of national and international programs have responded with land reforms and incentive programs to avoid this outcome. In rapidly industrializing nations with dense populations such as China, and in the past, Korea, Japan and Western European nations, demand for land for industry and residential use is driving the transformation of some of the
50 most productive agricultural land in the world out of production. Policy efforts to avoid this loss of production are also in place, but their effectiveness in the face of economic demand is often limited. Another threat is the wide adoption of automobile transportation in some developed nations, which has transformed large areas of agricultural land to relatively low density residential uses around cities and along highways (urban sprawl). “Smart growth” and other programs have been developed in these areas to encourage more efficient and desirable land use and to protect agricultural land. The examples above demonstrate the variety of solutions to environmental harm by LULCC that are in progress. The effectiveness of these and other regional and national efforts to reduce the negative impacts of LULCC remain to be seen. The need for greater efforts and new methods to monitor and mediate the negative consequences of LULCC remains acute, if we are to sustain current and future human populations under desirable conditions.
Figure ( 2.6 ) a. Habitat fragmentation by Roads b. Fragmentation reduce Biodiversity
Connectivity can be synthesized as the degree in which landscape facilitates or impedes species movements and other ecological flows (Rubio and Saura, 2012; Taylor et al. 1993), and is one