S H O R T R E P O R T
Open Access
Body mass index has a curvilinear relationship
with the percentage of body fat among children
Bruno Federico
*, Filomena D
’Aliesio, Fabio Pane, Giovanni Capelli and Angelo Rodio
Abstract
Background: Body Mass Index (BMI), which is defined as the ratio between weight (in kg) and height (in m2), is often used in clinical practice as well as in large scale epidemiological studies to classify subjects as underweight, normal weight, overweight or obese. Although BMI does not directly measure the percentage of Body Fat (BF%), it is widely applied because it is strongly related with BF%, it is easy to measure and it is an important predictor of mortality. Among children, age and sex-specific reference values of BMI, known as percentiles, are used. However, it is not clear how strong the relationship between BMI and BF% is among children and whether the association is linear. We performed a cross-sectional study aiming at evaluating the strength and shape of the relationship between BMI and BF% among school-aged children aged 6-12 years.
Findings: The study was conducted on a sample of 361 football-playing male children aged 6 to 12 years in Rome, Italy. Age, weight, height and skinfold thickness were collected. BF% was estimated using 4 skinfold equations whereas BMI was converted into BMI-for-age z-score. The relationship between these variables was examined using linear regression analyses. Mean BMI was 18.2 (± 2.8), whereas BF% was influenced by the skinfold equation used, with mean values ranging from 15.6% to 23.0%. A curvilinear relationship between BMI-for-age zscore and BF % was found, with the regression line being convex. The association between BMI-for-age zscore and BF% was stronger among overweight/obese children than among normal/underweight children. This curvilinear pattern was evident in all 4 skinfold equations used.
Conclusions: The association between BMI-for-age zscore and BF% is not linear among male children aged 6-12 years and it is stronger among overweight and obese subjects than among normal and underweight subjects. In this age group, BMI is a valid index of adiposity only among overweight and obese subjects.
Findings
The percentage of Body Fat (BF%) is currently estimated using several methods, which include underwater weigh-ing, air displacement plethysmography, dual-energy X-ray absorptiometry and bioelectrical impedance analysis [1]. Most of these methods are either extremely expen-sive or they require complex technologies and are there-fore of limited use in clinical practice as well as in large scale epidemiological studies. Within these contexts, anthropometric methods may instead prove to be extre-mely useful [2]. Body Mass Index (BMI), defined as the ratio between body mass (in kg) and height (in m2), is commonly used to define the conditions of obesity and overweight among adults [3]. Although BMI does not
directly measure BF%, it is a valid indicator of BF% [2] and it is very easy to measure. BMI is also an important predictor of mortality [4,5]. Among adults, BMI cut-off values of 25 and 30 define the conditions of overweight and obesity, respectively, whereas among children age and gender specific reference values of BMI, known as percentiles, are used [6]. Previous studies found that BMI was correlated with BF% among children, too [7,8]. However, all these studies assumed the existence of a linear association between these two variables. In this study, we aimed at evaluating the strength and shape of the relationship between BMI and BF% among school-aged children.
Using a cross-sectional design, we examined a sample of 361 football-playing male children aged 6 to 12 years enrolled in the child division of Lazio football team in Rome, Italy. The study protocol was approved by the
* Correspondence: [email protected]
Department of Health and Sport Sciences, University of Cassino, Cassino, Italy
Federicoet al. BMC Research Notes 2011, 4:301 http://www.biomedcentral.com/1756-0500/4/301
© 2011 Federico et al; licensee BioMed Central Ltd. This is an open access article distributed under the terms of the Creative Commons Attribution License (http://creativecommons.org/licenses/by/2.0), which permits unrestricted use, distribution, and reproduction in any medium, provided the original work is properly cited.
ethical review board of the Lazio football team child division. Informed consent to the study was given by either of the parents. Data collection was carried out by ad-hoc trained sports medicine physicians and
anthropometric measurements such as weight, height and skinfolds thickness were performed for each subject. Biceps, triceps, subscapular, supra-iliac and calf skinfolds were all measured with Harpenden skinfold calipers. Skinfold thickness measurement was performed three times on the not dominant limb by a single operator, and the mean value of the three measurements was used. Data were first registered on a paper form and then stored into an electronic format using the software Epidata Entry. Data entry was performed in duplicate to minimize entry errors.
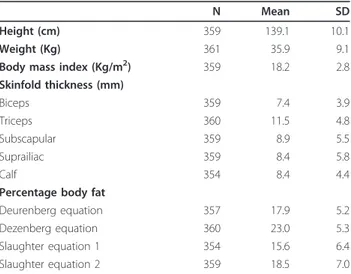
We used 4 skinfold equations in order to estimate BF % of each subject [9]. These equations, developed by Deurenberg, Dezenberg and Slaughter, are based on demographic data (age and gender), weight and different skinfolds depending on the equation used. BMI data were transformed into BMI-for-age z-scores using the LMS method and the reference data available from the 2000 CDC Growth Reference in the US [10,11]. Linear regression analyses were performed to evaluate the rela-tionship between BMI z-score (the independent variable) and BF% (the dependent variable). Subjects were also Table 1 Descriptive statistics of the sample
N Mean SD
Height (cm) 359 139.1 10.1
Weight (Kg) 361 35.9 9.1
Body mass index (Kg/m2) 359 18.2 2.8
Skinfold thickness (mm) Biceps 359 7.4 3.9 Triceps 360 11.5 4.8 Subscapular 359 8.9 5.5 Suprailiac 359 8.4 5.8 Calf 354 8.4 4.4
Percentage body fat
Deurenberg equation 357 17.9 5.2 Dezenberg equation 360 23.0 5.3 Slaughter equation 1 354 15.6 6.4 Slaughter equation 2 359 18.5 7.0 0 10 20 30 40 50 B o dy f at % ( D eur enbe rg) -2 -1 0 1 2 3 BMI-for-age zscore 0 10 20 30 40 50 B o dy f at % ( D ez enber g) -2 -1 0 1 2 3 BMI-for-age zscore 0 10 20 30 40 50 B o dy f at % ( S lau ght e r 1 ) -2 -1 0 1 2 3 BMI-for-age zscore 0 10 20 30 40 50 B o dy f at % ( S lau ght e r 2 ) -2 -1 0 1 2 3 BMI-for-age zscore 2 2 1 4 3 4 14. . x . x y= + + 2 9 1 2 . 4 8 . 13 x . x y= + + 2 6 0 9 3 0 20. . x . x y= + + 2 5 1 7 3 7 11. . x . x y= + +
Figure 1 Scatterplot and regression line (with 95% Confidence Intervals) of Body Fat percentage versus BMI-for-age zscore according to the four skinfold equations used.
Federicoet al. BMC Research Notes 2011, 4:301 http://www.biomedcentral.com/1756-0500/4/301
classified as overweight or obese according to the BMI cut-off points developed in an international survey [6]. All statistical analyses were carried out with Stata 11.2.
Sample descriptive statistics (mean and standard deviation) are shown in Table 1. Mean BMI was 18.2 (± 2.8), whereas BF% was influenced by the skinfold equa-tion used, with mean values ranging from 15.6% using Slaughter 1 equation to 23.0% using Dezenberg equa-tion. About 1 in 3 children was either overweight (24.4. %) or obese (5.6%).
A curvilinear relationship between BMI-for-age zscore and BF% was found, with the regression line being con-vex (Figure 1). This curvilinear pattern is evident in each of the 4 skinfold equations that we used to predict BF%. The addition of a quadratic term to the linear regression model significantly increased the proportion of the variability in BF% explained by the model: in the case of Deurenberg equation (top left panel in Figure 1), R2 increased from 0.66 to 0.72. Values for R2 for the quadratic model were 0.63 (Dezenberg), 0.60 (Slaughter 1), and 0.69 (Slaughter 2).
When the regression analysis was performed sepa-rately among normal and overweight/obese subjects, beta coefficients (which indicate the slope of the regres-sion lines) were significantly smaller for the normal weight category than in the overweight/obese category. In the case of Deurenberg equation, beta coefficient was 2.9 among the former category, and 6.7 among the latter category (p < 0.001). Differences of a similar extent between beta coefficients were observed for the other 3 skinfold equations.
To conclude, our study shows that there is a curvi-linear relationship between BMI-for-age z-score and BF %, with strong correlations existing only among over-weight and obese subjects. This finding is confirmed by the results of other studies, which used different meth-ods of analyses [12-14], and it implies that the use of BMI as an index of adiposity among children is valid only among overweight and obese subjects.
List of abbreviations used
BMI: Body Mass Index; BF%: Body Fat percentage
Acknowledgements
This study was partially funded by the Department of Health and Sport Sciences of the University of Cassino. We thank Dr. Saverio Tomaiuolo for revising the manuscript with regard to the use of the English language.
Authors’ contributions
BF designed the study and drafted the manuscript. FDA and FP contributed to data collection and data analyses and they both contributed to revising the drafts. GC participated in the design of the study and performed data analyses. AR had the original idea of the study, he was responsible for data collection and he revised the drafts. All authors read and approved the final manuscript.
Competing interests
The authors declare that they have no competing interests.
Received: 26 May 2011 Accepted: 18 August 2011 Published: 18 August 2011
References
1. Sweeting HN: Measurement and definitions of obesity in childhood and adolescence: a field guide for the uninitiated. Nutr J 2007, 6:32. 2. Taylor RW, Keil D, Gold EJ, Williams SM, Goulding A: Body mass index,
waist girth, and waist-to-hip ratio as indexes of total and regional adiposity in women: evaluation using receiver operating characteristic curves. Am J Clin Nutr 1998, 67:44-49.
3. Global Database on Body Mass Index. [http://apps.who.int/bmi/index.jsp]. 4. Calle EE, Thun MJ, Petrelli JM, Rodriguez C, Heath CW Jr: Body-mass index and mortality in a prospective cohort of U.S. adults. N Engl J Med 1999, 341:1097-1105.
5. Wandell PE, Carlsson AC, Theobald H: The association between BMI value and long-term mortality. Int J Obes (Lond) 2009, 33:577-582.
6. Cole TJ, Bellizzi MC, Flegal KM, Dietz WH: Establishing a standard definition for child overweight and obesity worldwide: international survey. BMJ 2000, 320:1240-1243.
7. Maynard LM, Wisemandle W, Roche AF, Chumlea WC, Guo SS, Siervogel RM: Childhood body composition in relation to body mass index. Pediatrics 2001, 107:344-350.
8. Roche AF, Sievogel RM, Chumlea WC, Webb P: Grading body fatness from limited anthropometric data. Am J Clin Nutr 1981, 34:2831-2838. 9. Eisenmann JC, Heelan KA, Welk GJ: Assessing body composition among
3-to 8-year-old children: anthropometry, BIA, and DXA. Obes Res 2004, 12:1633-1640.
10. Cole TJ: The LMS method for constructing normalized growth standards. Eur J Clin Nutr 1990, 44:45-60.
11. Kuczmarski RJ, Ogden CL, Guo SS, Grummer-Strawn LM, Flegal KM, Mei Z, Wei R, Curtin LR, Roche AF, Johnson CL: 2000 CDC Growth Charts for the United States: methods and development. Vital Health Stat 11 2002, 1-190.
12. Demerath EW, Schubert CM, Maynard LM, Sun SS, Chumlea WC, Pickoff A, Czerwinski SA, Towne B, Siervogel RM: Do changes in body mass index percentile reflect changes in body composition in children? Data from the Fels Longitudinal Study. Pediatrics 2006, 117:e487-495.
13. Lee K, Lee S, Kim SY, Kim SJ, Kim YJ: Percent body fat cutoff values for classifying overweight and obesity recommended by the International Obesity Task Force (IOTF) in Korean children. Asia Pac J Clin Nutr 2007, 16:649-655.
14. Schaefer F, Georgi M, Wuhl E, Scharer K: Body mass index and percentage fat mass in healthy German schoolchildren and adolescents. Int J Obes Relat Metab Disord 1998, 22:461-469.
doi:10.1186/1756-0500-4-301
Cite this article as: Federico et al.: Body mass index has a curvilinear relationship with the percentage of body fat among children. BMC Research Notes 2011 4:301.
Submit your next manuscript to BioMed Central and take full advantage of:
• Convenient online submission • Thorough peer review
• No space constraints or color figure charges • Immediate publication on acceptance
• Inclusion in PubMed, CAS, Scopus and Google Scholar • Research which is freely available for redistribution
Submit your manuscript at www.biomedcentral.com/submit
Federicoet al. BMC Research Notes 2011, 4:301 http://www.biomedcentral.com/1756-0500/4/301