UNIVERSITÀ DEGLI STUDI DI CATANIA
DOTTORATO DI RICERCA IN SCIENZE DELLE PRODUZIONI ANIMALI(XXIV Ciclo)
DIPARTIMENTO DI SCIENZE DELLE PRODUZIONI AGRARIE E AGROALIMENTARI
Doctoral thesis
Bernardo Valenti
Genetic polymorphism of αs1-casein.
Feeding strategies to optimize productive performances of dairy goat with different genotype.
Coordinator: Prof. Marcella Avondo Tutor: Prof. Marcella Avondo
3 Index
pp
1.1. Introduction……….. 6
1.2. Lactation curve………. 7
1.3. Goat milk composition……….……. 9
1.3.1. Carbohydrates………. 9
1.3.2. Lipids……….. 10
1.3.2.1. Biosynthesis of fatty acids……… 11
1.3.2.2. Rumen microflora and lipids metabolism………. 13
1.3.2.3. Effect of diet on fat synthesis and composition…………... 16
1.4. Proteins……….. 17
1.4.1. Genetic polymorphism of goat caseins……… 19
1.4.2. Genetic polymorphism of αs1-casein……… 21
1.4.3. Genetic polymorphism of αs1-casein and milk composition…… 22
1.4.4. Rumen metabolism and protein biosynthesis……….. 24
1.5. Aim of the work……… 27
2. Diet selection and milk production and composition in Girgentana goats with different s1-casein genotype……… 29
3. The role of polymorphism at s1-casein locus on milk fatty acid composition in Grigentana goat……….. 41
4. Effects of CSN1S1 genotype and its interaction with diet energy level on milk production and quality in Girgentana goats fed ad libitum……… 47
5. Polymorphism at αs1-casein locus. Effect of genotyoe x diet interaction on milk fatty acid composition in Girgentana goats……… 61
6. Effect of diet at different energy level on milk casein composition of Girgentana goats differing in CSN1S1 genotype………. 69
5
1
6 1.1 Introduction
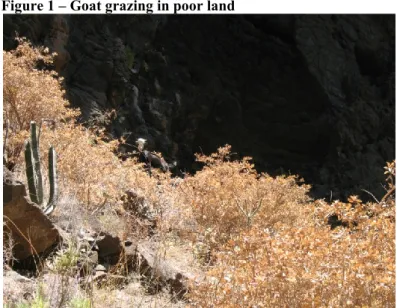
Breeding system of dairy small ruminants exhibits great diversity ranging from extensive to intensive. Extensive or semi-extensive farms are very often located in less favourable zones which are unfertile and hard to be reached. In these conditions, the use of local and well adapted breeds is of fundamental importance because they can be reared in marginal areas thanks to their capability to fully exploit also very poor lands (Figure 1). This aspect is
very important not only because allows animal breeding at relative low costs, but also because it avoids the abandon of these areas and preserves genetic variability. This aspect is of particular
interest in the
Mediterranean area where is concentrated about 25%
of the total goat milk production. Almost all the goat milk here produced is transformed into local cheeses, which can greatly differ also among proximal regions. Therefore goat breeding helps also to maintain traditions and typical products which could be lost because new global economy. The issue of protected labels for traditional products is having always increasing attention because it can represent an important economic source for local breeders. That is why in the last decades there has been a proliferation of ―labelled products‖ (PDO and PGI).
In the past before introduction of milk formulas, goat milk represented a valid substitution of mother‘s milk. In fact, thanks to the peculiar chemical composition (Table. 1) and physical characteristics, goat milk is more easily digestible than cow milk. In particular, its nutritional value is increased by the small size of fat globules and the richness in short- and medium chain fatty acids, while casein composition reduces its allergenic power.
7
From Bittante 2007
The management of the most important factors affecting milk composition represents the basis for the production of milk with the best attitudes in function of its productive destination of goat milk (transformation or drinking milk). A brief overview on goat milk constituents, and main factors affecting milk composition is given in the next sections.
1.2 Lactation curve
Milk yield and composition are not constant during lactation. In the past, the creation of a model able to describe the temporal evolution of milk production have been one of the most important challenge for mathematical modelling applied to animal science. Several equations (reviewed in Macciotta et al., 2008) have been developed to this aim. Wood equation (1) is the most used model to describe the curve of lactation.
e
at
t
y
b ct )
(
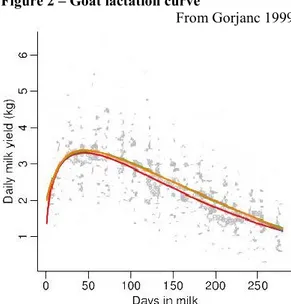
(1)In the pattern described by Wood model, milk production rapidly reaches a peak after which constantly decreases. Figure 2 describes lactation curves of several goats.
Though lactation is regulated by complex biological processes, only three parameters are presents in the equation; from one side this is an advantage because the few number of input makes the model very general, but on the other
Table 1 - Average chemical composition (%) of milk from different species
Water Fat Protein Lactose Ash Total solids Human 87.4 4.0 1.2 6.9 0.2 12.3 Cow 87.8 3.6 3.3 4.6 0.7 12.3 Buffalo 80.6 9.0 5.1 4.5 0.8 19.4 Sheep 83.7 5.3 5.5 4.6 0.9 16.3 Goat 87.9 3.8 3.5 4.1 0.8 12.2 Horse 89.0 1.6 2.7 6.1 0.5 11.0 Rabbit 73.6 12.2 10.4 1.8 2.0 26.4
Figure 2 – Goat lactation curve
8 side the same parameters must to be specifically estimated to fit the model for specific
breeds (Table 2). Parameters a, b and c can be useful used to predict important information such as the time when peak of lactation will be reached, the persistency of lactation and the milk yield at peak.
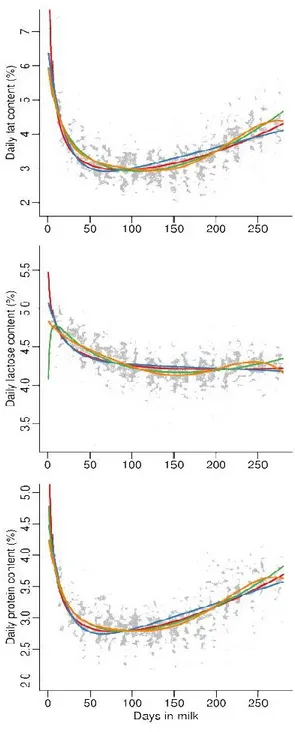
Figure 3 reports the pattern of fat, protein and lactose throughout lactation. It is evident how milk yield is negatively correlated to its quality. In particular, fat and protein contents are high in early lactation to rapidly fall until peak of lactation when they reach their minimum. After the peak of lactation, milk yield constantly decreases whereas fat and protein percentage raise. This ―dilution effect‖ respond to the equation (2)
ax
y
b
(2) where y is fat or protein yield, x is the milk yield, a and b are equation coefficients. In goat, value of a and b is about 0.95 for non selected breeds, while their value is about 0.83 and 0.87 for fat and protein, respectively, in highly selected breeds (Pulina et al., 2003). This means that the effect of dilution is stronger in breed such as Saanen and Alpine. Lactose shows aTable 2 – a, b, and c parameters of Wood function estimated in several goat breeds (Macciotta 2008)
Breed A B C Alpine, Saanen 2.316 0.230 -0.005 Derivata di Siria 1.388 0.163 -0.005 Murciano-Granadina 2.287 0.129 -0.029 Sarda 1.007 0.182 -0.007
Figure 3 - Fat, protein and lactose curves
9 different trend because it is transferred from blood to milk according to their osmotic pressure. Since osmotic pressure is more or less the same between the two biological fluid, lactose is secreted at the same rate as milk and is quite constant trough lactation.
1.3 Goat milk composition
Goat milk composition is not dissimilar from cow milk in terms of total fat, protein and lactose content. The main difference lies in the ―quality‖ of fat and protein. Indeed, they deeply differ for protein and fat composition. As compared to human milk, goat milk differs both for quantity and quality of constituents. In particular, goat milk is higher in protein whereas is lower in lactose content; moreover, protein composition greatly differs because human milk contains more whey protein than goat milk. Taken together, all these differences give cow, goat and human milk very different physical, chemical and nutritional characteristics.
1.3.1 Carbohydrates
Lactose represents almost the totality of the carbohydrates present in milk. This disaccharide derives from the condensation of galactose and glucose residues bound by a β-14 linkage (Figure 4). The two monosaccharides differ only for the arrangement of the -OH group in position 4.
Lactose is biosynthesized in mammary glands only during lactation. Out of lactation, galactosyltransferase, the enzyme responsible for the condensation of galactose and glucose, catalyzes the biosynthesis of glycoproteins containing galactose. During lactation, galactosyltransferase and α-lactoalbumin
(constituent of milk whey proteins) are bound together to form a complex called α-lactoalbumin-galactosyltransferase which is able to promote the biosynthesis of lactose (Larson and Smith, 1974). The role of the lactose in mammary gland is to maintain the osmotic equilibrium between blood and alveolar cells during milk
10 synthesis and secretion. Lactose provide the newborn with energy and with the
substrate to build up central nervous system.
Carbohydrates other than lactose can be found in milk under different forms (mono- and oligosaccharides, glycoproteins, glycolipids and nucleotide sugars).
1.3.2 Lipids
Goat milk contains about 3.8% of lipids. Mono-, di- and triglycerides, also called free lipids, represent 98% of total fat, while bound lipids (glyco-, phospho- and neutral lipids) account about 2% of total. Milk lipids are secreted from mammary epithelial cells as fat globules which are primarily composed of a globule of triglycerides surrounded by a lipid bilayer membrane (Figure 5) similar to the apical membrane of the epithelial cells. This membrane helps to stabilize the fat globules in an emulsion within the aqueous environment of milk (Danthine et al., 2000; Ye et al., 2000). Lipids can naturally or after centrifugation rise to the top resulting in a cream layer because a lower buoyant density than water. Cow milk needs to be homogenized to reduce globules size and avoid this phenomenon. Homogenization is not necessary in goat milk because the size of fat globules is naturally smaller (3.5 v. 4.5 micrometers) and then better dispersed (Fahmi et al., 1956). Smaller fat globules provide lipases with a greater surface area so that they can undergo an enhanced digestive action, resulting more easily digestible by humans, but at the same time, globules with smaller size are incorporated at slower rates during casein coagulation lowering cheese-making properties.
11 1.3.2.1 Biosynthesis of fatty acids
Triglycerides (Figure 6) are the most representative components of milk lipids. They are formed by the combination of glycerol with three molecules of fatty acid. The glycerol molecule has three hydroxyl (-OH) groups which form ester bonds with the carboxyl group (COOH) of three fatty acids, which are generally different among them.
Fatty acids are usually classified according to the length of chain and the number of unsaturated bonds. Fatty acids with a length from 4 to 16 atoms of carbons are called short- and medium chain fatty acids (SMCFA), long chain fatty acids (LCFA) have a carbons chain longer then 16, among them very long chain fatty acids (VLCFA) have
more than 22 atoms of carbons. Depending on the number of double bonds in the chain we can distinguish: saturated fatty acids (SFA), mono- (MUFA) and polyunsaturated (PUFA). In a triglyceride, the methyl end of the molecule is called ; unsaturated fatty acids are classified as a -3, -6 and -9 according to the distance between the first double bond and (Figure 6). Fatty acids belonging to -3 and -6 classes are defined essential because they cannot be synthesized by mammary glands, therefore they have a big importance on human health.
Origin of milk fatty acids is both endogenous and exogenous. Endogenous fatty acids are de novo biosynthesized in mammary gland by the progressive addiction of acetyl-CoA to volatile fatty acids (acetate and 3-hydroxybutyrate). The main enzymes involved in this process are acetyl-CoA carboxylase and fatty acid synthetase (FAS), which is responsible for the progressive elongation of fatty acids until a maximum length of 16 atoms of carbon. The presence of short- and medium-chain fatty acids (C4:0 to C16:0) in milk derives from an altered specificity of FAS; in ruminants this
12 enzyme exhibits a transacylase with both loading and releasing activity for acyl chains
with a length from two to 12 atoms of carbons (Chilliard et al., 2000). The process of elongation can involve not only volatile fatty acids, but also medium chain fatty acids which are uptaken from blood plasma and elongated until 16 atom of carbons. Though palmitic acids (C16:0) is synthesized in the mammary gland, half of C16:0 is of dietary origin. Enzymatic pool of mammary glands is not able to convert C16:0 to C18:0 and the regulation of elongation process at cellular level have yet to be identified. Because of the pathway for biosynthesis, acyl chain is typically linear and with an even number of carbon atoms.
Goat milk fat is rich in medium chain triglycerides. Caproic (C6:0), caprylic (C8:0) and capric acid (C10:0) are so called because preferentially found in goat milk, where they account up to 20% of total fatty acids (Park et al., 2007) and give the typical ―goaty‖ flavour to the milk. Haenlein (2004) reviewing the importance of goat milk in human nutrition, described the importance of MCFA as medical treatments for a wide range of clinical disorders. For example, thanks to the digestive process, different from that used for long chain fatty acids, MCFA can be absorbed and reach the liver and the tissues without any reesterification or storage in adipose tissues. Therefore, goat milk, in comparison to the more consumed cow milk, represents a valid source of direct energy. MCFA are de novo synthesized, therefore they are not greatly affect by diet and some of them are synthesized at certain fixed relative rates. In particular, C12:0 (lauric acid) to C10:0 ratio is quite constant in goat milk and it has been used to detect the addiction of cow milk into goat milk. Also C4:0 and C6:0 are either unchanged by diet or lipid mobilization because they are partially synthesized by a metabolic pathway not dependent on acetyl-CoA carboxylase (Palmquist et al., 1980).
Fatty acids of exogenous origin represent up to 60% of milk fat. They are not synthesized by mammary, but arise from preformed fatty acids that can be found in blood plasma under form of lipoproteins and non-esterified fatty acids after digestion and gut absorption or as a consequence of mobilization of body lipid reserves. Lipoprotein lipase allows the hydrolysis of glycerides which became available for uptake by mammary gland and to be included in fat globules. Long chain and odd- and branched chain fatty (OBCFA) acids are typically of exogenous origin, deriving from
13 forages or supplements given to the animal and from metabolism of bacteria living in
the rumen, respectively. That is why a huge amount of literature is available on the effect of diet on goat and ruminants milk fatty acid composition (Sanz-Sampelayo et al., 2007; Chilliard etl., 2004 and 2007).
1.3.2.2 Rumen microflora and lipids metabolism
Fat of animal origin is, generally, a concern for customers because it is rich in saturated fatty acids which are responsible for the onset of cardiovascular diseases, whereas PUFA are considered to be protective for human health. For these reasons, on 1994, Department of Health of United Kingdom indicated ideal values for PUFA:SFA and -6:-3 ratios (≥0.45 and ≤ 4, respectively), referring these values not to the single foods but to the dietary regimen (Department of Health UK, 1994). However, concerns for SFA and healthy properties for PUFA should be reconsidered taking into account that among saturated fatty acids only C12-C16 are thought to have atherogenic effect when consumed in excessive amounts (Knopp and Retzlaf 2004), that stearic acid (C18:0) is not atherogenic (Dabadie et al., 2005) and that some trans- isomers of linoleic acid (C18:2) are suspected to be very harmful. The control of fat composition has been a challenge for animal food scientists and still is. About half of milk fatty acids arise from diet (PUFA above all), therefore it is easily understandable how greatly the diet can affect milk fatty acid composition.
An enormous number of study have been carried out in order to make animal diets able to provide PUFA to be transferred into milk. Unfortunately, not all the dietary PUFA arrive unchanged to milk. Polyunsaturated fatty acids present in animal feeding (forages, cereals and oil seeds), are toxic for bacteria living in the rumen. Immediately after their ingestion, they are massively (from 60 to 90%) transformed to stearic acid (C18:0) by cellulolytic rumen microflora with the aim to detoxify them. The process of detoxification is called biohydrogenation because PUFA with a cis-12 double bond, are progressively saturated to C18:0 by the addiction of hydrogen atoms (Figure 7). The first step of biohydrogenation is the isomerization of the cis-12 double bond to trans-11position. Non-esterified linoleic (cis-9, cis-12 C18:2) and α-linolenic acid (cis-9, cis-12, cis-15 C18:3) are the main substrates of this microbial isomerase
14 because it can act only on cis-12 unsaturated fatty acids with free carboxylic function.
After isomerization, cis-9 bond is hydrogenated by a microbial reductase; eventually, also double bond in trans-11 position is reduced to stearic acid.
Figure 7 – Biohydrogenation process
The main effect of biohydrogenation is to worsen milk fat quality by the increase of the proportion of unhealthy fatty acids, indeed it is responsible for the greater percentage of SFA regardless the level of unsaturated fatty acids of the diet provided to the animals. Nevertheless, during the first step, when linoleic acid is the target of biohydrogenation, an intermediate (cis-9, trans-11conjugatetd linoleic acid (CLA)) with positive effect on human health is produced. As well as all the other intermediates of biohydrogenation, CLA can escape the rumen before undergoing the complete saturation and be transferred to the milk. Since 1979 when its beneficial properties have been discovered in meat juice (Pariza et al., 1979), an increasing number of publications demonstrated the role of CLA in the prevention of certain forms of cancer and on 1996, it was defined as <<the only fatty acid shown unequivocally to inhibit carcinegenesis in experimental animals>> in the report on ―Carcinogenes in the Human Diet‖. CLA can inhibit cancer development at different stages (McGuire and McGuire, 2000), but can also reduce cholesterol level in blood (Lee et al., 1994) and prevent diabetes (Houseknecht et al., 1998; Chin et al., 1994). It is unlikely that only one molecule is responsible for all the biological activities, indeed
15 CLA is not just a single molecule, but it is a series of isomers among which, cis-9,
trans-11-CLA is the most represented (Pariza et al., 2000) and the only whose activity has been demonstrated; however it is supposable that individual isomers have specific effects.
Rumen biohydrogenation does not represent the only way to produce CLA. In the reality, the quantity of milk CLA arising from rumen is smaller as compared to that arising from tissues. Several works demonstrated a linear relation between concentrations of trans-11 C18:1 isomer and cis-9, trans-11 CLA concentrations in milk fat across a wide range of diets (Baumann et al., 1999). On the basis of these findings, Griinari et al. (1997) suggested that a portion of CLA was of endogenous synthesis. The mammary gland is the site of endogenous synthesis of cis-9, trans-11 CLA for lactating ruminants. In the udder the action of 9-desaturase enzyme introduces a cis-double bond between carbons 9 and 10 of fatty acids. Even if stearoyl-CoA and palmitoyl-stearoyl-CoA are the major substrates for 9-desaturase, a wide range of saturated and unsaturated acyl CoA can serve as substrates, including trans-11 octadecenoic acid (Enoch et al., 1976; Mahfouz et al., 1980, Pollard et al., 1980). Trans-11 octadecenoic acid escaped biohydrogenation is converted to CLA in the udder providing about 70% of milk CLA.
Rumen microflora metabolism is also responsible for the presence of odd and branched chain fatty acids in ruminants milk. OBCFA are constituents of bacterial membranes (Kaneda, 1991; Mackie et al., 1991) and include: iso tetradecanoic acid (iso C14:0), pentadecanoic acid (C15:0), 13-methyltetradecanoic acid (iso C15:0), 12-methyltetradecanoic acid (anteiso C15:0), iso hexadecanoic acid (iso C16:0), heptadecanoic acid (C17:0), 15-methylhexadecanoic acid (iso C17:0), 14-methylhexadecanoic acid (anteiso C17:0). Linear odd-chain fatty acids are formed when propionyl-CoA, instead of acetyl-CoA, is used as primer, while branched chain fatty acids are formed by the elongation of isobutiryl-CoA or 2-methylbutiryl-CoA (Kaneda, 1991). Together with SMCFA, they are responsible for the sharp and persistent odor of goat milk. However, the interest in OBCFA arise from their anticarcinogenic effects on cancer cells (Wongtangtintharn et al., 2004) comparable to that of conjugated linoleic acid.
16 1.3.2.3 Effect of diet on fat synthesis and composition
Milk composition of ruminants is function of intrinsic and extrinsic factors. Though important, intrinsic factors such as breed, genotype, pregnancy etc., can give their effect over long terms, while extrinsic factors, mainly diet, largely affect milk production and composition in the short period.
Forage to concentrate ratio is one of the most important factors affecting milk yield and composition as well as the nature of concentrate. Rumen microflora of grazing goats is mainly represented by cellulolytic bacteria which produce acetic and butyric acid as a result of their metabolism. In certain periods, when grazing is not enough to cover energy requirements of lactating animals, it is necessary to supplement them with concentrate. In principle, providing concentrates that are rich in nonstructural carbohydrates, a higher proportion of concentrate in the diet and smaller-sized particles of fiber or fiber given in pelleted form, represent circumstances that cause a decreasing of cellulolytic in favor of amylolytic rumen microflora with a reduction in the formation of acetate and butyrate. Being these latter volatile fatty acids the main precursors of the fatty acids synthesized in the mammary gland, the animal‘s milk will have a lower fat content (Sutton, 1976). In addiction, propionic acid produced by amylolytic bacteria is precursor of glucose, which is transformed in to fat in the liver and stored in the adipose tissue causing a further depression of milk and fat secretion. The changes in the rumen microflora lead also to the production of specific (such as trans10-C18:1 or trans-10, cis-12 CLA) (Antongiovanni et al., 2004), and this could contribute to a decrease in milk fat yield and content (Griinari and Bauman, 2003). However, in general, no significant effect are observed when concentrate proportion does not exceed 50%, while negative effects are observed when concentrate represents more than 60% of diet.
As regrads goats, it seems that they are more sensitive to the energy intake than to forage:concetrate ratio (Mowlem et al., 1985). Indeed, when goats are provided a diet which in cows causes the so-called low-fat milk syndrome, the changing in milk fat content is negligible. Sauvant et al. (1987) found that the energy status of the animals is more important than the relative proportion of the diet constituents even when forage:concentrate ratio exceeds 20:80. Similar results were achieved by Schmidely et
17 al. (1999), who, after feeding goats with concentrates differing in the nature of
carbohydrates, concluded that milk fat and protein concentrations were more affected by the animal energy balance. These results were confirmed by Mele et al. (2005), who found no changes in milk yield and fat content comparing high-concentrate vs low-concentrate diet at similar energy level, and by Chilliard et al. (2006a) who found a significant increase of milk and fat yield after an increase of energy level of diet. The influence of energy status of the goat on the quantity and composition of milk produced could depend on the fact that as compared to cows, ruminal turnover is faster in small ruminants so that they have less time to digest dietary constituents which would require longer time. This minor efficiency of ruminal digestion causes a less availability of energy deriving from volatile fatty acids produced in the rumen that can be compensated by goat only when they are in a good status of energy. Indeed when energy intake is kept constant and cover energy requirements of goats, goat milk fat secretion seems to be more dependent on the nature of forage (Rouel et al., 2000). Even if goat are less sensitive to the forage:concentrate ratio than other ruminants, a high proportion of concentrate in the diet of goats cannot be a rule, but have to be used with care and when it is strictly necessary. The consumption of rapidly fermentable carbohydrates contemporary to a deficiency of fiber in the diet, could lead to the phenomenon of fat-protein inversion. In these conditions, goats produce a milk in which protein is greater than fat percentage. This situation is typical of the Mediterranean area, where especially in summer, the availability of green vegetation is scarce and goat are supplemented with concentrate to cover energy requirements.
1.4 Proteins
The average protein content in goat milk is about 3.5%, however this percentage can widely vary, also within species, according to several factors such as breed, stage of lactation, genetic polymorphism, feeding etc.
The principal proteins of goat milk are α-lactalbumin (α-Lac), β-lactoglobulin (β-Lg), immunoglobulins (Ig), lactoferrin (Lf), αs1-casein (αs1-CN), αs2-casein (αs2-CN), κ-casein (κ-CN) and β-κ-casein (β-CN) and other minor proteins and ezymes. They can be subdivided in whey protein (α-La, β-Lg, Ig, Lf), so called because they remain in the
18 serum after the precipitation of the caseins (αs1-CN, αs2-CN, κ-CN, β-CN). In milk it is
also present a non-protein nitrogen (NPN) component which includes ammonia, urea, creatinine, creatin and uric acid. Though goat milk protein components are the same of cow and sheep milk, goat milk results in lower renneting properties. This is due to the higher percentage of NPN (5% vs 9% for cow and goat, respectively) and a less level of casein nitrogen (73% vs 78% for cow and goat, respectively) (Guo, 2003).
Whey proteins represent a consistent proportion (~20%) of total nitrogen in goat milk. Nevertheless, the interest of research is mainly focused on the casein component because it represents the biggest part of milk protein (~80%), but also because goat caseins show a complex qualitative and quantitative variability resulting from several genetic polymorphisms and post-translational modifications that causes important effects on quality, composition and cheese making properties of goat milk.
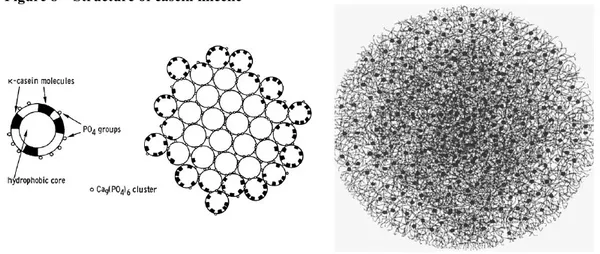
Figure 8 – Structure of casein micelle
The αs1-, αs2-, and β-caseins are called calcium sensitive because they are precipitated by calcium binding to their phosphoserine residues. Differently from calcium sensitive caseins, κ-casein is the only soluble in calcium, but also interacts with the other caseins to form stable colloidal particles named micelle. About 95% of caseins are organized in micelles. For many years the most accepted theory of the structure of the casein micelle (Holt et al., 1992) described them as a spherical aggregates of the caseins (submicelles) held together by calcium–phosphate linkages (Figure 8). A major debate in the early studies of casein micelles was the whereabouts of the colloid stabilizing protein, casein. It has been generally accepted that the majority of the κ-casein must reside on the surface of the κ-casein micelles and that the other κ-caseins
19 might also occur there as well, while the inner centre of the micelles and submicelles
is virtually free of κ-casein. Hydrophilic C-terminal region of κ-casein is thought to forming a layer similar to ―hair‖ responsible for the stabilization of casein micelles called glycomacropeptides (GMP). Indeed the removing of this layer by hydrolysis causes precipitation and coagulation of casein micelles.
In recent years the classical theory on the micelle structure has been challenged by concepts arising from the study of the casein–calcium–phosphate interactions, the micelles themselves and physical chemical studies of the individual proteins at interfaces. However, the emerging theories agrees with the role of calcium–phosphate and κ-casein (Horne, 1998; De Kruif and Holt, 2003). The description of the new models lies outside the aim of this manuscript.
The micelle structure of goat milk differs from that of cow milk being the diameter of goat micelle higher than in cow milk and this leads to worse renneting properties.
1.4.1 Genetic polymorphism of goat caseins
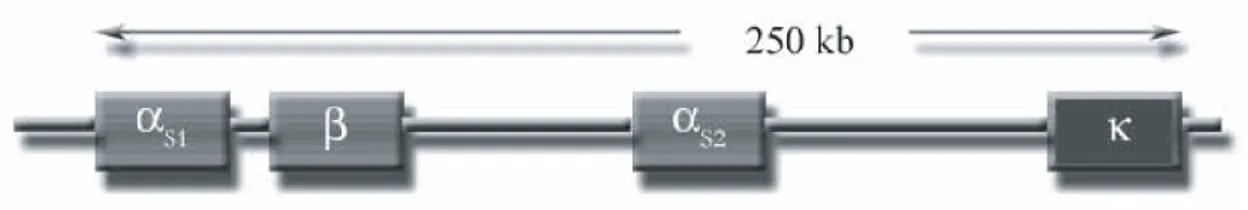
In goats, as in cattle, casein genes are organized as a cluster (Figure 9 ), as first reported by Grosclaude et al. (1978). In order, αs1-casein, β-casein, αs2-casein, and κ-casein (Ferretti et al., 1990; Threadgill and Womack, 1990; Rijnkels et al., 1997) span 250 kb on the chromosome 6.
Figure 9 – Structure of the casein genes
The presence of each casein fraction in milk is genetically determined by co-dominant alleles. Several allelic variants associated to normal, intermediate or null content of the relative protein in milk have been reported for each casein fraction. Differences in primary structure arise from single nucleotide polymorphism, insertion/deletion and differential splicing patterns. These modification can directly affect several characteristic of the active form of the protein such as electric charge, size, shape,
20 hydrophobic properties or can influence the sequence of the promoter or the stop
codon reducing or enhancing transcription rate of the gene. Similarly to all the other proteins, caseins undergo post-translation modifications, such us phosphorylation and glycosylation, which increase caseins heterogeneity in milk.
The β-CN is the most abundant casein fraction representing up to 50% of total caseins. Two main phosphorylation levels (5 and 6P) occur with comparable relative concentration, but also 3 and 4P have been reported. It has been considered to be monomorphic for long time. However, up to date five variants have been reported for β-CN. Three of them A, B (Mahe´ and Grosclaude, 1993) and C (Neveu et al., 2002) associated with a normal β-casein content in milk, with the last two allele differing for a single amino acid substitution (Ala177 Val177) from the A variant. Furthermore, two null alleles (0 and 0‘) have been identified, both characterized by mutations responsible for premature stop codons in exon 7 (Ramunno et al., 1995) probably responsible for non-functional messengers and for the absence of β -casein in milk (Martin and Addeo, 1995).
Caprine κ-CN represents about 15% of total casein. Differently from the calcium sensitive caseins, it is glycosylated, hydrophilic and shows a lower degree of phosphorylation. The first two variants of caprine κ-casein were identified by isoelectrofocusing (Di Luccia et al., 1990) and successively confirmed both at the protein and DNA level by Caroli et al. (2001). So far, a total of 13 polymorphic sites were identified in the domestic goat (Jann et al., 2004), allowing the identification of 14 alleles corresponding to 11 protein variants. All these variants can be associated to two level of production. Variants of group A with isoelectric point of 5.29 (A, B, B‘, B‘‘, C, C‘, F G, H, I, L) are associated with a higher presence in milk as compared to group B (D, E, K, M) which has isoelectric point equal to 5.66.
The αs2-CN represents about 10% of total caseins, and is the only casein fraction which present cistein-cistein bond along the polypeptidic chain. At least eight alleles have been identified (A, B, C, D, E, F G, 0) at αs2-CN locus. All the variants, except D and 0 (Ramunno et al., 2001) are associated to normal level of protein synthesis.
21 Variants A, B, C variants differ by single aminoacid substitution (Martin and
Addeo,1995). At least four phosphorylation levels of αs2-CN are detectable in milk.. Moreover, thought goat milk is generally considered to have low allergenic power, the amount of αs2-CN was associated with allergenic properties. In particular, variants A, B, C, E and F showed higher allergenic potency, as compared to D and 0 (Marletta et al., 2004).
Among casein polymorphisms, polymorphism at αs1-casein locus is of particular interest and deserves to be discussed apart.
1.4.2 Genetic polymorphism of αs1-casein and milk composition
In the goat species, αs1-casein locus is characterized by the most extensive and investigated polymorphism. In the last decades several studies have been carried out to individuate the allelic variants and their relation to goat milk composition and technological properties. The αs1-casein locus spreads a transcriptional unit of 16.7 kb and consists of 19 exons. So far, at least 18 different alleles (for review see Neveu et al., 2002 and Moioli et al., 2007) have been found at this locus (Figure ). All the variants can be subdivided into four categories (strong, intermediate, weak and null) as a function of the quantity of αs1-CN in milk.
Among strong alleles (A, B1, B2, B3, B4, B', C, H, L and M), B1 contains 199 amino acids residues and is the closest to the bovine and ovine homologous and it is considered as the original one in the goat species; therefore its productive level (3.6 g/L per allele) is taken as the ―normal‖ reference level. The primary structure of the other strong variants contains 199 residues, but differs from B1 for amino acid substitutions by single point mutations. Only M variants does not depend on amino acid substitution, but on the substitution and loss of phosphate group from allele A. Intermediate alleles (E and I) produce about 1.1 g/L each. E variant shares structure with B4, but it has a reduce protein synthesis due to the insertion of a 458 bp sequence in position 124. I variant shares structure with A variant and at the moment no
22 information is available on the factors responsible for the lower content of αs1-CN in
milk.
Weak alleles (D, F, G) contribute with 0.45 g/l of αs1-casein per allele. F variant shows a deletion of 37 amino acid residues arising from an outsplicing of exons 9, 10 and 11 probably due to a single base deletion occurring in the first unspliced exon (exon 9) [15]. In G variant shows a deletion of 13 amino acid residues generated by an exon-skipping event (exon 4) triggered by the GA transition at the first position in the intron 4 donor splice site [18]. The consequence is the loss of the hydrophobic sequence in the N-terminal part of the protein.
Null alleles (01, 02 and N) have been also found and are responsible for the apparent absence of this fraction in milk. Null allele 01 is characterized by a large deletion of about 8.5 kb starting from the place 181, while 02 is made by a large uncharacterized insertion. The N variant is characterized by the deletion of cytosine at the 23th nucletoide of exon 9 resulting in a premature stop codon at 12th exon.
Enne et al., 1997 in a study on the gene frequencies of the different variants at αs1-casein locus found that null alleles tend were predominant in Northern Italy breeds, while strong alleles were found at the highest frequency in breeds of Southern Italy, lastly breeds intermediate alleles were present in larger extent in Alpine and Saanen breed
1.4.3 Polymorphism at αs1-casein locus on milk characteristics
The genetic polymorphism of αs1-casein causes a big range of variation (0-30%) in the presence of this protein in goat milk, moreover several works found that strong genotypes at this locus are associated with higher total protein and casein content in goat milk. If the direct effect on protein and casein content is obvious, less evidences are available to clarify whether have some direct effects also on the biosynthesis of the other caseins.
Ambrosoli et al. (1988) in a study on the correlation between polymorphism at αs1-casein and milk components, found that milks with high levels of αs1-CN had higher
23 total solids, phosphorus and lower pH than milks with low levels of αs1-CN, moreover
size of casein micelles were smaller in milk obtained from goat carrying strong alleles (Remeuf et al. 1993). Taken all together, these characteristics improve cheese-making properties of milk. Indeed, Clarck and Sherbon (2000) founds that coagulation time (the point at which coagulation is first notable) and coagulation rate (measure of how quickly the curd firms once coagulation has begun) were respectively shorter and higher in milk from goat with strong alleles. However, cheese organoleptic features are negatively correlated to the presence of αs1-CN in milk. It has been shown that lipolysis, one of the processes involved in the formation o flavour, is reduce in high protein milk. A surprisingly relation have been found between the genotype at αs1-CN locus and the biosynthesis of fat. Results published by Barbieri et al. (1995) suggest that fat content is higher in milk from goat with strong alleles as compared to milk from goat with deficient αs1-casein biosynthesis, while milk yield seems to be unaffected by this factor (Chilliard et al., 2006).
It is likely that perturbations occur during secretion of milk components. In the reality, recently, Ollier et al. (2008) demonstrated that weak variants at αs1-casein locus negatively affect gene expression of GPAM and FAS, which are two important genes implicated in the first step of triacylglycerols biosynthesis (Coleman et al., 2000) and in the endogenous biosynthesis of short and medium chain fatty acids (Smith, 1994) respectively. Moreover, at cellular level, Chanat et al. (1999) observed that in the mammary epithelial cells the rate of transport to the Golgi apparatus of caseins other than αs1-casein was strongly reduced in goats carrying defective alleles. As a consequence of the accumulation of immature proteins and caseins, the endoplasmatic reticulm of weak genotype animals was remarkably enlarged in comparison to strong genotype goats, while the endoplasmatic reticulum of goats with intermediate alleles was only moderately distended. From one side this could explain the lower biosynthesis rate of caseins, but at the same time this dysfunction could disturbs the whole secretion process, including that of lipids as hypothesized by Neveu et al (2002).
24
In the main part of Europe, farmers have the interest in the selection of goat with high content of casein in order to increase the economical profits by rising cheese yield. Nevertheless, the breeding of goats carrying weak or null alleles could be justifiable if the aim is the production of goat milk to be used as a substitute of human milk. Indeed, compared to cow milk, goat milk CN is more similar to human milk and can contain only traces of the allergenic αs1-casein resulting less allergenic. Indeed, in trial
on pigs, Bevilacqua et al. (2000) found a 40% reduction in the allergic reaction when pigs were fed with milk deficient in αs1-casein, concluding that goat milk with low or null content of as1 casein is less allergenic than other goat milk. Moreover both the smaller quantity of protein and fat could result in a more digestible food for humans
(Ambrosoli et al., 1988).
1.4.4 Rumen metabolism and protein biosynthesis
Differently from milk fat, which can partially derive from ingested diet, milk protein are entirely synthesized in the mammary gland. However, also in this case rumen metabolism plays a major role. Indeed milk protein synthesis depends on amino acids taken up by the mammary gland and the amount of these amino acids depends on the amounts of microbial cells and by-pass protein deriving from the rumen.
Ruminant tissues require the same amino acids as most simple stomached animals; however, ruminants can survive on non-protein diets that are virtually free of amino acids. The absence of an absolute requirement for dietary amino acids does not lies in the fact that ruminants are able to de novo synthesize amino acids, but in the ability of microflora to do that. Indeed even when the diet contains little non protein nitrogen, 50 to 80% of the N reaching the small intestine is likely to be of microbial origin (Hogan et al., 1975).
Rumen microflora need a source of dietary nitrogen and of carbohydrates to build up amino acids. The proportion in which these nutrients are given to the animal and their characteristics greatly affect the rate of microbial protein biosynthesis. If the energy is limited, microorganisms degrade feed protein to ammonia to produce energy, but they cannot uptake the ammonia to build new amino acid and protein (Nocek and Russel, 1988). The ammonia escaped the rumen is not included in microbial cells (Nolan et
25 al., 1975), but is detoxified in the kidney and in the liver loss under form of urea in
milk and urine. Milk urea is then considered a good indicator of the efficiency of the utilization of dietary nitrogen.
Quantity and quality of dietary nitrogen and carbohydrates source have to be chosen also bearing in mind productive requirements of the animals. In this sense, goats with different genetic aptitude to produce milk protein could use dietary nutrients in different ways or could have different productive requirements. Investigating this aspect, Schmidely et al. (2002) found differences in the utilization of dietary protein, calcium and phosphorus provided to the goats carrying different alleles (strong vs weak) at αs1-casein.
27 1.5 Aim of the work
In the previous sections an overview on milk composition and on the principal factors which influence the level of the different constituents of milk has been given. Among them particular interest have been focused on the effects of diet and αs1-casein genetic polymorphism; in the biggest part of the published researches made in order to assess the effect of these two factors on milk composition they are discussed separately. Besides to cover a lack of scientific knowledge on this topic, we think that to study the effect of interaction between dietary and genetic factors on milking performances can be of great utility for the development of new feeding strategies for dairy goat. Indeed, the design of specific diets based on the productive potential also for dairy goats can be an economical advantage for the farmers and can reduce the environmental impact of animal breeding.
Therefore, the aim of this study was to investigate the impact of different feeding practices on the performances of dairy goats differing in genotype at αs1-casein locus. Specifically, we investigated:
whether a different genetic aptitude for producing casein can affect diet selection and milk composition in lactating goats, by making available to them feeds with differing chemical nutritive;
how goats, selected according to different αs1-casein genotype, could reply to diets with different energy levels at similar protein content;
the effect of the diet, genotype and diet × genotype interaction on milk fatty acid and casein composition.
29
2
Diet selection and milk production and
composition in Girgentana goats with
different as1-casein genotype
Avondo M., Pagano R.I., Guastella A.M., Criscione A., Di Gloria M., Valenti B., Piccione G., Pennsisi P. (2009). Diet selection and milk production and composition in Girgentana goats with different s1-casein genotype. Journal of Dairy Research. 76:202-209.
30 Abstract
In goats, as1-casein polymorphism is related to different rates of protein synthesis. Two genetic variants, A and F, have been identified as strong and weak alleles based on a production of 3.5 and 0.45 g/l of as1-casein per allele. The aim of the trial was to test whether goats can select their diet as a function of their genetic aptitude to produce milk at different casein levels and whether this selection can influence milk production or composition. Two groups of 8 animals, homozygous for strong (AA) or weak (FF) alleles were housed in individual pens. Using a manger subdivided into five separate containers, the goats were offered daily for 3 weeks: 1.5 kg of alfalfa pelleted hay, 0.7 kg of whole barley, 0.7 kg of whole maize, 0.7 kg of whole faba bean and 0.7 kg of pelleted sunflower cake. Total dry matter intake was similar between groups and resulted in nutrient inputs much higher than requirements. On average, goats selected 86% of maize plus barley and only 46% of faba bean plus sunflower. Indeed, AA goats selected less faba bean compared with FF goats (37.2 v. 56 . 7% of the available amount; P=0.01); during week 2 and week 3 they significantly increased maize selection (respectively for week 2 and week 3: 94.9 and 99.1% v. 85 . 3 and 87.3%) thus increasing the ratio between the highenergy feeds and the high-protein feeds (2.41 v. 1.81, P=0.023). As for true protein, the high soluble fraction (B1) and the indigestible fraction (C) were lower in the diet selected by AA goats (respectively in AA and FF groups: B1, 7.85 v. 9.23% CP, P<0.01; C, 6.07 v. 6.30% CP, P<0.001); these diet characteristics can be associated with lower losses of protein. Milk production, being similar in AA and FF groups when goats were fed with a mixed diet, significantly increased in AA group, when free-choice feeding was given (mean productions: 1198 v. 800 g/d, P<0.01). Casein content was higher in AA group than in FF group (2.70 v. 2.40%, P<0.01) whereas milk urea was higher in FF group (59.7 v. 48 . 8 mg/dl, P<0.01). In conclusion, when the animals were free to select their diet, their higher genetic aptitude to produce casein seemed to adjust their energy and protein dietary input in qualitative terms, thus leading to an increase in milk production and a decrease in milk urea. These results seem to demonstrate that interactions probably occurred between genetic polymorphism at the as1-casein locus, diet selection and the efficiency of nutrient transformation into milk.
31 Introduction
The genotype of individuals greatly affects the milk concentration of casein: goats with strong (AA) and weak (FF) genetic profiles will produce milk with as1-casein content of around 7 g/l and 0.9 g/l respectively (Martin et al. 1999). Milk protein synthesis depends on amino acids taken up by the mammary gland. The amount of amino acids available for this synthesis depends on the amounts of microbial cells and by-pass protein deriving from the rumen. There should be a link between the genotype that determines different casein levels in milk and the efficiency of use of the available nutrients. Very few studies have been conducted on the interactions between polymorphism at the alpha-s1 casein locus and nutrition. De la Torre et al. (2008) report that a greater efficiency in nitrose and energy utilization of goats with strong alleles v. weak alleles may explain the differences in milk composition between the two genetic groups. Moreover, this efficiency is strongly influenced by the characteristics of the diet. It has been demonstrated that food preferences can depend on physiological state (Kyriazakis et al. 1999; Villalba & Provenza, 1999). Studies on goats highlighted that lactation stage affects feed selection in extensive (Mellado et al. 2005) and intensive feeding systems (Fedele et al. 2002). It seems that ruminants are able to relate the sensory properties of a feed to the post-ingestive feedback signals learned from experience (Provenza et al. 1995). In particular, different studies have shown that foods that meet requirements for energy and nitrogen are preferred (Villalba & Provenza, 1997a, b). The aim of this research was to assess whether a different genetic aptitude for producing casein can affect diet selection and milk composition in lactating goats, by making available to them feeds with differing chemicalnutritive characteristics.
Materials and Methods
Animals and feeding management
Sixteen Girgentana goats (3rd and 4th lactation), homogeneous for milk production (0.8±0.1 kg/d), days of lactation (110±15 d) and body weight (37.6±5.1 kg) were selected from a flock of 120 goats deriving from three farms located in different areas of Sicily. Animals were divided into two groups, eight homozygous for strong (AA) and eight homozygous for weak (FF) alleles, as characterized by isoelectric focusing
32 (IEF) in ultrathin polyacrylamide gels according to Erhardt et al. (1998) and allele
specific-polymerase chain reactions (AS-PCR) at the CSN1S1 locus for the strong A and weak F alleles according to Leroux et al. (1992). Moreover, the absence of null allele at as2- and b-casein loci was ascertained with PCR-RFLP (Ramunno et al. 2001) and AS-PCR (Rando et al. 1996) reactions, respectively. Prior to starting the study and during the trials the health status was evaluated based on behaviour, rectal temperature, heart rate, quality of respiration, cough, nasal discharge, eye discharge, faecal consistency, haematological and haematochemical profiles, and somatic cells count (SCC). All the animals were housed in individual pens with mangers subdivided into five separate containers. Goats were offered alfalfa pelleted hay, two sources of starch (whole barley and whole maize) and two sources of protein (whole faba bean and pelleted sunflower cake). In each pen water and salt were always available. The preexperimental period consisted of a 7-d period, during which the animals received a mixed ration of 1.5 kg of hay and 0.2 kg of each concentrate; a 10-d period during which goats received, separately, 1.5 kg of hay and a quantity of each concentrate gradually increasing from 0.2 to 0.7 kg. Taking into account that intakes tended to increase for each increment of concentrates supplied, we did not increase further the amount supplied, to avoid risks of metabolic diseases. The adaptation period lasted 7 d during which the animals received the experimental diet consisting of 1.5 kg of hay and 0.7 kg for each concentrate feed. The experimental period lasted 3 weeks (5–26 May).
Table 1 - Chemical composition of the available feeds.
Feeds Alfalfa hay Barley Maize Faba Bean Sunflawer cake Dry Matter % 93.3 89.6 86.4 86.1 89.4 Crude Protein, %DM 15.0 10.9 9.2 27.0 31.9 Neutral detergent fibre % DM 52.6 22.8 11.4 20.4 44.3 Acid detergent fibre % DM 35.1 6.4 2.1 14.1 31.3 Water-soluble carbohydrates % DM 7.1 2.5 1.5 4.7 4.0 Starch 1.9 49.0 65.2 46.8 0.7 Protein Franctions % CP A 28.2 6.5 11.4 15.6 22.3 B1 2.2 11.2 5.7 23.8 7.1 B2 37.1 55.9 60.9 43.7 48.4 B3 24.5 22.5 14.3 12.2 16.0 C 8.0 3.9 7.7 4.7 6.2
33 Data collection and analysis
Individual intake of each feed was measured daily, on the basis of residuals. Every three days individual milk production was recorded and milk samples were individually collected from the morning and evening milking. Three samples for each feed were analysed for dry matter (DM), crude protein (CP) (AOAC, 1990), structural carbohydrates (Van Soest et al. 1991), water-soluble carbohydrates (WSC) by a modified anthrone method (Deriaz, 1961), starch by an enzymic procedure (Megazyme International Ireland Ltd., Bray, Co. Wicklow), protein fractions according to Licitra et al. (1996).
Milk samples, consisting of proportional volumes of morning and evening milk, were analysed for lactose, fat, protein and SCC by an infrared method (Combi-foss 6000, Foss Electric, Hillerød, Denmark). Total nitrose (TN), non-protein nitrogen (NPN) and non-casein nitrose (NCN) were determined by FIL-IDF standard procedures (1964). From these nitrogen fractions, total protein (TN*6.38) and casein [(TN–(NCN*0.994))*6.38] were calculated. Milk urea content was determined using a differential pH meter (CL10, Eurochem, Savona, Italy).
Blood samples were collected, from all subjects, every three days before feeding, by jugular venipuncture, using vacutainer tubes (Terumo Corporation, Tokyo, Japan) with K3-EDTA. Blood samples were clotted at room temperature for 1 h and centrifuged at 1360 g for 10 min; sera were separated and stored at –20 8C until analysed. Sera were analysed with commercially available kits by means of a u.v. spectrophotometer (model Slim SEAC, Firenze, Italy). Serum concentrations of the following parameters were determined: albumin, total protein, total cholesterol, bilirubin, urea, glucose, NEFA, triglycerides, glutamate oxalacetate transaminases (GOT) and glutamate pyruvate transaminases (GPT).
Statistical analysis
Pre-experimental data for DM intake, milk production and composition were analysed using a one-way ANOVA. Individual data for intake, diet selection, diet composition, milk production and composition, and blood parameters were analysed using the GLM procedure for repeated measures of SPSS (SPSS for Windows, SPSS Inc., Chicago IL, USA). Milk production (means of the 3 weeks) was used as a covariate in fat, protein,
34 lactose, casein and urea analysis. As covariance was never significant (P>0.05) it was
not included in the statistical model. Results
The health status of goats, checked during the trial, was good: no clinical or subclinical signs of disease were observed. Values of rectal temperature, heart rate, respiratory rate, digestive function and SCC were within the normal range. The haematochemical trends obtained in the two groups were within the physiological range for the goat (Kramer & Hoffmann, 1997). Moreover the monitoring of GOT and GPT in all subjects showed the absence of hepatic diseases. No statistical differences were found in blood parameters, between groups (data not reported).
Table 1 shows the chemical composition of the five feeds. Cereal grains, maize and barley contained different levels of carbohydrates [respectively: starch, 65.2 and 49.0% DM; neutral detergent fibre (NDF), 11.4 and 22.8% DM]. Sunflower cake and faba bean were characterized by a high protein content and a different carbohydrate composition (respectively: starch, 0.7 and 46.8% DM; NDF, 44.3 and 20.4% DM); moreover, true protein in faba bean was more rapidly degradable than in sunflower, as demonstrated by the higher levels of the soluble fraction (B1), and the lower level of the neutral-detergent insoluble nitrogen (B3).
Table 2 – Composition of the selectes diet (% dry matter, DMI) and feeds chosen (% of available feeds)
Genotype Signficance (P) EMS AA FF Genotype (G) Week (W) G×W
Feed chosen % available feeds
Hay 69.3 66.0 0.237 <0.001 0.825 39.4 Barley 78.9 87.4 0.202 <0.001 0.044 72.8 Maize 92.4 85.4 0.209 <0.001 0.041 65.0 Faba bean 37.2 56.7 0.010 <0.001 0.828 122.2 Sunflower cake 44.6 47.2 0.639 <0.001 0.002 135.2 Energy feed to protein ratio † 2.36 1.84 0.023 <0.001 0.012 0.20
Composition of the selected diet
Crude Protein, %DM 15.7 16.5 0.068 <0.001 0.011 0.40 Neutral detergent fibre % DM 33.5 32.8 0.217 <0.001 0.468 2.02 Acid detergent fibre % DM 19.7 19.3 0.354 <0.001 0.490 0.48 Water-soluble carbohydrates % DM 4.4 4.4 0.263 <0.001 0.115 0.01 Starch 27.1 27.6 0.425 <0.001 0.173 1.91 Protein Franctions % CP A 18.6 18.2 0.090 <0.001 0.049 0.15 B1 7.9 9.2 0.002 0.059 <0.001 0.04 B2 46.1 45.8 0.183 0.004 0.251 0.11 B3 19.3 18.8 0.019 <0.001 0.019 0.07 C 6.1 6.3 <0.001 <0.001 <0.001 0.01 † Maize plus barley intake / faba bean plus sunflowerintake (g DM/d)
35 Table 2 shows results for feed choice and composition of the selected diets. On
average goats from both groups showed a strong preference for maize, barley and hay, whereas they consumed less high-protein feeds. The genotype significantly influenced feeding behaviour: selection activity towards faba bean was significantly lower in AA group. Other significant grouprweek interaction effects are highlighted in Fig. 1: during week 1 AA goats elected less sunflower and barley, whereas from week 2 they selected more maize, compared with FF group. As a consequence of this selective activity the resulting energyrich to protein-rich feeds ratio was significantly higher in AA group. Despite the differences in feed selection, the CP and carbohydrate contents of the selected diets were surprisingly similar in both groups. As for true protein, the soluble fraction (B1) and the indigestible fraction (C) were significantly lower in the diet selected by AA group.
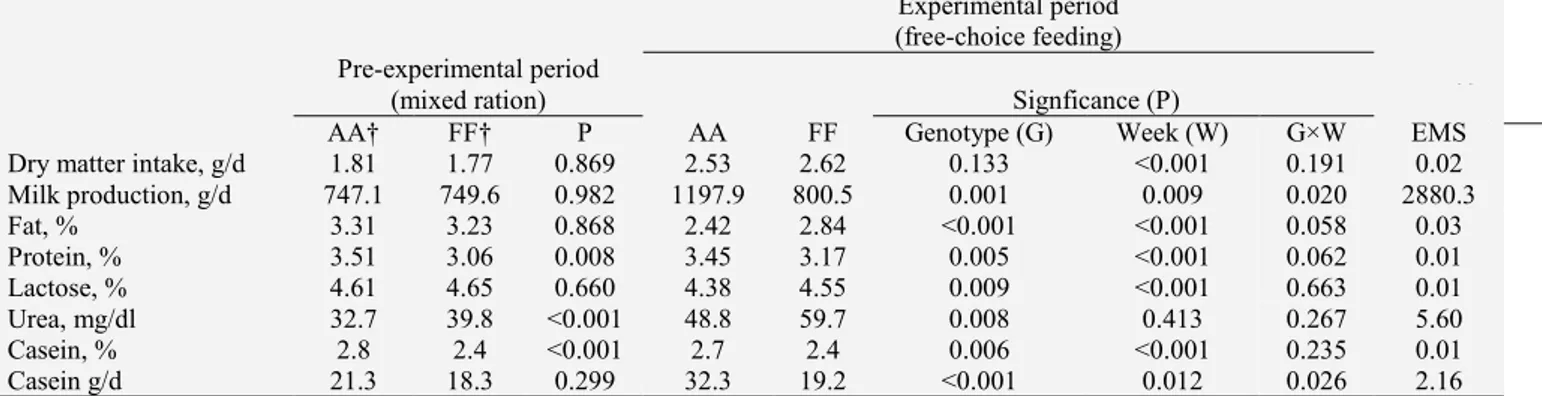
Table 3 – Dry matter intake, milk production and composition and casein yield
Experimental period (free-choice feeding) Pre-experimental period
(mixed ration) Signficance (P)
AA† FF† P AA FF Genotype (G) Week (W) G×W EMS Dry matter intake, g/d 1.81 1.77 0.869 2.53 2.62 0.133 <0.001 0.191 0.02 Milk production, g/d 747.1 749.6 0.982 1197.9 800.5 0.001 0.009 0.020 2880.3 Fat, % 3.31 3.23 0.868 2.42 2.84 <0.001 <0.001 0.058 0.03 Protein, % 3.51 3.06 0.008 3.45 3.17 0.005 <0.001 0.062 0.01 Lactose, % 4.61 4.65 0.660 4.38 4.55 0.009 <0.001 0.663 0.01 Urea, mg/dl 32.7 39.8 <0.001 48.8 59.7 0.008 0.413 0.267 5.60 Casein, % 2.8 2.4 <0.001 2.7 2.4 0.006 <0.001 0.235 0.01 Casein g/d 21.3 18.3 0.299 32.3 19.2 <0.001 0.012 0.026 2.16 † Genetic variants, see text for details
Table 3 shows results for DM intake, milk yield and composition. Total DM intake was not affected by genotype. AA goats, starting from the adaptation period, increate their milk production reaching values significantly higher than FF goats (Fig. 2). Percentages of protein and casein, as expected for the genotypes studied, were significantly higher in the group with strong alleles (AA), whereas lactose was higher in the group with weak alleles (FF). As a consequence of the increased milk production, AA goats achieved a mean casein production 68% higher than FF goats. Milk urea was significantly higher in the FF goats, since the pre-experimental period (Fig. 3). Fat percentages, noticeably lower compared with those recorded during the pre-experimental period, were significantly lower in AA goats.
36
Figure 1 – Hay, maize, barley, sunflower and faba bean selection (% of each available DM amont) in
AA (■) and FF (○) goats; * P<0.05
Figure 2 - Milk production (g/d) in in AA (■) and
FF (○) goats; * P<0.05
Figure 3 - Milk urea (mg/dl) in in AA (■) and FF
37 Discussion
In our experimental conditions, with the animals left free to choose their diet, intake was particularly high, on average equal to 170 g DM/kg metabolic body weight. According to INRA recommendations (Morand-Fehr & Sauvant, 1988), similar levels of DM and protein intake correspond to the requirements of a goat weighing 70 kg (compared with about 40 kg in our experimental conditions) and producing 4 l/d (compared with about 1 l). Despite this high nutrient input, goats did not show any clinical signs of metabolic disorders and blood parameters were within the normal range of values. Feeding behaviour shown by goats, when free to choose their diet, can probably explain this response: all the goats, during the experimental period, strongly increased selection towards hay and sunflower, the most fibrous feeds (Fig. 1); this behaviour seems to support the hypothesis that ruminants are able to select their diet in order to attenuate ruminal acidosis (Cooper et al. 1996; Phy & Provenza, 1998; Abijaoude´ et al. 2000a; Keunen et al. 2002). Moreover, goats selected on average 83 and 89% of the available barley and maize but only 47% and 46% of faba bean and sunflower, preferring the high-energy and low-protein feeds over the high-energy and high-protein feeds. This selective behaviour suggests that goats increased Energy intake without paying the metabolic price of an excessive protein intake. The capability of ruminants to respond to nutritional imbalances by modifying their feeding behaviour has been shown by Villalba & Provenza (1996, 1997a) and it seems linked to the perception of postingestive feedback signals related to the sensory properties of foods; in fact the animals can learn the negative or positive nutritional consequence of foods from their own experience (Provenza, 1995; Duncan et al. 2006). We cannot exclude the possibility that a supply of a lowprotein roughage might have resulted in a reduction of protein intake, also limiting the high energy input. However, using a poor quality roughage, which is generally associated with low palatability (Greenhalgh & Reid, 1971) would bring with it the risk of this aspect, more than nutritional and metabolic motivations linked to genotype, exercising a confounding effect on selective behaviour. As regards genotype effect, there are very few reports on the relationships between as1-casein polymorphism and nutrition. Schmidely et al. (2002) and de la Torre et al. (2008), in controlled feeding conditions, found greater intakes and a better diet efficiency in goats with strong alleles. In our
38 experiment we did not find any intake differences between groups. However, the
genotype significantly influenced feeding behaviour: selection activity towards faba bean was significantly higher in FF group.
Moreover, during week 1 AA goats selected less sunflower and barley, whereas from week 2 until the end of the trial they selected more maize, compared with FF group. On average, this behaviour resulted in a higher ratio of energyfeeds to protein-feeds in AA goats (Table 2). In this way AA goats probably improved the efficiency of microbial protein synthesis and increased the availability of amino acids for mammary protein synthesis. In fact, it has been widely demonstrated that milk protein concentration is positively influenced by energy concentration of the diet (Nocek & Russel, 1988; Coulon et al. 2001; Pulina et al. 2008).
Surprisingly the different feeding behaviours in the two genotypes did not result in different contents of CP and carbohydrates in the selected diets. It should be taken into account, however, that even foods formulated to be isocaloric or isonitrogenous may differ functionally (Atwood et al. 2006) so creating nutritional characteristics beyond the scope of gross analysis. For example, in our experiment, AA goats consumed lower highly soluble (B1) and insoluble (C) true protein fractions, compared with FF goats, probably obtaining lower losses of protein, in terms of NH3-N and in terms of totally indigestible protein (Licitra et al. 1996). For starch-rich feeds, maize being less degradable than barley (Sauvant, 1997; Hadjipanayiotou, 2004) and with a higher proportion of ruminal escape starch, is supposed to affect the rumen fermentation pattern (Casper & Schingoethe, 1989) and microbial protein synthesis (Offner et al. 2003) and to be more efficiently used for milk production compared with barley (Nocek & Tamminga, 1991). At the start of the pre-experimental period the goats, fed with a mixed ration of 1500 g of pelleted hay and 200 g of each feed used during the trial, were not able to select their diet. Under those conditions, goats produced similar amounts of milk. However, starting from the free-choice adaptation period, milk production tended to increase significantly in AA group, even though the goats were well beyond the peak of lactation. To our knowledge there are no reports in the literature of similar productive differences between AA and FF genetic types. Schmidely et al. (2002) report that, when feeding practice is monitored, AA and FF goats have similar milk production, concluding that a direct effect of the genotype for
39 as1-casein on milk production is unlikely. As our goats, at the beginning of the trial,
were homogeneous in terms of milk production and lactation stage, it is possible that, during the experimental period, giving the animals the opportunity to select their diet, the different feeding behaviour between groups induced different efficiencies of nutrient utilization for milk secretion; it seems to suggest an indirect effect of genotype on milk yield by way of the difference in selective activity.
Total milk protein content was obviously closely related to the casein content. On the basis of the classification of Martin et al. (1999) AA goats should have produced milk with 0.6% more casein than FF goats. In our study, milk casein content was only 0.3 percentage points higher in group AA. This result may be related to the ‗dilution‘ effect on casein content of the higher milk production in AA group. Moreover, Caravaca et al. (2008) recently highlighted that breed-specific genetic and/or environmental factors can modulate the impact of the as1-casein gene polymorphism on its synthesis rate. Important differences between groups were seen for milk urea levels, which were significantly higher in FF goats. High concentrations of milk urea in ruminants are a consequence of excessive dietary CP (Broderick, 2003; Cannas, 2004) or an inadequate balance between protein and non-structural carbohydrate sources, both in quantitative terms and in rumen degradability (Hristov & Ropp, 2003; Moharrery, 2004) indicating a low efficiency of microbial synthesis. In the present study, urea levels were already higher in FF group during the pre-experimental period, when the animals were fed with the same diet, similarly to the finding of Schmidely et al. (2002); this difference tended to increase during free-choice feeding. In fact FF goats, selecting a diet with a worse combination of energy and protein feeds, compared with AA group, probably reached a lower efficiency of transfer of nitrose into milk protein. Moreover, a diet higher in highly soluble protein and lower in rumen-escape protein, was characterized by higher protein losses and lower milk protein levels.
Milk fat content, in both groups, was low in comparison with previous results (Todaro et al. 2005; Avondo et al. 2008) on Girgentana goats and was lower than protein content. This phenomenon of inversion of fat and protein percentages is not rare in goats (Pulina et al. 2008) during spring at mid lactation (Abijaoudé et al. 2000b; Bocquier et al. 2000; Morand-Fehr et al. 2000); it can be related t the


![Table 1 shows the chemical composition of the five feeds. Cereal grains, maize and barley contained different levels of carbohydrates [respectively: starch, 65.2 and 49.0% DM; neutral detergent fibre (NDF), 11.4 and 22.8% DM]](https://thumb-eu.123doks.com/thumbv2/123dokorg/4504832.34246/34.892.92.822.760.1115/chemical-composition-cereal-contained-different-carbohydrates-respectively-detergent.webp)