Animai (2018), 12:12, pp 2480-2488 © The Animai Consortium 2018
doi:10.1017/S17S1731118000629
_
animaI
Genome-wide identification of runs of homozygosity islands and
associated genes in local dairy cattle breeds
S. Mastrangelo
1t,M. T. Sardina" M. Tolone
1,R. Di Gerlando
1,A. M. Sutera" L. Fontanesi
2and B. Portolano
1I Dipartimento Scienze Agrarie, Alimentari e Forestali, Universita degli Studi di Palermo, 90128 Palermo, Italy; 20epartment of Agricultural and Food Sciences, Division of Animai Sciences, University of Bologna, 40127 Bologna, Italy
(Reeeived 25 September 2017; Aeeepted 23 february 2018; first published anline 26 Mareh 2018)
Runs of homozygosity (ROH) are widely used as predictors of whole-genome inbreeding levels in cattle. They identify regions that have an unfavorable effect on a phenotype when homozygous, but also identify the genes associated with traits of economic interest present in these regions. Here, the distribution of ROH islands and enriched genes within these regions in four dairy cattle breeds were investigated. Cinisara (71), Modicana (72), Reggiana (168) and Italian Holstein (96) individuals were genotyped using the 50K v2 Illumina BeadChip. The genomic regions most commonly associated with ROHs were identified by selecting the top 1 % of the single nuc/eotide polymorphisms (SNPs) most commonly observed in the ROH of each breed. In total, 11 genomic regions
were identified in Cinisara and Italian Holstein, and eight in Modicana and Reggiana, indicating an increased ROH frequency level. Generally, ROH islands differed between breeds. The most homozygous region (>45% of individuals with ROH) was found in Modicana on chromosome 6 within a quantitative traillocus affecting milk fat and protein concentrations. We identified between 126 and 347 genes within ROH islands, which are involved in multiple signaling and signal transduction pathways in a wide variety of biological processes. The gene ontology enrichment provided information on possible molecular functions, biological processes and cellular components under selection related to milk production, reproduction, immune response and resistancel susceptibi/ity to infection and diseases. Thus, scanning the genome for ROH could be an alternative strategy to detect genomic regions and genes related to important economic traits.
Keywords: runs of homozygosity islands, genomic regions, candidate genes, local dairy cattle, bovine beadchip 50K Implications
The genomic regions subjected to selection tend to generate
runs 01 homozygosity (ROH) islands or hotspots. The aim 01 this work was to identify the differences between breeds and
use the location 01 ROH islands to identify genes potentially involved in economically important traits. We identilied
sev-eral genes within ROH involved in a wide variety 01 biological
processes, such as milk yield and composition, reproduction, immune response, resistance/susceptibility to inlectious and
diseases. These results showed that scanning the genome lor ROH could be an alternative strategy to detect genomic regions and genes related with important economically traits.
Introduction
The development 01 single nucleotide polymorphism
(SNP) arrays to scan the genome allow us to distinguish
t E-mail: [email protected]
non-autozygotic segments that are identica I by state
lram
autozygotic and identical by descent segments (Peripolli et al., 2016). A potenti al alternative method, called ROH, has
been used in livestock lor the identilication 01 homozygous genomic regions (Purfield et al., 2012; Ferencakovié et al., 2013a). Runs 01 homozygosity are contiguous lengths 01 homozygous genotypes that are present in an individuai because the parents transmitted identical by descending haplotypes to their offspring (Gibson et al., 2006). Runs 01 homozygosity has been widely used as predictors 01 w hole-genome inbreeding levels (Zhang et al., 2015a; Mastrangelo
et al., 2016). Moreover, ROH have been used in livestock genomic studi es, conlirming the correlation between shared ROH and genomic regions putatively under selection (Kim et al., 2013; Gaspa et al., 2014; Metzger et al., 2015;
Szmatola et al., 2016; Kukuckovà et al., 2017; Purfield et al., 2017). In lact, the genomic regions subjected to selection
Irequently show signatures, such as reduced nucleotide diversity, and tend to generate ROH islands or hotspots, which have high levels 01 homozygosity around a selected
locus compared with the rest 01 the genome (Szmatola
et al.,
2016; Purfield
et al.,
2017). Runs 01 homozygosity islands arenot randomly distributed across the genome and are shared among individuals within a breed (Zhang
et al.,
2015b).A large number 01 cattle breeds are delined by marked phenotypic differences and, therelore, constitute valuable
models to study genome evolution in response to processes
such as selection and domestication. Thus, in livestock
species, ROH may contribute to the detection 01 genomic
regions that could explain phenotypic differences among
breeds that affect traits 01 economie importance. We previously described ROH structures in three local cattle breeds (Reggiana, Cinisara and Modicana) and in Holstein
calli e (Mastrangelo
et al.,
2016). The aim 01 this work was to lurther study the distribution 01 ROH islands across the genome 01 these lour (attle breeds, which may provi de insights into the mechanisms underlying their genomic differences. In addition, it aimed to characterize ROH islandsand identify enriched genes that could potentially explain the effects 01 these homozygous regions on economically
important traits.
Material and methods
Samples,
genotyping and data
filtering
A total 01 407 ani mais (Cinisara = 71, Modicana = 72, Reggiana
=
168 and Italian Holstein=
96) were used lor theanalyses. Ali 01 the individuals were genotyped using the Illumina BovineSNP50 v2 BeadChip assay (Illumina Ine., San
Diego, CA, USA). Single nucleotide polymorphisms were
liltered to exclude loei assigned to unmapped contigs, and only those SNPs located on autosomes were considered.
Quality contro I included cali Irequency ~0.95, minor allele Irequency (MAF) ~0.01, and Hardy-Weinberg Equilibrium
with a p> 0.001. SNPs that did not satisfy these quality criteri a were excluded. Single nucleotide polymorphisms were
mapped using the 80S
taurus
UMD 3.1.1 genome assembly.Genetic
relationship
between individuals
The genetic relationship among individuals was estimated by prineipal components analysis (PCA) 01 genetic distances.
This analysis was based on the identity by state (IBS)
matrices 01 genetic distances between individuals. Principal
components analysis 01 the genetic distance (D) matrix was performed using the multidimensional scaling option in PLiNK v.l.07 (Purcell
et al.,
2007). The graphicalrepre-sentation was depicted using the statistical R software (http://www.R-project.org/).
Runs
ofhomozygosity
detection
Runs 01 homozygosity were estimated, lor each individuai, using a sliding window approach 01 50 SNPs in PLiNK v.l.07 (Purcell
et al.,
2007). The minimum length that constituted the ROH was set to 4 Mb. The density 01 the SN P panel usedto generate data lor ROH identilication is an important lactor that strongly affects autozygosity estimates. The 50K panel overestimates the number 01 small segments
(Purfield
et al.,
2012; Ferencakoviéet al.,
2013b). The lollowing criteri a were used to deline the ROH: (i) onemissing SNP was allowed in the ROH and up to one possible
heterozygous genotype, (ii) the minimum number 01 consecutive SNPs that constituted a ROH was set to 30,
(iii) minimum density 01 1 SNP every 100 kb, and (iv) max
-imum gap between consecutive SNPs 01 1 Mb.
Identification
of
genomic regions
and genes within
runs
of
homozygosity
To identify the genomic regions of high homozygosity, the
amount 01 times that each SNP appeared in the ROH was
considered and normalized by dividing it by the number 01
animals included in the analysis. These values were plotted
against the position 01 the SNP along the chromosome. The genomic regions were delined according to Szmatola
et al.
(2016). Adjacent SNPs having a proportion 01 ROH occurrences
over the adopted threshold lormed ROH islands. Mean linkage disequilibrium (LO) was estimated using HAPLOVIEW v. 4.2
(Barrett
et al.,
2005) lor ali pairwise combinations 01 SNPs within each ROH island. Genomic coordinates lar ali identilied ROH islands were also used lor the annotation 01 genes thatwere lully or partially contained within each selected region using the UCSC Genome Browser (http://genome.ucse.edul).
The genes were lurther analyzed with the Panther Classilica-tion System (Mi
et al.,
2013) to identify signilicant (P~ 0.05)gene ontology (GO) terms. Finally, to investigate the biological lunction 01 each annotated gene contained in ROH islands, an accurate literature search was also conducted.
Results
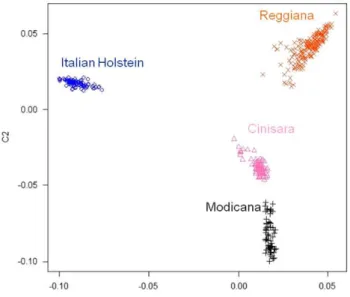
A PCA was used to visualize and explore the genetic relationships among breeds. The PCA (Figure 1) showed that breeds lormed non-overlapping clusters and were clearly
separated populations. Alter data quality and genetic relationships analyses, no outliers were detected.
0.05 Italian Holstein 0.00 -0.05 Modicana~
t
..(l,lO L,---,---,---~ ·0.10 ·0.05 000 0_05 C1Figure 1 Genetic relationship defined with multidimensional scaling analysis for the four cattle breeds.
Mastrangelo, Sardina, Tolone, Di Gerlando, Sutera, Fontanesi and Portolano Cinisara 10
.
.
-
_.
.:-
_.
.._
..
._-
.._
..-_
_
!..
.. ......
:..
. ..
-
-
!-
-
..
--
....
:_
-
.
-
--
•. - ___ : 0 •'.0 • _ _-
_ .. :..
.. .!. .. ::'--
-
-
-
-
--
-
.
_
_
.
_
...-
_
..._
-
-
-
-
-
-
-
-
..-
_
.-15
~
5 O-_.
_.
_
-
_
.
_
.
-
-
- -- __ _ o •--
-
.
-
_
-
-
-
-......
.
-..
_
. .-
•-
• • 0.
..
_ _-
-
_-
_--
--
--
-
.
_
.
.
_
_.....
.
.. - .. t i i I i i i i I i i i i i i i 2 3 4 5 6 7 8 9 10 11 12 14 16 18 20 22 24 26 28 25 20 :I: 15~
1~
~o
.
Cl..
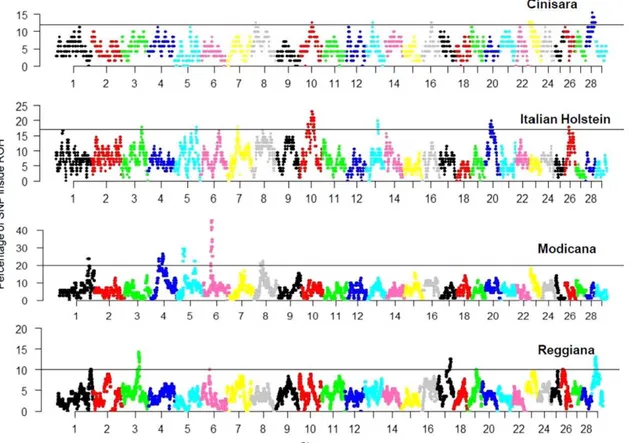
Z <Jl 2 3 4 5 6 7 8 9 10 11 12 14 16 18 20 22 24 26 28 Modicana 2 3 4 5 6 7 8 9 10 11 12 14 16 18 20 22 24 26 28 20 15 Reggiana 10 +----,~~-+---~~---~--~--- ~-l~ 5 O 2 3 4 5 6 9 10 11 12 Chromosome 14 16 18 20 22 24 26 28Figure 2 Genome-wide frequency af single nucleotide polymorphisms (SNPs) occurrence into runs af homozygosity (ROH) for each cattle breed. The black lines indieated the adopted threshold whieh delines the autozygosity islands, different per eaeh breed (top 1% 01 the observations).
A total 01 44875 SNPs in Cinisara, 42687 SNPs in Modicana, 35270 SNPs in Reggiana, and 41 569 SNPs in Italian Holstein cattle breeds were retained after quality contro I lor ROH detection. The top 1 % 01 SNPs ob5erved in the ROH was selected, and adjacent SNPs over this threshold were merged into genomic regions corresponding to ROH islands (Szmatola
et al.,
2016). In ROH islands detected here, each SNP showed a percentage 01 occurrence > 1 0% (Figure 2). This approach resulted in the identilication 01 11 ROH islands in Cinisara and Italia n Holstein, and eight in Modicana and Reggiana (Table 1). Two overlapping ROH islands were observed between breed pairs. Modicana and Reggiana breeds showed a common genomic region on Bostaurus
autosome (BTA) 6 (6:38689886 to 39346170 bp) and Cinisara and Italian Holstein breeds on BTA 10 (10:56464919 to 56792715 bp). The genomic distribution 01 ROH islands was clearly non-unilorm among breeds and across autosomes (Table 1). The longest ROH island was observed in Italian Holstein on BTA10 (12.42 Mb), while the shortest one was observed in Reggiana on BTA3 (0.03 Mb). BTA6 in Modicana breed had the ROH with the highest peak (Figure 2) which consisted 0138 SNPs with an occurrence in ROH >45% and a length 012.05 Mb.The mean
r
2value, a standard descriptive LD parameter, was estimated lor ali pairvvise combinations 01 SNPs within each ROH island (Supplementary Material Table Sl). In Cinisara breed, the majority 01 SNPs within ROH islands showed low level 01 LD «0.080), and
r
2 ranged lrom0.024 to 0.290. The other breeds showed intermediate levels 01 LD within ROH islands (Irom 0.006 to 0.280). The highest LD level was lound in the ROH island on BTA6 in Reggiana breed (0.387).
Within ali 01 the ROH islands here reported, we identilied lrom 126 to 347 genes (347 Italian Holstein, 250 Modicana, 190 Cinisara and 126 Reggiana). A list 01 genes lound in the ROH islands 01 each breed undervvent a GO enrichment analysis. Multiple categories were statistically signilicant
(P",0.05). The genes within ROH islands encompass a wide spectrum 01 molecular lunction, biological process, and cellular components. A PANTHER gene list analysis revealed a high percentage 01 genes involved in catalytic activity (GO:0003824), cellular processes (GO:0009987), celi part (GO:0044464), metabolic processes (GO:0008152), binding (GO:0005488) as well as biological regulations (GO:0065007) and response to stimulus (GO:0050896) in ali 01 the ROH islands 01 the analyzed breeds (Table 2). Supplementary Material Table S2 provides the chromosome position, number 01 SNPs and number 01 genes per genomi c region, gene symbol and lull name lor ali 01 the annotated genes in each breed. Discussion
We analyzed ani mais lrom lour Italian cattle breeds with different inbreeding background and selection histories. Mastrangelo
et
al.
(2016), in a previous study on evaluation on ROH in these breeds, reported the highest value 01Tabl. 1 Li,! 01 genomie region, 01 extended homozygo,ity (ROH i,land,) identilied in eaeh eattle breed Number Number of Breed BTA of SNP, genes Cinisara 8 5 O 10 6 1 13 4 O 16 23 22 23 84 16 23 7 6 23 5 2 28 69 49 28 88 20 28 9 1 28 136 60 Italian Hol'tein 3 35 27 5 2 1 7 6 2 10 83 71 10 214 76 10 47 17 13 61 100 20 33 11 20 28 16 20 27 8 26 26 19 Modicana 1 39 25 4 46 4 4 113 20 5 84 136 5 51 18 6 112 25 8 53 4 8 10 Reggiana 1 25 14 1 15 3 3 2 O 3 71 28 6 12 4 17 97 31 26 23 8 29 74 28
inbreeding (F) based on ROH (FROH = 0.055) lor Modicana,
whereas Reggiana showed the lowest one (FRoH
=
0.035).The individuals 01 Italian Holstein and Reggiana showed high number 01 short ROH segments. Modicana and Cinisara showed similar results between them with the totallength 01
ROH characterized by the presence 01 large segments due to a recent inbreeding. In this study, we reported the distribu
-tion 01 ROH islands across the genome 01 these cattle breeds
to provide insights into the mechanisms underlying genomic differences among them.
Genomic regions with high frequency in runs of
homozygosity
In our study, we did not perform LO pruning, but, owing to
the minimum 4 Mb size 01 ROH segments, we tried to avoid
Start bp End bp length (bp)
18112643 18420652 308010 56464919 56792715 327797 30530185 30878341 348157 43922935 45552538 1 629604 60163 6423288 6363126 10870036 11 251 946 381911 13517193 13 793 884 276692 27 655 543 32996400 5340858 34157181 39007759 4850579 39700262 40191764 491 503 40782405 46224056 5441 652 91930742 93497168 1 566427 99527745 99569438 41694 49145480 49715020 569541 34907534 40294545 5387012 49889790 62309052 12419263 63095461 67118053 4022593 51880463 56190025 4309563 24266877 26460587 2193711 29545545 31848979 2303435 34817221 36570529 1 753309 19727292 21226405 1499114 130168696 132182348 2013 653 35763942 37877 098 2113157 51406099 57744446 6338348 27 542 987 33508142 5965156 78776781 82786530 4009750 34324052 41343408 7019357 29767566 32749041 2981476 40422559 40921256 498698 150141293 151550746 1409454 151 736540 152412536 675997 71141852 71167977 26126 73035441 79378528 6343088 38689886 39346170 656285 56941968 61 788328 4846361 9078964 10441474 1362511 15819913 23142122 7322210
small autozygous segments caused by LD. Indeed, a strong
LD, typically extending up to - 200 kb, is common through
-out the bovine genome (Mastrangelo et al., 2014), and short
ROH are very prevalent. To exclude these short and very
common ROH, the minimum length lor ROH was set to >4Mb.
The top 1 % 01 SNPs with the highest number 01 occurrence was chosen as an indication 01 a possible ROH island in the genome. The sa me threshold was reported in studies on
cattle (Szmatola et al., 2016) and sheep (Purfield et al., 2017). Gaspa et al. (2014) and S61kner et al. (2014) used top
regions with percentage 01 SNP in ROH >40% within breed,
whereas Mészaros et al. (2015) applied a threshold 01 10%.
Recently, a common ROH proportion higher than 7.5% was chosen as an indicator 01 potential autozygosity islands in
Mastrangelo, Sardina, Tolone, Di Gerlando, Sutera, Fontanesi and Portolano
Tabl.2 Gene ontology IGO) terms enriehed IP < 0.05) based on runs or homozygosity islands and number or involved genes In) ror eaeh earrle breed
Breeds Molecular function Biological process
Cinisara Binding (GO:00054BB) n
=
32 Cellular component organization (GO:0071840) n=
18Receptor activity (GO:0004872) n= 7 Cellular process (GO:0009987) n= 57
5tructural molecule activity localization (GO:0051179) n= 20
(GO:0005198) n = 2 Reproduction (GO:0000003) n = 5 Biological regulation
Signa I transducer activity (GO:0065007) n= 36
(GO:0004871) n
=
6 Response to stimulus (GO:0050896) n=
20Catalytic activity (GO:0003824) n
=
40 Developmental proeess (GO:0032502) n=
15Transporter activity (GO:0005215) Immune 5ystem process (GO:0002376) n
=
1n
=
9 Multicellular organismal process (GO:0032501) n= 15Biological adhesion (GO:0022610) n= 1
locomotion (GO:0040011) n
=
1Metabolie process (GO:0008152) n = 50
Growth (GO:0040007) n= 1
Modicana Binding (GO:0005488) n
=
37 Cellularcomponent organization (GO:0071840) n=
19Receptor activity (GO:0004872) n = 20 Cellular process (GO:0009987) n= 82
5tructural molecule activity localization (GO:0051179) n= IO
(GO:0005198) n = IO Biological regulation (GO:0065007) n= 42
Signa I transducer activity Response to stimulus (GO:0050896) n
=
40(GO:0004871) n
=
17 Developmental process (GO:0032502) n=
29Catalytic activity (GO:0003824) n = 33 Multicellular organismal process (GO:0032501) n= 34
Transporter activity (GO:0005215) locomotion (GO:0040011) n
=
11n=11 Biological adhesion (GO:0022610) n=3
Metabolic process (GO:0008152) n = 45
Growth (GO:0040007) n
=
5Immune system proeess (GO:0002376) n
=
7Reggiana Binding (GO:0005488) n=28 Cellular component organization (GO:0071840) n=6
Receptor activity (GO:0004872) n= 1 Cellular process (GO:0009987) n= 44
5tructural molecule activity localization (GO:0051179) n= 11
(GO:0005198) n= 3 Biological regulation (GO:0065007) n= 14
Catalytic activity (GO:0003824) n
=
30 Response to stimulus (GO:0050896) n=
11Transporter activity (GO:0005215) Developmental process (GO:0032502) n
=
11n
=
6 Multicellular organismal process (GO:0032501) n= 11Signa I transducer activity Biological adhesion (GO:0022610) n= 2
(GO:0004871) n = 6 Metabolic process (GO:0008152) n = 31
Italian Translation regulator activity Cellular component organization (GO:0071840) n
=
31Holstein (GO:0045182) n= 1 Cellular process (GO:0009987) n= 138
Binding (GO:0005488) n= 74 localization (GO:0051179) n= 37
Receptor activity (GO:0004872) n = 12 Reproduction (GO:0000003) n = 8
5tructural molecule activity Biological regulation (GO:0065007) n= 63
(GO:0005198) n= lO Response to stimulus (GO:0050896) n= 35
Signa I transducer activity Developmental process (GO:0032502) n
=
33(GO:0004871) n = 8 Multicellular organismal process (GO:0032501) n= 20
Catalytic activity (GO:0003824) n = 86 Biological adhesion (GO:0022610) n= 7
Transporter activity (GO:0005215) locomotion (GO:0040011) n = 7
n
=
19 Metabolic process (GO:0008152) n=
112Immune system process (GO:0002376) n
=
IOCellular component
Membrane (GO:0016020) n = 12
Macromolecular complex (GO:0032991) n17
Celi part (GO:0044464) n = 52
Organelle (GO:0043226) n= 32 Extracellular region (GO:0005576) n = 12 5ynapse (GO:0045202) n= 1 Celi junction (GO:0030054) n = 2 Membrane (GO:0016020) n = 9 Macromolecular complex (GO:0032991) n = 29 Extracellular matrix (GO:0031012) n=2
Celi part (GO:0044464) n= 57
Organelle (GO:0043226) n= 35 Extracellular region (GO:0005576) n = 8 5ynapse (GO:0045202) n= 1 Membrane (GO:0016020) n = 4 Macromolecular complex (GO:0032991) n = 11 Celi part (GO:0044464) n = 35 Organelle (GO:0043226) n= 22 5ynapse (GO:0045202) n= 2
Celi junction (GO:0030054) n = 3
Membrane (GO:0016020) n = 17
Macromolecular complex (GO:0032991) n = 39
Celi part (GO:0044464) n= 121
Organelle (GO:0043226) n= 64
Extracellular region
(GO:0005576) n = 8
cattle (Kukuckova
et
al., 2017). Therelore, we have employed a stricter criteria compared with the last two works mentioned above.The ROH peaks were distributed and shared among
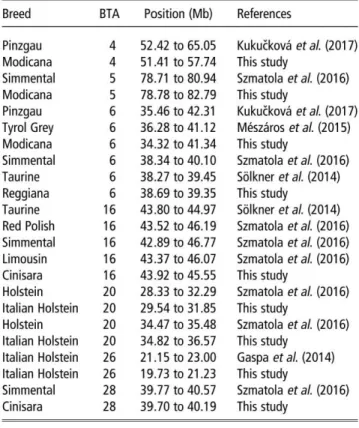
indi-viduals, and it was dear that they were signs 01 common ROH islands within breeds. Some 01 these genomic regions overlapped with ROH islands lound in other studies (Table 3).
The ROH islands reported on BTA4 and BTA5 in Modicana overlapped with ROH islands reported in Pinzgau (Kukuckova
et
al., 2017) and Simmental (Szamatolaet
al., 2016). Several studies (S6lkneret
al., 2014; Mészaroset
al., 2015; Szamatolaet
al., 2016; Kukuckovaet
al., 2017) showed ROH islands located on BTA6. These regions overlapped with theones obtained in our study lor Modicana (34.32 to 41.34 Mb) and Reggiana (38.69 to 39.35 Mb). S61kner
et
al. (2014) studying Taurine and Indicine cattle breeds, identilied aregion in BTA16 (43.80 to 44.97 Mb) visible only in Taurine. This overlapped with a region obtained in our study in
Table 3 Comparison among overlapped runs DI homozygosity (ROH) islands here detected and those reported in previous studies
Breed BTA Posilion (Mb) References
Pinzgau 4 52.42 lo 65.05 Kukuèkovà et al. (2017)
Modicana 4 51.41 lo 57.74 This sludy
Simmental 5 78.71 lo 80.94 S,malola et al. (2016)
Modicana 5 78.78 lo 82.79 This sludy
Pinzgau 6 35.46 lo 42.31 Kukuèkovà et al. (2017)
Tyrol Grey 6 36.28 lo 41.12 Mészàros et al. (2015)
Modicana 6 34.32 lo 41.34 This sludy
Simmental 6 38.34 lo 40.10 S,malola et al. (2016)
Taurine 6 38.27 lo 39.45 Solkner et al. (2014)
Reggiana 6 38.69 lo 39.35 This sludy
Taurine 16 43.80 lo 44.97 Solkner et al. (2014)
Red Polish 16 43.52 lo 46.19 S,malola et al. (2016)
Simmental 16 42.89 lo 46.77 S,malola et al. (2016)
limousin 16 43.37 lo 46.07 S,malola et al. (2016)
Cinisara 16 43.92 to 45.55 This study
Holstein 20 28.33 to 32.29 S,matola et al. (2016) Italian Holstein 20 29.54 to 31.85 This study
Holstein 20 34.47 to 35.48 S,matola et al. (2016) Italian Holstein 20 34.82 to 36.57 This study
Italian Holstein 26 21.15 to 23.00 Gaspa et al. (2014)
Italian Holstein 26 19.73 lo 21.23 This sludy
Simmental 28 39.77 lo 40.57 S,matola et al. (2016)
Cinisara 28 39.70 lo 40.19 This study
Cinisara (43.92 to 45.55 Mb). Similar results were also
reported lor Red Polish, Simmental, and Limousine cattle
breeds (Szmatola
et
al., 2016). Runs 01 homozygosity islandsidentilied on BTA20 in Italian Holstein were also described by
Szamatola
et
al. (2016) in Holstein. Moreover, the peakidentilied on BTA26 in Italian Holstein partially overlapped
with those obtained lor the same breed by Gaspa et al. (2014) in which the stearoyl-CoA desaturase (SCO) locus is
located. Finally, the ROH islands reported on BTA28 in
Cini-sara overlapped with an ROH island reported in Simmental
(Szamatola et al., 2016). These results suggested that some
01 the ROH islands are common among different cattle
breeds, and harbor variants that are undergoing selection
independently 01 production and selection characteristics
(Szmatola
et
al., 2016). The inconsistencies among thecri-teria delining ROH islands makes it difficult to compare
studies because the lack 01 consensus allows different
thresholds and thus different signals (Peripolli et al., 2016).
However, the overlapping ROH islands among studies
pro-vided good evidence that they are not artilacts but genuine
genomic regions affected by inbreeding. It is important to
highlight that ROH islands can also be partly explained by the
reduced recombination rate. Indeed, despite ROH being more
or less equally distributed throughout the chromosomes,
ROH islands were mostly lound in regions with low
recom-bination rates (Purfield et al., 2017). To verify this
distribu-tion in our cattle breeds and to determine il recombination
rate impacted ROH islands, the linkage inlormation
pub-lished by the USDA (Ma
et
al., 2015) were considered. Maet
al. (2015) assessed the relationship betweenrecombina-tion rate and chromosomallocations because recombination
rates are known to differ considerably across chromosomal
locations, including telomeres and centromeres. Ali cattle
autosomes are acrocentric with the centromere located at
the beginning and the telomere at the end 01 the
chromo-some. These authors reported a very low recombination rate
near the centromere and the beginning 01 each chromosome,
and they showed that the middle 01 the chromosome had a
decreased recombination rate, although the centro me re is
lar. Moreover, Ma
et
al. (2015) highlighted that this lowrecombination rate in the middle 01 chromosome was not
universal across ali bovine chromosomes, but more
pronounced lor some 01 them (i.e. BTA9, 10, 11, 13, 15, 16, 19 and 23). Following the smooth spline plotting 01 the
recombination rate reported by Ma
et
al. (2015) in cattle, wechecked il the ROH islands shown in Table 1 overlapped with
regions 01 the genome showing low recombination rates.
Some ROH islands actually overlapped with regions having
low recombination rates (Table 1) as reported in previous
studies in sheep (Purfield
et
al., 2017). Moreover, a previousstudy on cattle (Purlield
et
al., 2012) reported a correlationbetween extensive LD and high incidence 01 ROH. The
majority 01 SNPs within ROH islands showed similar LD levels
as those computed lor the enti re chromosome
(Supplemen-tary Material Table S2), with the exception 01 two ROH
islands (on BTA16 in Cinisara and on BTA 6 in Reggiana).
Therelore, their existence was noI easy explained on the
basis 01 just LD (Nothnagel
et
al., 2009).Identification of candidate genes within
runs
ofhomozygosity
We lound that some SNPs occurred in regions 01 poor gene
contenI. Some 01 the identilied ROH islands, such as on BTA 10
in the Cinisara breed, contained only one annotated gene
(WOR72) or uncharacterized genes (i.e. LOC107132862). This
may rellect selection acting on uncharacterized regulatory
regions or simply the lixation 01 non-coding DNA by genetic
drift due to the absence 01 any selection (Qanbari
et
al., 2011).An enrichment 01 genes involved in several GO-lerms was
observed in the lour cattle breeds. We have not discussed in
detail ali 01 the genomic regions associated with ROH islands.
Instead, we locused on selected genes in highly GO-enriched
terms that, on the basis of the literature, showed associations
with severa I specific traits relaled to livestock. Therefore, the
lunctions 01 candidate genes within ROH islands play
impor-tant roles in cattle and other livestock species are summarized
lor each breed.
In Cinisara, the ROH islands were identified on BTA8, 10,
13, 16, 23 and 28. A total of 40 genes were identified as
being relaled to catalytic activity (GO:0003824), with genes
implicated in immune response and immune regulation
(PIK3CO and SPSB1, respectively) (Ramey
et
al., 2013).A high number of genes (n
=
57) were identified as beingrelated to cellular process (GO:0009987). Among these,
some candidate genes mapped on BTA16, such as PEXI4,
Mastrangelo, Sardina, Tolone, Di Gerlando, Sutera, Fontanesi and Portolano
strong selection in dairy Holstein cattle (Fiori
et
al., 2009),and RERE, which is implicated in embryonic growth and
reproductive development (Ramey
et
al., 2013). Moreover, 52 identilied genes were also related to celi part(GO:0044464) in which we highlighted the AOK gene on BTA28, which is involved in a physiological state (Ramey
et
al., 2013). Other candidate genes within the ROH islandson BTA28 were NRG3 and PPYRI, which are related with bovine mammary gland development and milk production, respectively (Ogorevc
et
al., 2009).The ROH islands in the Modicana breed were identilied on BTA1, 4, 5, 6, and 8. A total 0137,82 and 69 genes were
identilied as being related to binding (GO:0005488), cellular
process (GO:0009987) and celi part (GO:0044464), respec-tively. Severa I enriched GO-terms contained genes related
with milk production, such as the LALBA gene, a major whey
protein that showed a signilicant association with the milk protein profile (Huang
et
al., 2012). On BTA6, the most homozygous region (>45% 01 individuals having the ROH island) was lound (6:37019972 to 39069719 bp) and itcontained an intriguing element. A quantitative trait locus
(QTL) on this chromosome affecting milk lat and protein
concentrations has been reported (Zhang
et
al., 1998). The QTL, containing six genes (ABCG2, PK02, SPPI, MEPE, IBSPand LAP3), was identilied within one ROH island in our study.
In this chromosomal region, severa I genes associated with
milk production traits are annotated, such as FAMI3AI, a
gene near a milk protein QTL related to the protein content (Cohen
et
al., 2014). The ABCG2 gene harbors a quantitative trait nucleotide lor milk composition in cattle (Olsenet
al.,2008). LAP3 has been associated with milk production traits
(Zheng
et
al., 2011) and with calving ease in dairy cows(Olsen
et
al., 2008). Other interesting candidate genes, basedon their suggested molecular lunction, were lound, such as CAVI and CAV2 on BTA4, which are implicated in the immune system (Qanbari
et
al., 2014). On BTA5, the KRTgene lamily, which is associated with epithelial develop-ment, was highlighted, together with TFCP2, which contained a QTL associated with lertility (Moore
et
al., 2016).Moreover, we observed a genomic region within the ROH island that contained ollactory receptor lamily genes. Ollac-tory receptors detect and identify a wide range 01 odors and
chemosensory stimuli, a necessity lor linding lood, detecting mates and offspring, recognizing territori es and avoiding danger. They are also reported to be duplicated within the bovine genome, suggesting that they may be under strong selection lor newly evolving lunctions (Qanbari
et
al., 2014). In the Reggiana breed, the ROH islands were identilied on BTA1, 3, 6, 17, 26 and BTA29. A total 0130 genes wereidentilied as being related to catalytic activity (GO:0003824) with candidate genes, such as 0IRAS3, which is involved in reproductive traits (Cheng
et al.,
2007), and PTEN, which is involved in mammary gland lunction (Liet
al., 2015). A total01 44 genes were identilied as being related to cellular
process (GO:0009987) with genes, such as MINPPI, which is
associated with milk latty acid traits in dairy cattle (Li
et
al.,2015). Moreover, 35 genes identilied in ROH islands were
related to celi part (GO:0044464), and several 01 these genes (such as TAOK3 and NCAPG) have been previously
asso-ciated with milk production traits (Li
et
al., 2010; Weikardet
al., 2012). We also detected the SLC3501 gene, which isassociated with the immune system (Qanbari
et
al., 2014),and the KSR2 gene, which affects milk production traits
(Pimentel
et
al., 2011).In the Italian Holstein breed, the 11 ROH islands were
lound on BTA3, 5, 7, 10, 13, 20 and BTA26. The most representative supercluster identilied by the GO-term
enrichment contained several candidate genes involved in milk production traits and reproduction. Among the 86 genes
related to catalytic activity (GO:0003824), we lound RHOV,
which is related to dairy production (Gutiérrez-Gil
et
al.,
2015), on BTA 10 and SCO, which has a large inlluence on
milk lat composition because it plays a major role in determining the monounsaturated latty acids, primarily oleic acid and the CLA content 01 milk lat (Rincon
et
al., 2012), on BTA26. The greatest number 01 genes (138) was related tocellular process (GO:0009987). 01 these, BMP4 is involved in the development and lunctioning 01 lollicles (Qanbari
et
al.,2010), and OXT and AVP play major roles in regulating
estrous behavior in dairy cows (Kommadath
et
al., 2011). Finally, 121 genes related to celi part (GO:0044464) were also lound. The PELO gene on BTA20 is involved in dairy production (Gutiérrez-Gilet
al., 2015). Other importantcandidate genes within the ROH island were 0101, which is related to milk synthesis and energy metabolism (Cannor
et
al.,
2003) on BTA3 and SLClA4RG, which is involved in lactation persistency (Nayeriet
al., 2016), on BTA10. C9,which is involved in immune response, was located within a
QTL region lor mastitis-related traits (Sahana
et
al., 2013).As reported above, several enriched GO-terms were
related to milk production, reproductian, immune respanse, and resistance/susceptibility to inlections and diseases. This indicated that the analyzed individuals may have experi-enced selective pressure on their genomes lor these specilic
traits. Some genomic regions may be lixed in individuals
within a population as a result 01 artilicial or natural
selec-tion lor reasans such as adaptability or productivity. Cinisara and Modicana are two breeds that have excellent abilities to
adapt to harsh environments, high resistance levels to inlections and diseases, good maternal aptitudes, and high-quality milk production. Genes that are involved in these traits were detected in our study using the ROH approach and were consistent with the phenatypic characteristics 01 these two breeds. Recently, a study on local sheep breeds
(Mastrangelo
et
al., 2017) revealed the presence 01 ROH islands in genomic regions that harbor candidate genes lorselectian in respanse to enviranmental stress and which underlie local adaptatian. The presence 01 many immune
system-related genes in the identilied ROH islands could
rellect selection (natura I or artilicial) lor disease resistance. Reggiana and Italian Holstein are two breeds reared and selected lor milk production, and in accordance with this phenotypic trait, our results emphasized the presence 01 dairy-related genes within the ROH islands. Currently, in
dairy cattle, such as Holstein, the systemic decline 01 lertility is being observed, in agreement with the several genes
implicated in affecting the reproductive traits highlighted in this work. Kim et al. (2013) lound that several genomic
regions within ROH were associated with economically
important traits, including milk, lat and protein yields.
Therelore, the annotated genes that mapped to these ROH islands were perceived as exposed to selection.
Conclusion
In this work, we examined the distributions 01 ROH islands
across the genomes 01 lour cattle breeds with similar
produc-tion aptitudes but different selection histories. We conlirmed
that the ROH islands were clearly non-unilorm among breeds
and across chromosomes. In lact, different ROH islands were
lound across breeds, consistent with possible signatures 01
either artilicial or natural selection. For most genes associated
with ROH islands, a biological link to traits 01 economie
importance, which are known to be under selection, can be hypothesized and are consistent with the phenotypic
char-acteristics 01 these breeds. Because genomic regions that are
subjected to selection tend to generate ROH islands, their
dis-tributions can indicate genomic regions that may have been
subjected to selective pressure. Our results contributed to
understanding how selection can shape the distribution 01 ROH islands and suggested that ROH islands can be used to identify genes potentially involved in economically important traits. Further research must be performed to compare selection
signatures and ROH islands, and to incorporate the use 01
ROH island' distributions across the genome to limit the number 01 lalse positives identilied and to modify current procedures.
Acknowledgments
This research was linanced by PON02_00451_3133441, CUP:
B61 C1200076005 lunded by MIUR.
Declaration 01 interest None.
Ethics statement None.
Software and data repository resources None.
Supplementary materia I
To view supplementary materia I lor this article, please visit
https:/Idoi.org/l 0.1 017/51751731118000629
References
Barrett JC. Fry B, Maller J and Daly MJ 2005. Haploview: analysis and
visualization of LD and haplotype maps. Bioinformatics 21. 263-265.
Cheng HC, Zhang FW, Deng CV, Jiang CD, Xiong YZ, Li FE and Lei MG 2007. NNAT and DIRAS3 genes are paternally expressed in pigs. Genetics Seleetion
Evolution 39, 599-607.
Cohen M, Reichenstein M, Everts-van der Wind A, Heon-lee J, Shani M, lewin HA, Weller JI, Ron M and Seroussi E 2014. Cloning and characterization af
FAM13Al-a gene near a milk protein QTL on BTA6: evidence for population-wide linkage
disequilibrium in Israeli Holsteins. Genomics 84, 374-383.
(onnor EE, Sonstegard TS, Kahl S, Bennett Gl and Snelling WM 2003. The
bovine type t iodothyronine deiodinase (0101) gene maps to chromosome 3.
Animai Genetics 34, 233-234.
Ferencakovié M, Hamzié E, Gredler B, Solberg TR, Klemetsdal G, Curik I and
Solkner J 2013a. Estimates of autozygosity derived from runs of homozygosity:
empirical evidence from selected cattle populations. Journal of Animai Breeding
and Genetics 130, 28&-293.
Ferencakovié M, Solkner J and Curik 12013b. Estimating autozygosity from high-throughput information: effects of SNP density and genotyping errors. Genetics Selection Evolution 45, 42.
Fiori l, Fritz S, Jaffrezic F, Boussaha M, Gut I, Heath S, Foulley Jl and Gautier M 2009. The genome response to artificial selection: a case study in dairy cattle. PloS One 4, e6S95.
Gaspa G, Marras G, Sorbolini S, Ajmone-Marsan p, Williams JL Valentini A. Dimauro
C and Macciotta NNP 2014. Genome-wide homozygosity in ltalian Holstein cattle
using HO pane!. In Proceedings of the 10th World Congress of Genetics Applied to livestock Production, 17 to 22 August. Vancouver, Be. Canada.
Gibson J, Morton N and Collins A 2006. Extended tracts of homozygosity in
outbred human populations. Human Molecular Genetics 15, 789-795. Gutiérrez-Gil B, Arranz JJ and Wiener P 2015. An interpretive review of selective sweep studies in Bos taurus cattle populations: identification of unique and shared selection signals across breeds. Frontiers in Genetics 6,167.
Huang W, Pefiagaricano F, Ahmad KR, lucey JA, Weigel KA and Khatib H 2012. Assodation between milk protein gene variants and protein composition traits
in dairy cattle. Journal of Dairy Science 95, 440-449.
Kim ES, Cole JB, Huson H, Wiggans GR, Van Tassell CP, Crooker BA, liu G, Da Y
and Sonstegard TS 2013. Effect of artifidal selection on runs of homozygosity in
U.S. Holstein cattle. PloS One 8, e80813.
Kommadath A, Woelders H, Beerda B, Mulder HA, de Wit AA, Veerkamp RF, te
Pas MF and Smits MA 2011. Gene expression patterns in four brain areas associate with quantitative measure of estrous behavior in dairy cows. BMC
Genomics 12, 200.
Kukuckova V, Moravè:ikova N, Ferencakovié M, Simcic M, Mészaros G, S61kner S, Trakovicka A, Kadleeik O, Curik I and Kasarda R 2017. Genomic characterization of Pinzgau cattle: genetic conservation and breeding perspectives. Conservation Genetics. 18, 893-910.
li H, Wang l, Moore SS, Schenkel FS and Stothard P 2010. Genome-wide scan
for positional and functional candidate genes affecting milk production traits in Canadian Holstein Cattle. In Proceedings of the 9th World Congress of Genetics
Applied to livestock Production, 1 to 6 August, leipzig, Germany.
li D, Xie X, Wang J, Bian Y, li Q, Gao X and Wang C 2015. MiR-486 regulates
lactation and targets the PTEN gene in cow mammary glands. PloS One 10,
.0118284.
Ma l, O'Conneli JR, VanRaden PM, Shen B, Padhi A, Sun e. Bickhart DM,
Cole JB, Null DJ, liu GE, Da Y and Wiggans GR 2015. Cattle sex'spedfic
recombination and genetic control from a large pedigree analysis. PloS Genetics 11 .• 1005387.
Mastrangelo S, Saura M, Tolone M, Salces-Ortiz J, Di Gerlando R, Bertolini F,
Fontanesi l, Sardina MT, Serrano M and Portolano B 2014. The genome-wide structure of two economically important indigenous Sicilian cattle breeds.
Journal of Animai Science 92, 4833-4842.
Mastrangelo S, Tolone M, Di Gerlando R, Fontanesi l, Sardina MT and Portolano B 2016. Genomic inbreeding estimation in small populations: evaluation of runs of homozygosity in three local dairy cattle breeds. Animai 1 O, 746-754. Mastrangelo S, Tolone M, Sardina MT, Sottile G, Sutera AM, Di Gerlando R and
Portolano B 2017. Genome-wide scan for runs of homozygosity identifies
potential candidate genes associated with local adaptation in Valle del Belice sheep. Genetics Selection Evolution 49, 84.
Mészaros G, Boison SA, Perez O'Brien AM, Ferencakovié M, Curik I, Da Silva MV, Utsunomiya YT, Garda JF and S61kner J 2015. Genomic analysis for managing
small and endangered populations: a case study in Tyrol Grey cattle. Frontiers in Genetics 6, 173.
Metzger J, KafWath M, Tonda R. Beltran S, Agueda l, Gut M, Gut IG and Disti O 2015. Runs of homozygosity reveal signatures of positive selection for r
Mastrangelo, Sardina, Tolone, Di Gerlando, Sutera, Fontanesi and Portolano
Mi H, Muruganujan A and Thomas PD 2013. PANTHER in: modeling the
evolution of gene function, and other gene attributes, in the context of phylogenetic trees. Nucleic Acids Research 41, 0377-D386.
MaDre SG, Pryce JE, Hayes 8J, Chamberlain AJ, Kemper KE, Berry DP, MeCabe M,
Cormican P, Lonergan P, Fair T and Butler 5T 2016. Differentially expressed
genes in endometrium and corpus luteum af Holstein cows selected for high and
low fertility are enriched for sequence variants associateci with fertility. Biology of Reproduction 94, 19.
Nayeri S, Sargolzaei M. Abo-Ismail MK, Miller S, Schenkel F, Maore SS and Stathard P 2016. Genome-wide association study for lactation persisteney, female fertility, longevity, and lifetime profit index traits in Holstein dairy cattle.
Journal of Dairy Seience 100, 1246-1258.
Nothnagel M, lu T. Kayser M and Krawczak M 2009. Genomic and geographic
distribution of SNP-defined runs of homozygosity in Europeans. Human
Molecular Genetics 19, 2927-2935.
Ogorevc J, Kunej T. Razpet A and Dovc P 2009. Database of cattle candidate genes and genetic markers for milk production and mastitis. Animai Genetics 40, 832-851.
Olsen HG, Meuwissen THE, Nilsen H, Svendsen M and Uen S 2008. Fine mapping of quantitative trait loei on bovine chromosome 6 affecting calving difficulty.
Journal of Dairy Seience 91, 4312-4322.
Peripolli E, Munari DP, Silva MVGB, Lima ALF, Irgang R and Baldi F 2016. Runs of homozygosity: current knowledge and applications in livestock. Animai Genetics 48, 255-271.
Pimentel ECG, Bauersachs S, Tietze M, Simianer H, Tetens J, Thaller G,
Reinhardt F, Wolf E and Konig S 2011. Exploration of relationships between production and fertility traits in dairy cattle via assoeiation studies of
SNPs within candidate genes derived by expression profiling. Animai Genetics
42,251-262.
Purcell S, Neale B, Todd-Brown K, Thomas l, Ferreira MA, Bender D, Maller J, Sklar P, de Bakker PI, Daly MJ and Sham PC 2007. PUNK: a toolset for whole genome association and population-based linkage analyses. The American Journal of Human Genetics 81,559-575.
Purtield DC, Beny DP, M,Parland Sand Bradley DG 2012. Runs of homozygosity
and population history in cattle. BMC Genetics 13, 70.
Purlield DC, McPariand S, Wall E and Berry DP 2017. The distribution of runs of homozygosity and selection signatures in six commerciai meat sheep breeds.
PLoS One 12, e0176780.
Qanbari S, Gianola D, Hayes B, Schenkel F, Miller S, Moore S, Thaller Gand
Simianer H 2011. Application of site and haplotype-frequency based approaches for detecting selection signatures in cattle. BMC Genomics 12, 318.
Qanbari S, Pausch H, Jansen S, Somel M, Strom TM, Fries R, Nielsen R and Simianer H 2014. Classic selective sweeps revealed by massive sequencing in cattle. PloS Geneticsl0, el004148.
Qanbari S, Pimentel ECG, Tetens J, Thaller G, Lichtner P, Sharifi AR and Simianer H 2010. A genome-wide scan far signatures of recent selection in
Holstein cattle. Animai Genetics 41, 377-389.
Ramey H, Decker J, McKay S, Rolf M, Schnabel R and Taylor J 2013.
Detedion of seledive sweeps in cattle using genome-wide SNP data. BMC Genomics 14, 382.
Rincon G, Islas-Trejo A, Casti Ilo AR, Bauman DE, German BJ and Medrano JF
2012. Polymorphisms in genes in the SREBP1 signalling pathway and SCO are associated with milk fatty acid composition in Holstein cattle. Journal of Dairy Research 79, 66-75.
Sahana G, Guldbrandtsen B, Thomsen Band lund MS 2013. Confirmation and
fine-mapping of clinical mastitis and somatic celi score QTl in Nordic Holstein cattle. Animai Genetics 44, 620-626.
Solkner J, Ferenèakovié M, Karimi l, Perez Q'Brien AM, Mészaros G,
Eaglen S, Boison SA and Curik 12014. Extremely non-uniform: patterns of runs of homozygosity in bovine Populations. In Proceedings, 10th World Congress
of Genetics Applied to Livestock Production, 17 to 22 August, Vancouver, BC,
Canada.
Szmatola T, Gurgul A, Ropka-Molik K, Jasielczuck I, labek T and Bugno-Poniewierska M 2016. Charateristics of runs of homozygosity in seleded cattle breeds maintained in Poland. Livestock Science 188, 72-80.
Weikard R, Widmann P, Buitkamp J, Emmerling R and Kuehn C 2012. Revisiting the quantitative trait loei for milk produdion traits on BTA6. Animai Genetics 43,
318-323.
lhang Q, Boichard D, Hoeschele I, Ernst C, Eggen A, Murkve B, pfister-Genskow M,
Witte LA, Grignola FE, Uimari P, Thaller Gand Bishop MD 1998. Mapping
quantitative trait loei for milk produdion and health of dairy cattle in a large outbred pedigree. Genetics 149, 1959-1973.
lhang Q, Calus MP, Guldbrandtsen B, lund MS and Sahana G 2015a. Estimation of inbreeding using pedigree, 50k SNP chip genotypes and fullsequence data in three (attle breeds. BMC Genetics 16, 88.
lhang Q, Guldbrandtsen B, Bosse M, lund MS and Sahana G 2015b. Runs of homozygosity and distribution of fundional variants in the cattle genome. BMC Genomics 16, 542.
lheng X, Ju l, Wang J, li Q, Huang J, lhang A, Zhong J and Wang C 2011. Single nucleotide polymorphisms, haplotypes and combined genotypes of LAP3 gene in
bovine and their assoeiation with milk produdion traits. Molecular Biology Reports 38, 4053-4061.