Dipartimento di biotecnologie, chimica e farmacia
PhD Program in Chemical and Pharmaceutical Sciences
Cycle XXXIII
Dottorato di ricerca in Chimica e Tecnologie Farmaceutiche
Ciclo XXXIII
Coordinatore Prof. Maurizio Taddei
Atmospheric emissions profiles of geothermal
energy production to minimise the
environmental footprint:
an innovative methodological investigation
based on LCA approach
Tutor Co-Tutor Candidate
Dr. Maria Camilla Baratto
Prof.ssa Maria Laura Parisi Dr Loredana Torsello
Nicola Ferrara
I express my heartfelt thanks to Prof. Riccardo Basosi for inspiring this research and for the excellent advice received during our acquaintance, even beyond the academic world.
I also whish thanks the research group at the University of Siena, where I conducted my studies, for significant contribution received to my education.
TABLE OF CONTENTS
INTRODUCTION ... 1
REFERENCES ... 5
STRUCTURE AND CONTENT OF THE THESIS ... 8
1 ENVIRONMENTAL DATA COLLECTION AND ANALYSIS ... 10
1.1 DATA ANALYSIS OF ATMOSPHERIC EMISSION FROM GEOTHERMAL POWER PLANTS IN ITALY ... 10
1.1.1 Data ... 11
1.1.2 Experimental design, materials, and methods ... 15
1.1.3 Data processing ... 18
1.1.4 Funding ... 18
1.1.5 Acknowledgments ... 19
1.1.6 Conflict of interest ... 19
1.1.7 References ... 19
2 LIFE CYCLE IMPACT ASSESSMENT AND RESULTS INTERPRETATION ... 21
2.1 LIFE CYCLE ASSESSMENT OF ATMOSPHERIC EMISSION PROFILES OF THE ITALIAN GEOTHERMAL POWER PLANTS ... 21
2.1.1 Introduction ... 22
2.1.2 Materials and methods ... 26
2.1.3 Life cycle inventory analysis ... 32
2.1.4 Life cycle impact assessment methods ... 36
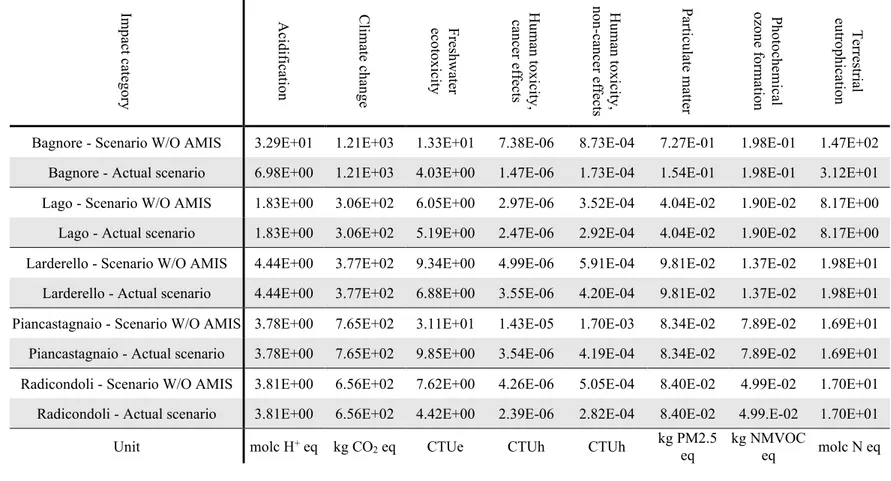
2.1.5 Results and discussion ... 37
2.1.6 Conclusions ... 48
2.1.7 Acknowledgment ... 50
2.1.8 References ... 50
2.2 THE TOXICITY OF HEAVY METALS IN LCIA METHODS: THE EFFECTS OF UNCERTAINTIES ON CHARACTERISATION FACTORS .... 59
2.2.1 Introduction ... 59
2.2.2 Case studies ... 60
2.2.3 Inventory ... 60
2.2.4 Methods ... 61
2.2.5 Results and discussions ... 63
2.2.6 Conclusions ... 66
2.2.7 References ... 67
2.3 COMPLETE DATA INVENTORY OF A GEOTHERMAL POWER PLANT FOR ROBUST CRADLE-TO-GRAVE LIFE CYCLE ASSESSMENT RESULTS... 70
2.3.1 . Introduction ... 70
2.3.2 Materials and Methods ... 74
2.3.3 Life cycle inventory analysis ... 80
2.3.4 Results ... 84
2.3.5 Discussion ... 89
2.3.6 Conclusions ... 92
2.3.7 References ... 93
3 METHODOLOGICAL ADVANCES ... 99
3.1 PERFORMING A FAST AND EFFECTIVE GLOBAL SENSITIVITY ANALYSIS USING PYTHON: A SIMPLIFIED EXAMPLE APPLIED TO THE LCA OF ITALIAN ELECTRICITY GENERATION SCENARIOS ... 99
3.1.1 Introduction ... 99
3.1.2 Materials and methods ... 100
3.1.3 Results ... 103
3.1.4 Conclusions ... 106
3.1.5 References ... 107
3.2 PARAMETRIC SIMPLIFIED MODELS FOR THE ENVIRONMENTAL EVALUATION OF TWO GEOTHERMAL POWER PLANTS WITH DIFFERENT PRODUCTION TECHNOLOGIES ... 109
3.2.1 Introduction ... 109
3.2.2 Material and methods ... 110
3.2.3 Results and discussion ... 114
3.2.4 References ... 145
1
INTRODUCTION
Climate change involves global warming induced by human greenhouse gas pollution as well as the subsequent widespread changes in climate patterns. There have been past cycles of climate change, but humans increased much the magnitude of that effect from the middle of the 20th Century (Stocker et al., 2013).
No research body with national and international status denies that human actions have caused climate change. Greenhouse gases (GHGs), of which about 90% carbon dioxide (CO2) and methane (CH4) are the primary factors, the primary cause of these emissions is fossil fuel combustion for energy consumption, with additional inputs from forestry, deforestation, and the industry’s process (US EPA, Overview of Greenhouse Gases).
Rising temperatures in most parts of the globe restrict ocean productivity and destroy fish stocks. Environmental impacts include the extinction or relocation of many species, especially in coral reefs, mountain ranges, and the Arctic, as their ecosystems shift. Even if attempts to reduce future warming are successful, such consequences, including increasing sea levels, increasing ocean temperatures, and acidification at sea by high CO2 levels, will continue for centuries.
Many of these effects also exist at the present warming stage, which is approximately 1.1 °C. The IPCC has provided numerous reports projecting impacts increasing as warming progresses to 1,5 °C (and beyond). Under the Paris Convention (European Commission, 2015), 190 nations agreed to maintain warming “well under 2.0 °C “. However, global warming will hit about 2.8 °C by the end of the Century, resulting in a warming of about 3.0 °C under existing policies. To limit warming to 1.5°C, it would require emissions to be halved by 2030 to reach near-zero by 2050 (IPCC, 2018; NOAA, 2020; Tschakert, 2015).
Mitigation initiatives include research, production, and implementation of low-carbon energy technologies, increased energy management, fossil-fuel emission mitigation policies, forestation, and forest protection. Most companies and governments work to respond to current and future global warming by strengthening the coastline’s protection, strengthening disaster management, and growing more resistant crops.
2 The general policy used to limit global warming effects talks about the decarbonisation of energy sources. Since energy production, meant as electricity and heat production, is responsible for a large part of GHGs emissions, processes based on more sustainable energy source is the baseline to try to control the effect of GHGs. A low carbon economy or decarbonised economy is an economy based on energy sources with a minimum GHGs emissions level (European Commission, 2013; IPCC, 2014; Overland et al., 2019).
Recent technologies and policy developments would allow renewable energy and energy efficiency practices to play a significant role in fossil fuel displacement, thus meeting global energy demand while reducing carbon dioxide emissions. Technologies exploiting renewable energy are increasingly being implemented and, combined with performance gains, can produce much more significant reductions in emissions than could be accomplished if actions are undertaken independently (Armstrong et al., 2016; Müller et al., 2011).
Renewable energy sources exploited nowadays are many, and the most known and familiar are hydroelectric, wind, and solar (REN21, 2016). All these energy sources are linked to the energy generated by the sun. Hydroelectric is based on the potential energy acquired by water basins when rain occurs on mountains: it exploits the water cycle induced by solar energy. In the same way, wind energy is the manifestation of a gradient of temperatures between two areas due to heating produced by sun irradiation, and, of course, solar energy is the direct exploitation of solar radiation. Therefore, environmental conditions determine the effective production from these sources.
In this context, geothermal energy production is one of the most attractive renewable sources in the low carbon economy panorama (Fridleifsson et al., 2008). It has long been known and exploited (Scali et al., 2013), but many experts assert it is not enough, considering its potential. It is linked with the Earth's geological nature; it is the manifestation of the geothermal gradient generated by radioactive decay and continual heat loss derived from Earth’s formation. The best know expressions of this are the hot springs, phenomena involving spills of hot water from the Earth’s surface.
The widespread perception considering the lack of these natural manifestations is that geothermal resource is identified with high-grade hydrothermal systems, that are too few and too limited to be a significant part of a long-term national energy plan (DiPippo, 2015; Shortall
3 & Kharrazi, 2017). However, it should be considered that Earth has an internal heat content of 1031 joules (3·1015 TWh), approximately 100 billion times the 2010 worldwide annual energy consumption. Therefore, the potential energy that can be exploited is vast (Tester et al., 2006).
Unfortunately, extraction of this kind of energy is sometimes challenging, and a few are places in the world where it is possible to use this energy easily. The most notorious case is the Icelandic one. Indeed, in this region, a larger portion of energy requests is by far covered by geothermal energy exploitation. However, the most influential site from a historical and technological perspective is located in Italy, namely in Tuscany, where the first industrial development of this resource began (Parri et al., 2016). Nowadays, the electricity production from deep geothermal in Tuscany is still relevant since 900 MWe of power are installed, which can cover energy demand for almost 1/3 of Tuscany.
Besides, this energy source has properties that make it unique compared to other renewables, and with some similarities with fossils fuels energy production systems for some aspects. Geothermal energy does not depend on environmental conditions; indeed, a geothermal power plant can produce energy 365 days a year, 24 hours a day. This property is very positive because it is essential to balance the electric grid compensating for fluctuation determined by traditional renewables such as the above mentioned solar, wind, and hydro. On the other hand, this kind of power plant also has a drawback: the energy produced with this technology is not sustainable and renewable “as it is”. If the power plants are not operated correctly, the resource can be spent making it non-renewable (Dobson et al., 2020; Tezel et al., 2016). Indeed, the amount of geothermal fluid that is possible to extract from the geothermal source is not infinite, and the reservoir can be exhausted, likely a crude oil source. The geothermal field needs to be exploited prudently to avoid this phenomenon occurring, implementing correct technological solutions proved to be helpful in this sense (Allegrini et al., 1992; DiPippo, 2015; Minissale, 1991).
Another point which makes the diffusion of geothermal energy exploitation very limited is connected to the various geological structure of the earth. Usually, the places where natural manifestations are present are the one where it is possible to develop this technology simply, and so only in Iceland, Italy (Larderello), New Zeeland, Indonesia, and in other few places
4 relevant installations are present. Despite that, much more are the regions where the geothermal gradient is enough to reach significant temperatures not so deep below the surface. Besides, new drilling technologies and new resource engineering approaches can also bring geothermal accessibility in regions where it is now impossible (“The Future of Geothermal Energy,” 2006; Thorbjörnsson et al., 2016).
There is a need for a scientific and rigorous approach to assess and evaluate the aspects connected to renewability and sustainability of the resource exploitation, definitively, to assess the environmental performance of the system. In this context, the Life Cycle Assessment methodology can play a crucial role (EPA, 2008; The International Standards Organisation, 2006). The possibility to analyse the whole life cycle of a power plant deeply is valuable since it can highlight critical processes along the whole supply chain.
The research activities described in the thesis have been carried out thanks to the collaboration and supervision of COSVIG (Consortium for the Development of Geothermal Areas). Part of the research described here was also performed in Belgium, where I was hosted as a PhD visiting student at VITO NV, a research centre focused on innovation for environmental sustainability purposes.
Part of the research described here was also performed in the framework of the Horizon 2020 research and innovation program under grant agreement No [818242 — GEOENVI].
5
References
Allegrini, G., Luccioli, F., & Trivella, A. (1992). Industrial uses of geothermal fluids at Larderello.
Geothermics, 21(5–6), 623–630. https://doi.org/10.1016/0375-6505(92)90015-2
Armstrong, R. C., Wolfram, C., De Jong, K. P., Gross, R., Lewis, N. S., Boardman, B., Ragauskas, A. J., Ehrhardt-Martinez, K., Crabtree, G., & Ramana, M. V. (2016). The frontiers of energy.
Nature Energy. https://doi.org/10.1038/nenergy.2015.20
DiPippo, R. (2015). Geothermal power plants: Evolution and performance assessments.
Geothermics, 53, 291–307. https://doi.org/10.1016/j.geothermics.2014.07.005
Dobson, P., Dwivedi, D., Millstein, D., Krishnaswamy, N., Garcia, J., & Kiran, M. (2020). Analysis of curtailment at The Geysers geothermal Field, California. Geothermics. https://doi.org/10.1016/j.geothermics.2020.101871
EPA. (2008). Life Cycle Assessment: Principles and Practice. Vasa.
European Commission. (2013). The EU Emissions Trading System (EU ETS). Climate Action. European Commission. (2015). The Paris Protocol - A blueprint for tackling change beyond
2020. European Union Package.
Fridleifsson, I. B., Bertani, R., & Huenges, E. (2008). The possible role and contribution of geothermal energy to the mitigation of climate change. IPCC Scoping Meeting on
Renewable Energy Sources.
IPCC. (2014). Climate Change 2014 Synthesis Report Summary Chapter for Policymakers. Ipcc. IPCC. (2018). Global Warming of 1.5 Degrees Celcius. In IPCC-Intergovernmental Panel on
Climate Change.
Minissale, A. (1991). The Larderello geothermal field: a review. Earth Science Reviews, 31(2), 133–151. https://doi.org/10.1016/0012-8252(91)90018-B
Müller, S., Brown, A., & Ölz, S. (2011). Policy Considerations For Deploying Renewables.
Renewable Energy.
NOAA. (2020). State of the Climate: National Climate Report for Annual 2019. In Nature. Overland, I., Bazilian, M., Ilimbek Uulu, T., Vakulchuk, R., & Westphal, K. (2019). The GeGaLo
6 index: Geopolitical gains and losses after energy transition. Energy Strategy Reviews. https://doi.org/10.1016/j.esr.2019.100406
Parri, R., Lazzeri, F., & Cataldi, R. (2016). Larderello: 100 years of geothermal power plant evolution in Italy. In Geothermal Power Generation: Developments and Innovation. https://doi.org/10.1016/B978-0-08-100337-4.00019-X
REN21. (2016). Renewables 2016 Global Status Report. In Renewables 2016 Global Status
Report. https://doi.org/ISBN 978-3-9818107-0-7
Scali, M., Cei, M., Tarquini, S., & Romagnoli, P. (2013). The Larderello – Travale and Amiata Geothermal fields : case histories of engineered geothermal systems since early 90’s.
European Geothermal Congress 2013, 1–9.
Shortall, R., & Kharrazi, A. (2017). Cultural factors of sustainable energy development: A case study of geothermal energy in Iceland and Japan. Renewable and Sustainable Energy
Reviews, 79, 101–109. https://doi.org/10.1016/j.rser.2017.05.029
Stocker, T. F., Qin, D., Plattner, G. K., Tignor, M. M. B., Allen, S. K., Boschung, J., Nauels, A., Xia, Y., Bex, V., & Midgley, P. M. (2013). Climate change 2013 the physical science basis: Working Group I contribution to the fifth assessment report of the intergovernmental panel on climate change. In Climate Change 2013 the Physical Science Basis: Working
Group I Contribution to the Fifth Assessment Report of the Intergovernmental Panel on Climate Change. https://doi.org/10.1017/CBO9781107415324
Tester, J. W., Anderson, B. J., Batchelor, A. S., Blackwell, D. D., & DiPippo, R. (2006). The Future of Geothermal Energy - Impact of Enhanced Geothermal Systems (EGS) on the United States in the 21st Century. MIT - Massachusetts Institute of Technology.
Tezel, T., Foulger, G. R., & Julian, B. R. (2016). Relative Microearthquake Locations at the Geysers. European Geothermal Congress 2016, 1–5.
The Future of Geothermal Energy. (2006). In Massachusetts Institute of Technology. ISBN: 0-615-13438-6 ,
https://energy.mit.edu/wp-content/uploads/2006/11/MITEI-The-Future-of-Geothermal-Energy.pdfThe International Standards Organisation. (2006).
INTERNATIONAL STANDARD assessment — Requirements and guilelines. The
7 https://doi.org/10.1007/s11367-011-0297-3
Thorbjörnsson, I. Ö., Kohl, T., Edelmann, T., Bertani, R., & Sæther, S. B. (2016). Deployment of Deep Enhanced Geothermal Systems for Sustainable Energy Business. European
Geothermal Congress 2016, 2050, 19–24.
Tschakert, P. (2015). 1.5°C or 2°C: a conduit’s view from the science-policy interface at COP20 in Lima, Peru. Climate Change Responses. https://doi.org/10.1186/s40665-015-0010-z US EPA. . Overview of Greenhouse Gases.
8
STRUCTURE AND CONTENT OF THE THESIS
The research described in this thesis can be summarised in 3 main tasks: 1) Environmental data collection and analysis
2) Life Cycle Impact Assessment and results interpretation 3) Methodological advances
In section 1, a preliminary analysis of the research objective is performed. Thanks to an extensive research and the interaction with the power plant’s operator, a typical geothermal power plant operation is modelled and described. Then, all the power plants currently installed and operating in Italy are analysed extensively, starting from the geothermal resource itself, to the environmental performances connected with this industrial activity, till the final use of the energy produced.
In chapter 1.1, the atmospheric emissions of all the Italian geothermal power plants are collected, carefully analysed, and statistically described. The interaction with ARPAT (Regional Agency for Environmental Protection) allowed examining the environmental sampling procedure for the evaluation of atmospheric emissions and regulatory issues. The collected data were also used to build an online database publicly accessible.
Then, in task 2, the Italian power plants’ environmental performances are assessed through the development of a LCA study based on the environmental data collected during the first phase. An in-depth analysis of the case studies and a methodological revision is performed to identify all the potential sources of errors or and possible improvements. The main goal is to obtain rigorous methodological modelling suitable for all geothermal installations to obtain reliable results regarding their environmental performance.
In chapter 2.1, direct environmental emissions are evaluated, and thanks to the large amount of data previously collected, statistically robust results are obtained. This analysis also highlights the environmental implications linked to heavy metals’ direct emissions because of their sizeable toxicity effects. It discusses the actual limitations of the Life Cycle Assessment calculation methods in detecting such emissions to evaluate their environmental burden properly. Chapter 2.2 is devoted to this topic describing different calculation methods for toxicity evaluation.
9 Thanks to this very complete and detailed picture of the geothermal field, in chapter 2.3, LCA is applied to a specific case study representing the state-of-the-art of the geothermal flash technology power plant for which a very detailed data inventory is built.
To bring more relevance and significance to the LCA methodology’s potentiality, making use of python libraries is it possible to perform advanced statistical analysis and develop simplified models that can increase the potentiality and the meaningfulness of the LCA. In chapter 3.1, an example of this approach is described using the Italian electricity mix composition and a prospective analysis of future energy mix scenarios. Then a more complex and robust approach is described in chapter 3.2, where LCA simplified models for two case studies are presented. The Bagnore 3 and 4 geothermal system in Italy and Balmatt geothermal plant in Belgium are chosen to evaluate the ability of the method to build reliable and robust models because they employ two different conversion technologies and use destinations.
10
1 ENVIRONMENTAL DATA COLLECTION AND ANALYSIS
1.1 Data analysis of atmospheric emission from geothermal power plants in Italy
Nicola Ferrara a, c, Riccardo Basosi a, b, c, Maria Laura Parisi a, b, c, *a Department of Biotechnology, Chemistry and Pharmacy, University of Siena, Via Aldo Moro 2, 53100, Siena, Italy b Institute of Chemistry of Organometallic Compounds (CNR-ICCOM), Via Madonna del Piano 10, 50019, Sesto
Fiorentino, Firenze, Italy
c Centre for Colloid and Surface Science-CSGI, via della Lastruccia 3, 50019, Sesto Fiorentino, Firenze, Italy
Under a Creative Commons license
https://doi.org/10.1016/j.dib.2019.104339
Abstract
Electric production from geothermal energy is still little exploited compared to its large potential and to the World renewable energy production from other sources. Some countries have exploited this energy source in order to enhance their transition to renewables. Today the largest geothermal energy producers in the World are New Zealand, U.S.A, Mexico, Philippines, Italy, Iceland, and, more recently, Turkey (Geothermal, 2012).
Differently from other renewable sources, geothermal energy produces impacts on the environment that are very site-specific because of the nature of the resource and its geological characteristics Bravi et al.,2010; Parisi et al.,2013. In the same way, the atmospheric emissions associated to the activity of geothermal power plants for electric or heat production (mainly CO2, H2S, NH3, Hg, CH4) are also site-specific. In fact, due to technological and geographical differences among the geothermal installations operating all over the World, it is quite impossible to identify and attribute typical emission patterns, to perform forecasts valid for multiple sites or to collect universal data. Furthermore, it is virtually impossible the comparison among technologies located in different regions or countries. Definitively, inventories of primary data, as accurate and complete as possible, are essential to correctly evaluate the peculiarities of geo-thermoelectric energy production Parisi et al.,2018. Data reported here try to fill the gap in respect to the Italian situation. To this end, a complete survey of the atmospheric emissions from all the geothermal power plants in operation in the Tuscany Region is performed. In addition to data reporting, also some statistical analysis is performed to process data and to operate a further level of simplification which averages the emissions on the basis of geothermal sub-areas.
The data collected is related to the research article “Life cycle assessment of atmospheric emission profiles of the Italian geothermal power plants” Parisi et al.,2019.
11 Specifications Table
Subject area Atmospheric emissions
More specific subject area
Atmospheric emissions from geothermal power plants based on flash and dry steam technology
Type of data Tables and figures
How data was
acquired
Environmental sampling at power plant and analytical determination through different standardised methods
Data format Raw and processed
Experimental factors
Emissions data are collected and tabulated according to a common scheme to allow an easier analysis of the information
Experimental features
Samplings are performed by means of standardised methods, as well as chemical determination of the pollutants
Data source location Tuscany Region (Italy): geothermal areas in the provinces
of Grosseto, Pisa and Siena
Data accessibility
Data are partially reported here and partially accessible in Mendeley data in order to keep it updated and provide larger details (https://doi.org/10.17632/gvpy69796n.1)
Related research
article
Parisi et al. “Life cycle assessment of atmospheric emission profiles of the Italian geothermal power plants”, Journal of Cleaner production, 234, 881–894 (2019) 1.1.1 Data
Data reported here concern the atmospheric environmental emissions generated by the activity of all the geothermal power plants in operation nowadays in Italy, more precisely in the Tuscany Region [2], [3], [4], [5]. The on-site sapling activity is performed by the Regional Agency for Environment Protection of Tuscany (ARPAT). A sketch of the most important sampling points identified by ARPAT is showed in Fig. 1. Since sampling activities are not performed at regular time intervals, in Table 1 there is reported the actual state of samplings. Actually, the information described in this paper are only referred to data reported in Table 1.
12
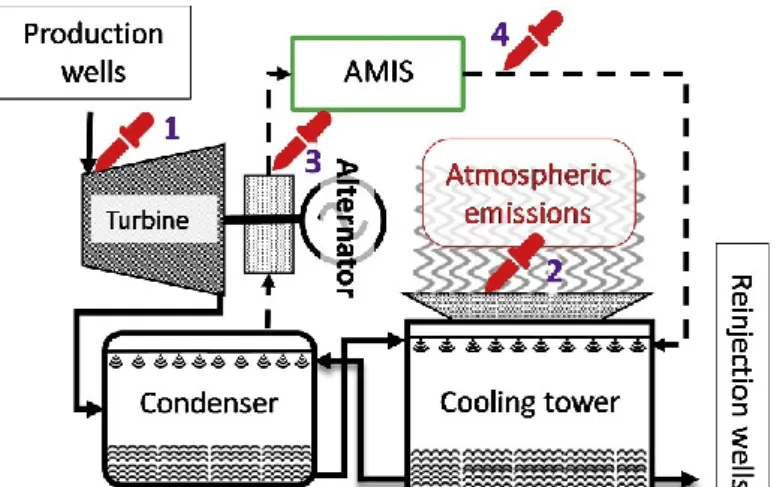
Figure 1 Sketch of the geothermal power plant configuration; the red pipettes show the most important sampling points identified by ARPAT.
Table 1The table shows the temporal distribution of sampling campaigns detailed in the ARPAT reports. F: most of the pollutants are determined; P: only few of the pollutants are determined.
20 02 2003 2004 2005 2006 2007 2008 0920 2010 2011 2012 2013 2014 2015 2016 Bagnore 3 F F F F F F F F F F F F Bagnore 4 F F Carboli 1 F F P F Carboli 2 Cornia 2 F F F Monteverdi 1 F F P Monteverdi 2 Nuova Lago F P
Nuova Lagoni Rossi F
Nuova Monterotondo F F
Nuova San Martino F F F P F
Nuova Sasso F P F Nuova Serrazzano P F Selva 1 P F Farinello F P F F F Nuova Castelnuovo P F F F Nuova Gabbro F F Nuova Larderello 3 F F F F Nuova Molinetto F F F Sesta 1 F F Vallesecolo F F F F F F Piancastagnaio 3 P P F F F F F F P Piancastagnaio 4 P P P F P Piancastagnaio 5 P F F F P F P Chiusdino 1 F F F P Nuova Radicondoli F P F Pianacce P P Rancia 1 F F Rancia 2 F F F Travale F F F P
13 Due to the large amount of data, a database containing all the sampling values has been generated and is hosted on Mendeley Data [6] The latter will be updated as soon as new emissions information will be available. In addition to raw data, a basic statistical manipulation has also been performed in order to assess data quality (Table 3 and Fig. 2) and to elaborate average emission patterns (Table 2) [2], [3], [4], [5].
14
Figure 2 Box plots describing distributions of data used. Lowest and highest whiskers represent 1.5 IQR, green box is delimited by the 1st and 3rd quartile divided by the median. Circles and stars are near and far outliers respectively, while the red cross is the mean value.
15
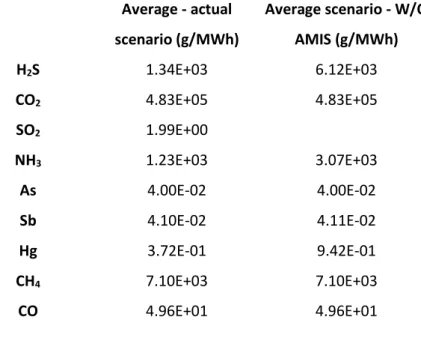
Table 2 Emissions calculated for the average scenario based on data collected from all the Italian geothermal fields.
Actual Scenario Scenario without AMIS H2S (g/h) 1.34E+03 6.12E+03 CO2 (g/h) 4.83E+05 4.85E+05 SO2 (g/h) 1.99E+00 NH3 (g/h) 1.23E+03 3.07E+03 As (g/h) 4.00E-02 4.00E-02 Sb (g/h) 4.10E-02 4.11E-02 Hg (g/h) 3.72E-01 9.42E-01 CH4 (g/h) 7.10E+03 7.12E+03 CO (g/h) 4.96E+01 4.98E+01
Produced Energy (MWhe) 1 1
1.1.2 Experimental design, materials, and methods
Raw data are collected from the public reports provided by the Regional Agency for Environment Protection of Tuscany (ARPAT). The public agency conducts several sampling campaigns each year to fulfil the regulation about the atmospheric emissions control of the power plants [7].
The analysis is performed in compliance with international and approved national standards. This methodological approach ensures the robustness and validation of data [8], [9], [10], [11]. Fig. 1 describes a simplified scheme of a hydrothermal flash geothermal plant operating in Tuscany: the red pipette are the sampling points identified by ARPAT [6], [12].
The sampling point n° 1 is used to record chemo-physical parameters of the entering fluids (pH, temperature, mass flow, pression, etc.) as well as the chemical composition (H2S, CO2, CH4, NH3, Hg, As, Sb). At the sampling point n°2, in the area of the evaporative tower (in this section the extracted gaseous fraction, which is conducted into the towers, is deviated to avoid doubling the emissions), the emissions of pollutants dissolved into the drift are determined (H2S, NH3, Hg, As, Sb), as well as chemo-physical parameters (pH, air temperature, wet bulb temperature, air mass flow, etc). Sampling points n°3 and 4° only account for the gaseous fraction of the emissions; the pollutants determined in this sampling points are H2S, CO2, CH4, NH3, SO2 (resulting from the catalytic oxidation of H2S) and Hg. As the abatement system (AMIS) is employed for the gaseous phase, the chemical determination is performed before and after the process to determine the abatement ratio [13].
16 The complete dataset of atmospheric emissions is loaded and publicly available in Mendeley Data [6]. Information stored in the repository will be continuously updated as soon as new sampling will be available, in order to expand and keep updated the environmental information disseminated by ARPAT.
17
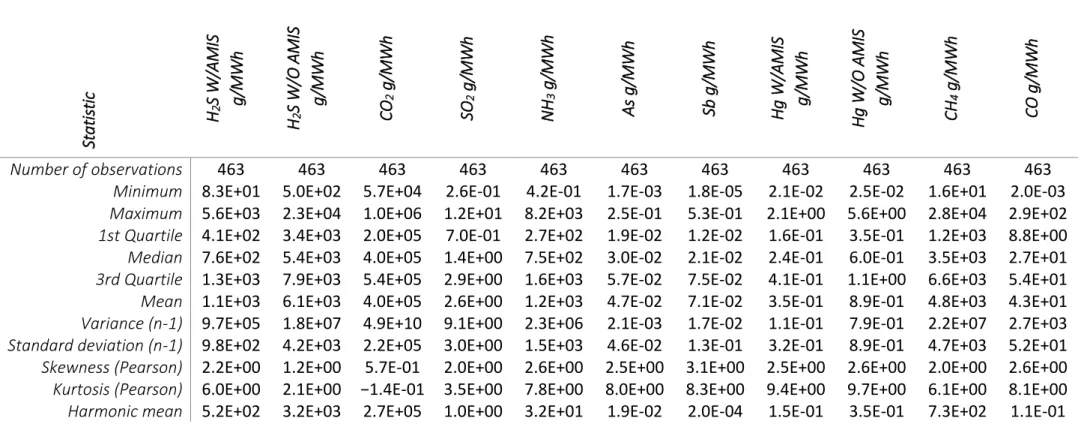
Table 3 Statistical descriptors of the data used.
St a tis tic H2 S W /A M IS g /M W h H2 S W /O A M IS g /M W h CO 2 g /M W h SO 2 g /M W h NH 3 g /M W h A s g /M W h Sb g /M W h H g W /A M IS g /M W h H g W /O A M IS g /M W h CH 4 g /M W h C O g /M W h Number of observations 463 463 463 463 463 463 463 463 463 463 463
Minimum 8.3E+01 5.0E+02 5.7E+04 2.6E-01 4.2E-01 1.7E-03 1.8E-05 2.1E-02 2.5E-02 1.6E+01 2.0E-03
Maximum 5.6E+03 2.3E+04 1.0E+06 1.2E+01 8.2E+03 2.5E-01 5.3E-01 2.1E+00 5.6E+00 2.8E+04 2.9E+02
1st Quartile 4.1E+02 3.4E+03 2.0E+05 7.0E-01 2.7E+02 1.9E-02 1.2E-02 1.6E-01 3.5E-01 1.2E+03 8.8E+00
Median 7.6E+02 5.4E+03 4.0E+05 1.4E+00 7.5E+02 3.0E-02 2.1E-02 2.4E-01 6.0E-01 3.5E+03 2.7E+01
3rd Quartile 1.3E+03 7.9E+03 5.4E+05 2.9E+00 1.6E+03 5.7E-02 7.5E-02 4.1E-01 1.1E+00 6.6E+03 5.4E+01
Mean 1.1E+03 6.1E+03 4.0E+05 2.6E+00 1.2E+03 4.7E-02 7.1E-02 3.5E-01 8.9E-01 4.8E+03 4.3E+01
Variance (n-1) 9.7E+05 1.8E+07 4.9E+10 9.1E+00 2.3E+06 2.1E-03 1.7E-02 1.1E-01 7.9E-01 2.2E+07 2.7E+03
Standard deviation (n-1) 9.8E+02 4.2E+03 2.2E+05 3.0E+00 1.5E+03 4.6E-02 1.3E-01 3.2E-01 8.9E-01 4.7E+03 5.2E+01
Skewness (Pearson) 2.2E+00 1.2E+00 5.7E-01 2.0E+00 2.6E+00 2.5E+00 3.1E+00 2.5E+00 2.6E+00 2.0E+00 2.6E+00
Kurtosis (Pearson) 6.0E+00 2.1E+00 −1.4E-01 3.5E+00 7.8E+00 8.0E+00 8.3E+00 9.4E+00 9.7E+00 6.1E+00 8.1E+00 Harmonic mean 5.2E+02 3.2E+03 2.7E+05 1.0E+00 3.2E+01 1.9E-02 2.0E-04 1.5E-01 3.5E-01 7.3E+02 1.1E-01
18 1.1.3 Data processing
Basic data processing is performed in order to average the emissions and obtain more general descriptions.
For each power plant the median of the samplings for each pollutant is calculated, then the g/h values are converted to g/year and weighted over the average electricity produced [1] to obtain emissions expressed as g/MWh. In case of emissions which depend on the abatement system (AMIS), the annual emission is composed by two fractions which reflect the emissions with and without the abatement system, respectively multiplied by the amount of yearly hour in which the AMIS is working or not. The sum of the two fractions (g/year) is weighted over the yearly electricity produced to obtain emissions expressed as g/MWh. This process was applied for Hg and H2S, which are the compounds treated by the AMIS, for all the power stations. The spreadsheet loaded in Mendeley Data contains the formula used to perform the calculation. The power plants average emissions are unified by area according to geographic information reported in the data repository.
Further simplification can be performed by averaging the emissions of all the power plants as reported in Table 2. Also, two different scenarios are calculated: one representing the actual emission (actual scenario) and another which corresponds to the emissions that could be obtained if no abatement system were employed (scenario without AMIS).
1.1.3.1 Statistical description
All the collected data was statistically analysed to characterise the distribution and the errors connected to the database built. Table 3 and box plots in Fig. 2 report statistical indicators which describe the 463 observations collected at the time of the paper preparation.
The emissions obtained with the abatement system is indicated as W/AMIS, while the non-abated pollutants flow’s is indicated W/O AMIS.
1.1.4 Funding
This research did not receive any specific grant from funding agencies in the public, commercial, or not-for-profit sectors.
19 1.1.5 Acknowledgments
Authors acknowledge MIUR Grant - Department of Excellence 2018-2022. NF thanks COSVIG for contributing to his PhD grant. Collaboration of ARPAT in collecting data is gratefully acknowledged.
1.1.6 Conflict of interest
The authors declare that they have no known competing financial interests or personal relationships that could have appeared to influence the work reported in this paper.
1.1.7 References
[dataset] Ferrara N., Parisi M.L., Basosi R., (2019), “Emissions data from geothermal energy exploitation in Italy”, Mendeley Data, V1, http://dx.doi.org/10.17632/gvpy69796n.1 [1] EGEC Geothermal, 2018. EGEC Market Reports for years: 2011; 2012; 2013-2014; 2015;
2016; 2018.
[2] Bravi, M., Parisi, M.L., Tiezzi, E., Basosi, R., 2010. Life Cycle Assessment of advanced technologies for photovoltaic panels production. International Journal of Heat and Technology 28 (2), 133–139. DOI:10.18280/ijht.280217
[3]Parisi, M.L., Maranghi, S., Sinicropi, A., Basosi, R. 2013. Development of dye sensitised solar cells: A life cycle perspective for the environmental and market potential assessment of a renewable energy technology. International Journal of Heat and Technology, 31 (2), 143–148. DOI: 10.18280/ijht.310219
[4] Parisi, M.L., Basosi, R., 2018. Geothermal Energy Production in Italy: An LCA Approach for Environmental Performance Optimization, in: Basosi, R., Cellura, M., Longo, S., Parisi, M.L. (Ed.), Life Cycle Assessment of Energy Systems and Sustainable Energy Technologies. Springer International Publishing, p. 184. https://doi.org/10.1007/978-3-319-93740-3
[5]Parisi M.L, Ferrara N., Torsello L., Basosi R., 2019. Life cycle assessment of atmospheric emission profiles of the Italian geothermal power plants, Journal of Cleaner production, in press.
20 [6] Ferrara, N., Parisi M.L., Basosi R. 2019, Emissions data from geothermal energy exploitation
in Italy, Mendeley Data, V1, http://dx.doi.org/10.17632/gvpy69796n.1
[7] ARPAT Tuscany Regional Agency for Environmental Protection (“in Italian”), 2018. Geothermal Reports (‘in Italian’) 2001-2003; 2004; 2005; 2006; 2007-2008; 2009; 2010;
2011; 2012; 2013; 2014; 2015; 2016;.
http://www.arpat.toscana.it/documentazione/report/report-geotermia
[8] ARPAT, Tuscany Regional Agency for Environmental Protection (“in Italian”), Geothermal emissions control (‘in Italian’), http://www.arpat.toscana.it/temi-ambientali/sistemi-produttivi/impianti-di-produzione-di-energia/geotermia/controllo-delle-emissioni, (Accessed May 16, 2019)
[9] IGG-ICCOM, 2017. Sampling and analysis procedure for the determination of mercury leaving cooling towers in geothermal power stations IGG-ICCOM/CNR-3 METHOD (M3), https://doi.org/10.13140/RG.2.2.32982.34889
[10] UNI EN, 2003. UNI EN 13211:2003.
[11] US EPA, 2017. US E.P.A METHOD 29, Determination of metals emissions from stationary sources.
[12] DiPippo, R., 2015. Geothermal Power Plants: Principles, Applications, Case Studies and Environmental Impact: Fourth Edition, Geothermal Power Plants: Principles,
Applications, Case Studies and Environmental Impact: Fourth Edition.
https://doi.org/10.1016/C2014-0-02885-7
[13] Bonciani, R., Lenzi, A., Luperini, F., Sabatelli, F., 2013. Geothermal power plants in Italy: increasing the environmental compliance, art: ENV-03, in: European Geothermal Congress, Pisa, 3 -7 June 2013
21
2 LIFE CYCLE
IMPACT
ASSESSMENT
AND
RESULTS
INTERPRETATION
2.1 Life cycle assessment of atmospheric emission profiles of the Italian
geothermal power plants
Maria Laura Parisi a, b, d*, Nicola Ferrara a,b, Loredana Torsello c, Riccardo Basosi a,b,d*
a Department of Biotechnology, Chemistry and Pharmacy, University of Siena, Via Aldo Moro 2, 53100 Siena, Italy. b Institute of Chemistry of Organometallic Compounds (CNR-ICCOM), Via Madonna del Piano 10, 50019 Sesto
Fiorentino, Italy
c Geothermal Areas Development Consortium (COSVIG), Via Vincenzo Bellini 58,50144Firenze, Italy d Centre for Colloid and Surface Science-CSGI, via della Lastruccia 3, 50019 Sesto Fiorentino, Firenze, Italy
https://doi.org/10.1016/j.jclepro.2019.06.222
Highlights
• Atmospheric direct emissions profile calculated with LCA approach. • Sub-regional clustering of Italian geo-thermoelectric power plants.
• AMIS sharply reduces impacts on Amiata region but is less effective in other areas. • Emissions through cooling tower represent the largest contribution to LCA score. • Hg impacts show large uncertainty, LCIA methods need to fit better the case. Abstract
After nearly a decade of only small development in capacity in deep geothermal sector in Europe, in recent years a resurgence of interest in geothermal power and the use of innovative technologies to increase and better exploit geo-thermoelectric generation has stolen the limelight from the scientific community. Differently from other types of energy sources, the environmental impacts determined by geothermal exploitation are extremely dependent on the geographical location. Life Cycle Assessment offers a powerful methodological approach for the investigation of the environmental footprint of power generation systems.
22
Focusing on an unprecedented system-modelling approach for the investigation of an environmental impacts analysis of geo-thermoelectric activity in the Tuscany Region, Italy, in this work we perform a comprehensive environmental impact assessment for the calculation of atmospheric emissions profiles connected with the operational phase of the power plants. A clustering of all the geothermal installations in operation nowadays is performed by considering geographical representativeness This allows the identification of regional geothermal subareas. Moreover, an extensive data processing analysis is implemented with the aim of reconciling the great variability found among data collected. Results demonstrate that the efforts undertaken by the operator of the geothermal power plants to limit the impact of emissions, through abatement systems like AMIS, are quite effective. Indeed, in areas where mercury and ammonia concentration in fluids constitute a problem to deal with, nowadays the emissive patterns result comparable to the other ones. Notwithstanding, mercury and ammonia emissions, mainly emitted through the cooling towers, still represent a critical problem for all the geothermal fields. On the basis of our findings, we conclude that potential chemical interactions and environmental impacts related to the variety of the compounds emitted should be object of future research and a further effort to minimise them.
Abbreviations
AMIS Abatement System for Mercury and Hydrogen Sulphide EGS Enhanced Geothermal System
g/h Grams per Hour
g/MWh Grams per Mega Watt hour
g/y Grams per Year
GHG Greenhouse Gas
GWe Giga Watt electricity GWh/y Giga Watt hour per year LCA Life Cycle Assessment LCI Life Cycle inventory
LCIA Life Cycle impact Assessment MWe Mega Watt electricity
MWhe Mega Watt hour electricity
NCG Non-Condensable Gas
ORC Organic Rankine Cycle
W/ With
W/O Without
2.1.1 Introduction
Geothermal energy has been perceived as a convenient source for electric energy production only on a local scale so far, as just few areas in the World have enough geothermal potential
23 to exploit it. Italy, Iceland, some U.S. States, Indonesia, Philippines, New Zealand are some of the countries that have already benefited from its exploitation. In recent years things have changed, and geothermal energy is now considered as one of the most promising renewable energy sources for producing electricity and heating. This is also proven by significant investments that are being made at international level: in fact, new technologies could allow the exploitation of reservoirs that would have been impossible to use in a cost-effective way until now (very deep drilling, binary cycle for low temperature fields, Enhanced Geothermal System). So far, environmental concerns perceived by the community have been one of the important barriers especially for deep geothermal market development. In this context, nowadays decision-makers require more reliability in the environmental performance assessment of the power plants. In fact, differently from other types of energy sources, the environmental impacts determined by geothermal exploitation are extremely dependent on the geographical location. Concerning the global panorama of the geo-thermoelectric market, traditional hydrothermal flash power plants still dominate in terms of installed capacity all over the World, because of the greater electrical producibility that such technology can generate compared to others. In fact, according to the World Geothermal Congress survey, in 2015 only 1.8 GWe of the total 12.6 GWe world installed capacity was represented by binary power plants, while innovative enhanced geothermal technologies (EGC) were just not representative. Moreover, concerning the produced electrical geothermal energy in that year, only 12% was obtained from binary power plants. (Bertani, 2016). Nevertheless, the multiple technological solutions available today have put geothermal energy into renewed attention by the scientific community. Many topics have been investigated, from countries’ geothermal potential to technical innovations to the environmental impact of these power plants. This latter issue is the one that in Italy is becoming more explored and even more discussed for the social impact on the population involved (Borzoni et al., 2014; Pellizzone et al., 2019, 2017). Historically, Italy is the country that first exploited this renewable energy, in fact, it was the major geothermal producer in the World in 2005 (Bertani, 2011). Recently, many countries have invested in this energy source in Europe, sometimes overtaking Italy: for example, nowadays Turkey is the leader country for installed capacity with 1.3 GWe (EGEC, 2018). Actually, the possibility to increase the geothermal production largely depends on the perception of the community and the determination of decision-makers requiring more reliability in the environmental performance assessment of the power plants. Differently from
24 other types of energy sources, the impacts determined by geothermal exploitation are extremely dependent on the geographical location, especially for what concerns the operative phase and the reservoir exploited which determine the peculiarity of the power plant’s emission profile.
Life Cycle Assessment (LCA) is acknowledged as the most powerful methodological tool for the evaluation of the environmental performances of power generation systems (Peng et al., 2013, Turconi et al., 2013, Parisi et al. 2013, Bravi et al., 2010; Brown and Ulgiati, 2002) and for the investigation of potential impacts associated with new projects prior their construction, thus allowing definition of the best strategies for mitigation of environmental emissions or even annihilation. Indeed, there are many studies available in the scientific literature reporting detailed life cycle inventory data enabling for an accurate description of the investigated systems and allowing also for the development of sophisticated parametrised model and predictive LCAs (Pehl et al., 2017, Padey et al., 2013, 2012). In the field of geothermal energy, the scientific literature is lacking in LCA studies providing primary data. In fact, just few studies on geothermal power plants are available and the studies focused on the assessment of the environmental profile of working power plants are even fewer (Bravi and Basosi, 2014, Buonocore et al., 2015, Karlsdóttir et al., 2015, Parisi and Basosi, 2018). Most of the LCA studies on geothermal systems employ data coming from the literature or indirect and not pertinent secondary data (Marchand et al., 2015, Martínez-Corona et al., 2017). Such scarcity of specific information is also due to the fact that geothermal exploitation can be performed with different technologies (flash, dry steam, binary) and for different purposes (electricity, heat or both) (Martín-Gamboa, M et al., 2015, Ruzzenenti et al., 2014), making the collection of primary data much more difficult compared to other power generation systems. Several authors have also performed reviews (Bauer et al., 2008, Bayer et al., 2013, Menberg et al., 2016) and harmonisations (Asdrubali et al., 2015, Sullivan et al., 2012, 2010) of previous LCA studies on geothermal energy production in which they clearly underline the scarcity of accurate data and variability of information that prevent the definition of reliable eco-profiles of geothermal systems (Lacirignola et al., 2014, Lacirignola et al., 2017).
The analysis proposed in this work tries to increase the knowledge and reduce data scarcity for the geo-thermoelectric activity in Italy by analysing the emission data available for all geothermal power plants operating in the Tuscany Region in a range of 10 years of analytical
25 determinations collected by ARPAT (Tuscany Regional Agency for Environmental Protection). Focusing on an unprecedented system-modelling approach for the investigation of an environmental impacts analysis of geo-thermoelectric activity, we perform a comprehensive assessment of atmospheric emissions profiles representative of the actual situation in all the Tuscany geothermal areas. An extensive data processing analysis is implemented with the aim of reconciling the great variability found among data collected during the whole time series. Moreover, a clustering of geothermal installations in the Tuscany Region is performed by considering geographical representativeness This allows identification of regional geothermal subareas and calculation of environmental footprints connected to the operational phase of all the power plants in operation nowadays. As pointed out by the NREL report (Eberle et al., 2017) in which a systematic review of 180 papers on LCA of geothermal power plants worldwide reveals how the field location heavily influences the greenhouse gases’ (GHGs) emissions, the large variety of environmental footprint calculated for geo-thermoelectric power plants is significant. Likewise, the technology implemented for the exploitation of geothermal energy deeply characterises the eco-profiles of power plants, as showed in the same report by disaggregating the contributions to the various life cycle phases.
This study is in no way intended to be an ecotoxicological review, as results obtained from an LCA study are not suitable to be used for that purpose. The authors’ goal is to evaluate the potential atmospherics environmental impact generated by the geo-thermoelectric activity in Tuscany, employing all the available information, thus extending the analysis published by Bravi and Basosi (Bravi and Basosi, 2014) in terms of geographic dimension and data quality on the basis of the availability of larger amount of data in the historical series. To this aim, a rigorous statistical approach is adopted in order to obtain precise environmental profiles. In addition, data presented here are a novel addition to the scientific literature of the geothermal field. The purpose is to obtain the most complete source of information about the emissions generated in atmosphere by deep geothermal exploitation of electric power generation plants in Italy, which nowadays is probably the most long-established region for geo-thermoelectric energy source in the EU. The different geochemical characteristics of the fields cause the impacts of this energy source strongly dependent on the location, in addition to the technology employed. Thus, it is hard to find estimated emissions which reflect the real emission profile and management activities of a geothermal power station. A current
26 assessment of the concise and detailed emission profile of such productive systems is essential to ensure sustainable development of these technologies, especially considering the social aspects involved in the projects under development (Dumas and Angelino, 2016). Also, the aim of this study is to propose a protocol for the evaluation of the environmental impact related to the atmospheric emissions of geothermal exploitation that could be useful to build up a common framework for all the actors involved in the development of this energy source. 2.1.2 Materials and methods
In this work, the LCA approach is implemented according to the ISO 14040 (International Standards Organization, 2010) and ISO 14044 (The International Standards Organisation, 2006) standards, next to the more completely elaborated ILCD Handbook Guidelines (European Commission - Joint Research Centre - Institute for Environment and Sustainability, 2010). The methodology is composed of four phases:
• Definition of the goal and scope of the system: it includes the description of the model system and the purpose of the study, along with all the methodological key elements (functional unit, system boundaries, cut-off rules, data quality, etc) that characterise the analysis and a detailed explanation of all the assumptions made to guarantee clarity, transparency and reliability of the results;
• Life Cycle Inventory, LCI: it lists and quantifies all the input and output flows of energy and materials and releases to the environment;
• Life Cycle Impact Assessment, LCIA: impacts generated by the system are assessed through the application of an environmental impact calculation method that translate emissions, resources and energy use into a limited number of indicators;
• Life Cycle Interpretation: correlation among inventory results and impact analyses allows identification of the relevant technical information and critical points that can be employed to outline useful conclusions and recommendations to maximise the global energetic-environmental efficiency of the LCA case system in accordance with scopes and goals of the assessment.
2.1.2.1 Goal and scope definition
The objective of this study is the assessment, in a life cycle perspective, of the environmental impacts related to the exploitation of deep geothermal energy for electricity production in Italy. More specifically, the study is focused on the geothermal area located in Tuscany Region where the majority of the 916 MW Italian geo-thermoelectric plants are installed. Furthermore, the study considers all the currently operative power plants to outline
sub-27 regional eco-profiles connected with the geo-thermoelectric activity. The findings of such an overarching study are intended to be used as a basic information for a sustainable development and exploitation of the Tuscan geothermal areas, while addressing the environmental issues concerning such kind of energy source.
2.1.2.1.1 System boundaries and functional unit
The life cycle of a geothermal power plant includes (i) the activity for the identification of the geothermal field, (ii) the drilling operations to obtain the production and injection wells, (iii) the building and commissioning of the power station and its connection to the wells through pipelines for the transportation of the geothermal fluid extracted as well as the fluid that needs to be reinjected after the utilisation and (iv) the decommissioning of all the infrastructures (power plant and wells). The outcomes of a previous study (Buonocore et al., 2015), that was focused on the whole life cycle of a power station located in Tuscany, showed that the major environmental impacts are determined by the operational phase for Flash technology, unlike other Enhanced Geothermal System (EGS) and Organic Rankine Cycle (ORC) plants installed in other countries (for example in EU Germany, Belgium, Netherlands). The analysis performed in this work implements a gate-to-gate approach focused on the atmospheric emissions generated by the exploitation of fluids and produced during the operational phase of the geo-thermoelectric industry. In Figure 1, a sketch of the system boundaries defined in this study is reported.
28 The atmospheric emissions generated by geothermal exploitation using flash power plants can be divided into two main fractions, one gaseous and the other dissolved into the geothermal fluid. The gaseous fraction is also identified as non-condensable gases (NCGs) as they cannot be condensed at the same conditions of the geo-fluid. These gases need to be extracted in order to avoid accumulation of NCGs within the condenser and progressive loss of vacuum conditions, as this is the fundamental state to keep the power plant in operation. Gases commonly extracted from geothermal fluids are carbon dioxide (CO2), hydrogen sulphide (H2S), methane (CH4), ammonia (NH3), hydrogen (H2), nitrogen (N2), argon (Ar) and radon (Rn) and gaseous mercury (Hg) (Bertani e Thain, 2002; Fridriksson et al., 2016). The quantity of these gases is extremely dependent on the field exploited and it is possible to observe very large variations among the World’s geothermal reservoir. Furthermore, in the geo-fluid phase other chemical species are found such as arsenic (As), antimony (Sb), boric acid (H3BO3), lead (Pb), selenium (Se), chromium (Cr), cadmium (Cd), nickel (Ni), copper (Cu), manganese (Mn) and vanadium (V).
The impact connected to the maintenance operations of the power plant, such as the periodic substitution of the turbine or the change of the lubrication oil, were not considered. In the same way, processes concerning the maintenance of the wells, like the activities intended to recover the flow capacity lost over the year (stimulation), were not considered. The assumption is that all the burdens connected with these activities are virtually negligible compared to the environmental impacts determined by the direct emissions of a typical condensing flash power plant, like the ones operating in Tuscany. As the main product of the considered geo-thermoelectric power plants is not heat but electricity, we choose as the functional unit 1 Megawatt/hour (MWhe) generated in the various plants by conversion of the geothermal energy.
2.1.2.1.2 Data quality and collection
Data concerning the atmospheric emissions generated by all the 34 power plants currently operating in Tuscany have been collected from the geothermal areas monitoring annual reports published by ARPAT. The timeframe considered in this study ranges from the beginning of the sampling campaign started by ARPAT in 2002 up to 2016, referring to the last report publicly available while this study was in preparation (ARPAT Tuscany Regional Agency for Environmental Protection (“in Italian”), 2018). Measurement data are based on sampling
29 of the emission materials from the geothermal power plant’s cooling towers in defined period of the year. The use of standardised methods for the analytical determination of substances (IGG-ICCOM, 2017; UNI EN, 2003; US EPA, 2017) ensure for the accuracy of the data. Moreover, in its reports, ARPAT provides emissions information concerning all the sampling points. This additional characterisation allowed us to process and interpret data with higher accuracy, in respect to the knowledge of the aggregated data. The information was then carefully analysed to identify typical patterns and to elaborate a procedure ensuring the lowest error margin possible during the data rationalisation process.
2.1.2.1.3 Geography and configuration of power plants system
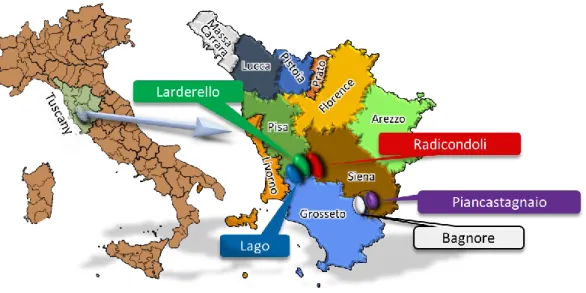
Nowadays, there are 34 power plants in Tuscany in an area of about 330 Km2 displaced among the Provinces of Grosseto, Pisa and Siena. In 2018 the geothermal electricity production was about 6500 GWh. The geothermal geographic zones in Tuscany are usually dispersed in four areas as shown in Fig.2: Larderello (South-East of Pisa Province), Lago (South of Pisa Province), Radicondoli (West of Siena Province) and the area of Mount Amiata in the southern Tuscany (East of Grosseto and South-West of Siena). The analysis of data has shown that the area of Mount Amiata presents two different geothermal fields with distinctive profiles in terms of atmospheric emissions. In fact, they are located on two sides of the mountain generating very different emission trends. Due to this, a further division of this subarea must be considered, namely Bagnore and Piancastagnaio, one on the Grosseto side and the other one on the Siena side, respectively.
30 Most of the power plants were built by ENEL and all of them are currently operated by ENEL GP (ENEL GreenPower) which developed a smart modular system to achieve the highest technical reliability. In fact, every power plant is composed by one or more standardised productive unit (of 20, 40 or 60 MWe each) which shares large part of the system component’s (compressor, condenser, turbine, etc.). This approach allows the operator to use the same components for several reservoirs with different characteristics. The result is the reduction of the operating cost since the plant unavailability can be considerably reduced (DiPippo, 2015; Parri et al., 2013). From the methodological point of view, this technological configuration allowed our approach to reduce the variability of data among the geothermal areas considered, thus obtaining a more accurate analysis.
In this framework, usually one production well can serve different power stations, thanks to a very well-developed “steam network”. This allows the operator to direct the flow to the power station which presents higher efficiency or redirect the steam to the active power plants during maintenance operations of some others. All the reservoirs exploited are recharged by using brine reinjection wells to maintain the renewability of the resource over the years; this is also necessary for maintaining the pressure of the reservoir within certain values to avoid dangerous geological side effects connected with the geothermal sites’ exploitation (seismic activity, subsidence). The success of this managing strategy is confirmed by the fact that the area of Larderello has been exploited for electric production since 1905, and more intensively since ’80s, without any significant loss (Cappetti et al., 1995; Minissale, 1991; Kaya et al, 2011). In recent years, power generation is even increased thanks to the implementation of new technological solutions allowing the exploitation of geothermal fluids that were impossible to use with previous systems because of their corrosive nature (Parri et al., 2013).
All the power plants present the same configuration if the capacity is the same. The power plant’s working structure is mainly divided between the Non-Condensable Gases line (NCGs) and the fluids line, the samplings carried out by ARPAT were performed on both the lines. Figure 3 shows the basic scheme of the ENEL power plants and some of the sampling points identified by ARPAT corresponding to the data used in this work.
31
Figure 3 Basic scheme of the geothermal power plant configuration implemented by ENEL. This configuration is employed in 20 MW and 60 MW productive units in operation nowadays. The red pipettes show the most important sampling points identified by ARPAT. As the recovery of heat is not an issue of this paper, the scheme has been simplified accordingly.
The fluids coming from the production wells are directed to the turbine where they expand generating power. After this process the fluid is condensed in a direct contact condenser. In this component the already cooled geothermal fluid is used to cool down the fluid overflowing from the turbine. Then, the condensate is pumped at high pressure to the cooling tower where it is sprayed in counter flow in respect to the air flow. The cooled fluid collected here is then employed in the condenser to cool the fluid overflowing from the turbine. The NCGs must be separated from the fluid to not compromise the process as they can accumulate in the condenser obstructing the cycle. Therefore, NCGs are extracted from the condenser by using compressors directly connected to the turbine and alternator axles: gases extracted in this way are sent to the AMIS (i.e., the abatement system for mercury and hydrogen sulphide) before dispersing them into the atmosphere through the cooling towers. The AMIS is composed by three main components: an absorber made of Selenium or activated Carbon, to remove the gaseous Hg, a catalytic reactor to oxidise the H2S to SO2, and a scrubber where the SO2 produced by the redox reaction is washed from the gas by using the fluids collected in the cooling tower (Baldacci et al, 2005). Since the geothermal fluid naturally contains NH3, the basic behaviour allows an efficient washing and neutralisation of the SO2. The treated gas is then sent to the cooling tower where it is dispersed into the atmosphere together with the drift (small drops of geothermal water).
32 The direct emissions from these geo-thermoelectric plants to the atmosphere take place at the cooling tower and are differentiated into two distinct sources: the NCGs line and the drift. The atmospheric emissions connected with the geo-thermoelectric activity are then directly dependent on the chemical composition of the geo-fluid of the specific site, and thus depends on the geological characteristics of the geothermal field. This is the reason why the emissions originating from different power plants - although located very close in a sub-regional area - can be very different from each other.
2.1.3 Life cycle inventory analysis
This study is focused on the potential environmental impact associated with the emission of NGCs that are found in greater concentration in the geothermal fluid (CO2, CH4, NH3, H2S) as well as gaseous Hg. In addition, also potential impacts associated to pollutants dissolved in the drift are investigated. This fraction is characterised by higher concentration of NH3 and its salts, Hg, As, Sb, H3BO3, and other metals in traces (Pb, Se, Cr, Cd, Ni, Cu, Mn, V). All data regarding these chemical species were normalised with respect to the functional unit using the value of global electric production.
The need to process the original data reported by ARPAT arises from the fact that emissions detected over the years show an appreciable level of variability in their analytical determination (i.e., remarkable differences for some substances can be found in the various sampling campaigns). These differences are probably caused by technical difficulties related to some sampling procedures, such as the determination of Hg, due to the very low concentration involved and to the complex matrix present at the sampling point. Another source that determines the great variability observed could be linked to the technical characteristics of the different power stations. In fact, for different geochemical situations, the performances and characteristic emissions of the power plants appear very differentiated and largely affected by the geothermal field and, definitively, by their geographical positioning. For all these reasons, the intent of this work is to analyse the emissions of the geothermal power plants by identifying areas with common characteristics from a geographical point of view. Table 1 reports all the parameters collected and used to accomplish the analysis.
Table 1 List and description of all the parameters used to model the atmospheric emission scenarios of the geothermal power plants.
33
PARAMETER SUBSTANCE DEFINITION
Mass Flow H2S g/h Power Plant Emission with AMIS
Mass Flow H2S g/h Power Plant Emission without AMIS
Mass Flow CO2 g/h Power Plant Emission
Mass Flow SO2 g/h Power Plant Emission
Mass Flow NH3 g/h Power Plant Emission with Abatement System
Mass Flow NH3 g/h Power Plant Emission without Abatement System
Mass Flow As g/h Power Plant Emission
Mass Flow Sb g/h Power Plant Emission
Mass Flow Hg g/h Power Plant Emission with AMIS Mass Flow Hg g/h Power Plant Emission without AMIS
Mass Flow CH4 g/h Power Plant Emission
Mass Flow CO g/h Power Plant Emission
Central Parameter MWe Load during the sampling
Central Parameter t/h Supply Fluid Mass Flow during the sampling Central Parameter hour Yearly Power Plant Out of Service Central Parameter hour Yearly AMIS Out of Service Electric production MWh/y Yearly electric production
The knowledge of all the information reported in Table 1 for each operating power plant allowed to draw a complete and detailed picture concerning the actual situation regarding the atmospheric emissions and the typical working parameters for each power plant. As mentioned above, the collection of data presented some problems regarding the expected uniformity over time. To overcome this problem, it was decided to create a typical scenario that might represent the most common emissive profile based on the consistent amount of data gathered.
This profile has been generated for each power station, then a geothermal field clustering criterion was selected (see related Data in Brief article).
This data processing allows to minimise the irregularities observed. Moreover, the impact analysis implemented in this way turns out to be not limited to a definite sampling campaign, as presented in previous studies (Bravi and Basosi, 2014; Buonocore et al., 2015), but it is representative of a typical outline accounting for all the variables involved in the geothermal energy exploitation. As for some power stations there is a lack of observed data, the scenarios are incorporated by subarea because data analysis shows good affinity among productive units in the same territory. Therefore, this process is suitable and reliable to use all the collected information. In addition, since there are several power stations installed on a
34 relatively limited surface, it is essential to consider the whole area to obtain a correct evaluation and a good representation of the emissions profile.
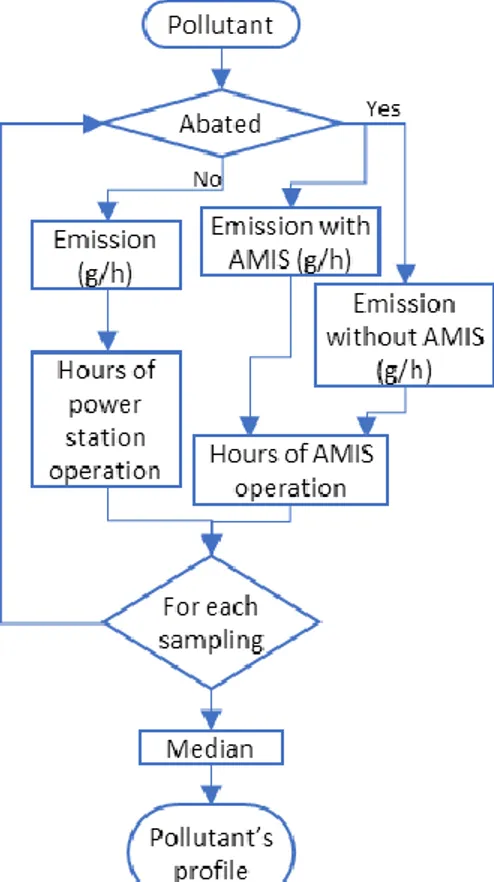
Figure 4 Logical steps followed to obtain the emission profile for each pollutant.
The profile obtained for each plant is expressed as mass flow emission for each substance, multiplied by the yearly hours of operation. For pollutants processed by the abatement system (H2S, Hg and NH3 in some cases) the emission value is obtained considering the number of hours in a year in which the system is out of work. Thus, the final value, expressed in yearly mass flow (g/year), is composed by two portions: one comes from the determinations with the AMIS installed, the other is composed by the determinations without the AMIS installed, each weighted by the correspondent amount of operation. The logical steps of this procedure are sketched in Figure 4. To average the values among the various samplings the median value is used in place of the average, due to the non-normal distribution of the values (Ferrara et al., 2019).
2.1.3.1 Scenario modelling
According to the clustering criterion selected to identify geothermal fields, several scenarios describing each geothermal area were created. Such sub-regional environmental scenarios are intended to give an accurate description of the actual geothermal exploitation activity in