Policy Research Working Paper
9639
Does Gender Equality in Labor
Participation Bring Real Equality?
Evidence from Developed and Developing Countries
Federica Alfani
Fabio Clementi
Michele Fabiani
Vasco Molini
Enzo Valentini
Poverty and Equity Global Practice
April 2021
Public Disclosure Authorized
Public Disclosure Authorized
Public Disclosure Authorized
Abstract
The Policy Research Working Paper Series disseminates the findings of work in progress to encourage the exchange of ideas about development issues. An objective of the series is to get the findings out quickly, even if the presentations are less than fully polished. The papers carry the names of the authors and should be cited accordingly. The findings, interpretations, and conclusions expressed in this paper are entirely those of the authors. They do not necessarily represent the views of the International Bank for Reconstruction and Development/World Bank and
Policy Research Working Paper 9639
Drawing on various macro- and micro-data sources, the authors present robust evidence of an inverted U-shaped relationship between female labor force participation and inequality. Overall, female labor force participation is found to have a strong and significant dis-equalizing impact in at least three groups of developing countries with relatively low initial levels of participation. A decile-level analysis
shows that female labor force participation has higher levels of returns among top deciles compared with the lower deciles in the developing countries analyzed. This evidence focuses attention on the importance of developing policies specifically targeting women in lower deciles of the income distribution.
This paper is a product of the Poverty and Equity Global Practice. It is part of a larger effort by the World Bank to provide open access to its research and make a contribution to development policy discussions around the world. Policy Research Working Papers are also posted on the Web at http://www.worldbank.org/prwp. The authors may be contacted at [email protected].
Does Gender Equality in Labor Participation Bring Real Equality?
Evidence from Developed and Developing Countries
∗Federica Alfani Fabio Clementi Michele Fabiani Vasco Molini
The World Bank Washington DC, USA [email protected] University of Macerata Macerata, Italy [email protected] University of Macerata Macerata, Italy [email protected]
The World Bank Rabat, Morocco [email protected] Enzo Valentini University of Macerata Macerata, Italy [email protected]
Keywords: Female labor force participation; inequality; gender equality; developing countries. JEL classification: C26, E24, J13, O57
∗ The authors acknowledge financial support from the World Bank. We thank colleagues from the Haut Commissariat
au Plan (HCP) of Morocco for excellent data preparation. We also thank Gordon Betcherman, Gladys Lopez-Acevedo, Marco Ranzani and Johannes Hoogeveen for comments and suggestions on an earlier version of the manuscript. Of course, we are the sole responsible for all possible errors the paper may contain.
1.
Introduction
Widespread consensus exists on the increase of female labor force participation (FLFP) in developing countries as an important developmental outcome (Klasen and Lamanna, 2009; Bandiera and Natraj, 2013), yet less attention has been paid to the fact that rising FLFP can contribute to higher levels of inequality1 and why this might be the case. This effect tends to be
stronger in contexts where FLFP is low and remains significant when participation increases but remains comparatively low (e.g. in Latin America); the effect attenuates when FLFP and development levels are relatively high, but also in this instance there is some heterogeneity in the latter case. A group of developed countries, e.g. Italy, Sweden, and the UK, to mention only a few, have followed very different trajectories, which have been conditioned by different labor market regulations, fiscal policies, and social norms.
Analyses to assess the impact of FLFP are typically conducted on a limited set of countries (Sotomayor 2009; Shin, 2010; Gornick et al., 2019); contrary to the approach taken in this paper, they do not combine macro (cross-sectional results) and micro (within countries) distributional analysis. The novelty of the present work is that it addresses the issue from these two different angles and combines different methodologies.
As a first step, we estimate an inverted U-shaped relation between FLFP and inequality (with different specifications) at a cross-sectional level and identify five rather homogeneous clusters of countries. At the lower left end of the curve, Middle East and North African (MENA) and South Asian (SA) countries are characterized by low FLFP rates (Klasen and Pieters, 2015) and relatively low inequality rates; in the lower right end of the curve, we identify a cluster of Northern European countries (henceforth called the Scandinavians) with high female participation rates combined with low levels of inequality, as well as a group of Northern European countries (the UK, the Netherlands and Ireland) that are less egalitarian than the Scandinavians, where participation levels are slightly below those of the Scandinavians but where inequality is much higher. In the middle
1 It is important to emphasize one key aspect, notably that if we measure inequality at the household level (which is
what the literature we refer to mostly does), then we can have an inequality effect. The same, most likely, cannot happen if we measure inequality at the individual level or in other words irrespective of the household the individual belongs to. The strand of labor and welfare economics literature that informs this paper tends to consider the household as the main economic agency.
of the curve, we find a group of Latin American and Caribbean (LAC) countries with high inequality and average female participation rates, and another group of Euro-Mediterranean countries with similar participation rates but much lower inequality. Other groups of countries are more spread out along the curve, as is the case for sub-Saharan African (SSA) countries.
Secondly, we test the U-shaped hypothesis at the micro level; notably, we expect that FLFP can both have a pro-equality or pro-inequality impact when regressed on household income inequality, depending on which regional blocs of countries, e.g. MENA, SA and LAC, a country belongs to. In these countries, the increase in FLFP will almost always have an inegalitarian impact (as they are on the left-hand side of the curve); in continental Europe the impact is mixed, but strongly egalitarian in Euro-Mediterranean and Scandinavian countries, although with different FLFP rates. As it is important to examine this issue from a broader perspective, we attempt to put together different data sources to come up with a more integrated approach to the problem. Unfortunately, in the micro-analysis, a trade-off needed to be made between the homogeneity of data sources and completeness of information. On the one hand, the choice of the Luxembourg Income Study (LIS) database enabled us to use a very reliable and widely used set of variables; on the other hand, the LIS’s usefulness was limited because it lacked information on developing countries. Whereas LAC countries are broadly represented, MENA countries are only partially included, and there are severe data limitations. Therefore, in order to provide a micro-snapshot of MENA countries, the World Bank’s PovcalNet data set was used, with the Arab Republic of Egypt, Morocco and Jordan subsequently included. However, in addition to the fact that these countries use consumption rather than income data as a welfare variable, the other main limitation is that the main instrument we use for correcting endogeneity – the average women’s wage of the past 10 to 30 years depending on the country (Blau and Kahn, 2007) – is not available for them. Nonetheless, we are comfortable with the results because for these countries we are mostly interested in the sign and significance of the impact, rather than the magnitude. Plus, from these results, we can affirm that the data behave exactly like the data of countries for which we can correct the endogeneity (India and LAC).
The rest of the paper is structured into four sections: section 2 is a literature review and overview of the problem around the world; section 3 presents the data and the methodology; section 4 shows the main results; and section 5 concludes.
2.
Theory and literature review
Over the past quarter century, more than half a billion women have joined the world’s labor force (World Bank, 2012). Developing countries contributed massively to this surge, yet the picture is highly heterogeneous. Levels of FLFP are lowest in the Middle East and North Africa (20.3 percent) and South Asia (23.2 percent) regions, and highest in the East Asia and Pacific (58.6 percent) and Sub-Saharan Africa regions (61.4 percent). Despite remarkable remaining differences, participation rates have converged over time as countries and regions that began with very low rates (primarily Latin America) experienced large increases, and those with higher rates (Europe, Central Asia and East Asia and Pacific) experienced small declines (World Development Indicators, 2020).
Increasing participation of women in economic activities is a core development objective in itself, it raises GDP and has positive spillover effects (World Bank, 2012). When women earn an income, they invest it in the well-being of their children, including their education and in improving their health (Grabowski and Self, 2013; Dao et al., 2021). Likewise, they usually reinvest a much larger proportion of their earnings in their families and communities than men, spreading wealth and creating a positive impact on future development. Indeed, creating opportunities for women in the economy – particularly in developing economies – would improve their earning capacity, serve as a springboard for families to move out of poverty, and contribute greatly to growth (Klasen and Lamanna, 2009; Gaddis and Klasen, 2014; Idowu, 2019).
While greater levels of women’s employment are indeed considered highly beneficial for economic development, Juhn and Kim (1999) and Greenwood et al. (2014) point out that increases in FLFP can also widen household income inequality. Evidence from the United States (Sweeney and Cancian, 2004) suggests that the increasing importance of assortative mating,2 which is 2 Assortative mating is the process by which people of similar backgrounds, such as educational attainment or
particularly strong among affluent, high-income couples, can, in turn, have an impact on income inequality: Schwartz (2010) estimates that increases in earnings inequality would have been about 25-30 percent lower in absence of assortative mating. However, the impact of FLFP on inequality can go in a completely different direction. Several authors (inter alia, Fernandez and Rogerson, 2001; Esping-Andersen, 2007) argue that assortative mating increases household inequalities; an opposite equalizing effect (Maxwell, 1990; Harkness, 2010; Atkinson, 2015) will primarily emerge when the labor supply of lower educated women increases rapidly. In addition, in the long run, a rise in female employment may diminish the reproduction of inequalities.
The impact FLFP has on household income inequality is not unique and depends on several factors. First, it depends on the importance of assortative mating (Eika et al., 2019); if significant, the promotion of women’s labor force participation will give rise to widening household income inequality (Burtless, 1999). Second, different labor market regulations, fiscal policies and social situations have a significant impact on the final outcome (Albrecht et al., 2003; Mandel and Semyonov, 2006; Olivetti and Petrongolo, 2008; Betcherman, 2012). Finally, in accordance with the hypothesis that informs this paper, the relation can be non-linear. According to Sudo, (2017), inequality in incomes increases along with a larger percentage of FLFP (Elveren, 2014), as the number of high-earning women has an inequality-widening effect on income inequality. In a second phase, inequality reduces with an increase in the percentage of FLFP, as the reduced inequality of a wife’s income has an attenuating effect on household income inequality.
This inverted U-shaped relationship, while it has been theoretically formulated, has not received adequate attention from the empirical literature. This is because cross-country comparative studies have tended to focus on developed countries because of data limitations and also as – with some exceptions – income inequality levels are lower and female participation rates are high (Harkness, 2010); as Pasqua (2008) points out, inequality among women’s incomes tends to be higher in societies where FLFP is low.
to marry those with similar educational attainment, while those with less formal education are also increasingly likely to marry those with lower education levels. Consequently, considering a household with individuals with less-than-high-school education levels, family income based on the average of individual incomes would have been 77 percent of the national mean household income in 1960, dropping to 41 percent in 2005 (Greenwood et al. 2014).
The paper posits three main hypotheses to reconcile the mixed results discussed so far. First, the relationship between FLFP and inequality follows an inverted U-shaped pattern if developing countries are also included; this can also allow us to identify a “turning point” at which the dis-equalizing factors, such as the assortative mating, attenuate depending on the FLFP level. Second, along this curve, it is possible to identify groups of countries (Gornick et al., 2019) with common features and a similar FLFP to inequality gradient. Third, by means of an unconditional quantile regression (Firpo et al., 2009) we can replicate the macro-level results using micro data, and show the asymmetric impact of FLFP on different quintiles, as well as confirm whether a pro-inequality or pro-equality impact exists in a given country.
To sum up, increasing FLFP is widely considered an important societal target with numerous positive developmental outcomes; it also increases the level of resilience, boosting productivity and accelerating economic diversification (IMF, 2018). Increasing FLFP is also part of a broader women’s empowerment agenda being actively promoted by many international institutions and governments (UNHLP, 2016). Moreover, it clearly represents a priority in those countries where FLFP is low and women are burdened with a disproportionate proportion of unpaid care work, arising from dominant social norms regarding gendered division of roles (Chopra and Meenakshi, 2019). However, while the consensus on this issue is almost unanimous, the picture becomes a bit fuzzier when it comes to translating the principles into active policies. As pointed out in this section, neither the direction nor the shape of the nexus between FLFP and inequality is clearly established. However, as we will discuss in the concluding section, policy makers should take this important piece of information into account when formulating policies aimed at promoting FLFP.
3.
Data and methods
Different data sources are used for this paper. The macro analysis (first part of Section 4) is conducted using the World Bank’s PovcalNet3 database. The analysis was limited to observations
after 2002, as well as to countries with data on GDP and other basic socio-economic variables. This reduces the sample to about 127 countries, encompassing a range of low-to-high income
3 The PovCal database covers the period since 1978 and includes low-income, lower middle-income,
upper-middle-income countries and high-upper-middle-income countries. Most of the Gini observations are calculated from direct access to household surveys but clearly countries do not collected data in the same years and the time gap varies across countries. The panel is therefore an unbalanced one.
economies.4 The information from PovcalNet is combined with the World Development Indicators
(WDI), which is the World Bank’s principal collection of development indicators compiled from officially recognized international sources.
For the micro-analysis, disposable household income data was drawn from the Luxembourg Income Study (LIS).5 Spanning five decades, the LIS is the largest available income database of
harmonized microdata collected from about 50 countries around the world.6 The countries’ data
sets are harmonized into a common framework and contain household- and person-level data on labor income, capital income, pensions, public social benefits (excluding pensions) and private transfers, as well as taxes and contributions, demography, employment, and expenditures. Sixteen countries were selected (four developing and twelve developed countries), which were considered to be representative of the groups outlined in the introduction, notably7: India (2011) for the group
South Asia and MENA; Brazil (2013), Chile (2013), and Uruguay (2013) for the LAC group; Belgium (2013), France (2010), Italy (2014), Greece (2013), and Spain (2013) for the Euro-Mediterranean cluster; the United Kingdom (2013), Ireland (2014) and the Netherlands (2013) for the Northern European non-social democratic group; and, finally, Sweden (2005), Denmark (2013), Finland (2013) and Norway (2013) for the social-democratic Northern Europe group, i.e. the Scandinavians.
As mentioned before, we also conducted a preliminary analysis on a group of MENA countries that was not included in the LIS data set, e.g. Morocco, Jordan and Egypt.8 The comparison with 4 We follow the most recent (2020) World Bank classification that uses the Atlas method to estimate the size of
economies in terms of gross national income (GNI) per capita: Low income below US$1,036; Lower-middle income between US$ 1,036 and US$4,045; Upper-middle income between US$4,046 and US$12,535; and High income above US$12,535.
5 “Disposable household income” is usually the preferred measure for income distribution analysis, as it is the income
available to households to support their consumption expenditure and savings during the reference period (Canberra Group, 2011). According to the LIS documentation ( https://www.lisdatacenter.org/data-access/key-figures/methods/disposable/), this measure includes income received from work, wealth, and from direct government benefits, such as retirement or unemployment benefits. The measure then subtracts direct taxes paid, such as income taxes. The definition does not include sales taxes or non-cash benefits, such as government or employer provided health care. The income definition also does not include income from capital gains, a significant source of non-salary income for many wealthy individuals. As a result, many top incomes are probably underestimated.
6 The publicly accessible country data sets are listed on the LIS website at:
https://www.lisdatacenter.org/our-data/lis-database/. To preserve confidentiality, access to the micro-data is remote, meaning that the program code is sent to LIS rather than being run by the user directly on the data.
7 The figures in parentheses indicate the year of the survey.
8 Egypt is included in LIS but does not have the female wage variable. In order to keep the comparability with other
LIS data highlights two main caveats: first, the variable used for instrumenting the FLFP was not available, which meant that we had to restrict the estimation to only the OLS model; secondly, the target welfare variable was consumption and not income. However, the results for Morocco and Jordan appear to be in line with expectations while Egypt has the right sign, but the coefficients are not significant.
a. The FLFP and inequality macro-model
In Section 4, we proceed with a multivariate analysis to show the inverted U-shape relationship between FLFP and inequality. We follow a general formulation taken from the literature (Förster and Tóth, 2015) that has enough explanatory variables but, at the same time, does not cover all the inequality determinants as they are not easily available for many developing countries and for all the years being analyzed. The scope of this regression is to show that – once controlling for a set of socio-economic variables and using different models – the relation between FLFP and inequality is concave, our focus is, thus, mostly on the signs and significance of the FLFP expressed in polynomial form.
From the World Bank database, we collected data about inequality (Gini index), labor force participation and other variables and included them in the analysis as “controls”. All in all, our data set had a total of 1,025 observations.9
We estimate the following fixed effects panel model:
2
, 1 , 2 , , ,,
i t i t i t i t i t i t
GINI =α µ β+ + ⋅FLFP +β ⋅FLFP + ⋅γ X +ε (1) where:
- i = 1, ,127 stands for the country and t =2002, ,2018 is the year;
- GINI,it is the value of the Gini index calculated on households’ income in country at year i t
and is the dependent variable;
9 Data are not available for all nations and years, so the panel is not balanced. The World Bank produces the data on
“International Migrant Stock, percentage of population” by intervals of five years (the last update was in 2015): in this situation we interpolated the data to reconstruct the value of the variable in the years between updates.
- αi is the country fixed effect and is the year fixed-effect; µt
- β1 and are the parameters who should capture the quadratic relationship between Female β2
FLFP GINI
Labor Force Participation ( ) and inequality ( );
- X,it is the time variant (1 k× ) vector of the controls and is the corresponding vector of k γ
parameters to be estimated; - ε is the error term. ,it
,it
X
The choice of control variables ( ) is largely driven by data availability, but included some well-known factors affecting inequality.10
The first group concerns the internationalization of economy and “globalization”: “Foreign direct investments (as a percentage of GDP)”, “imports of goods and services (as a percentage of GDP)”, “Exports of goods and services (as a percentage of GDP)”, and “International migrant stock (as a percentage of the population)”.
The second group concerns structural change and how technical change can affect inequality through the shifting distribution of income between capital and labor and through the relative changes of labor demand and supply for skilled and unskilled workers: the “Services Value Added (as a percentage of GDP)” generally proxies this structural change towards service economies and “Labor Force with Secondary Education (as a percentage of the total)” proxies how the supply of skilled workers perform in chasing the corresponding increasing demand.
We expect these variables to be significant particularly in developed countries. Finally, we include the age dependency ratio (as a percentage of the workforce over total population) to control for demographic changes and “Government expenditure (as a percentage of GDP)” in order to determine the width of the role of the states as redistributive policy actors, employers and regulators. As all regressors are expressed in terms of percentages, the Gini index is also considered in a range between 0 and 100 in order to facilitate the quantitative interpretation of the
10 In the final models shown in this paper, we do not consider GDP per capita among the controls because it results
estimated coefficients. How the control variables are inserted incrementally into the estimated models depends on the availability of the data.
b. The FLFP and inequality micro-model
At the micro-level, we empirically examine the implications of FLFP for household income inequality by means of a regression method based on the notion of “influence function”. We consider this a as a sort of micro-foundation (based on microlevel data) of our general hypothesis on the inverted U-shape nature of the inequality/FLFP nexus. The influence function (Cowell and Victoria-Feser, 1996) reflects the influence of an individual observation on a given distributional statistic, e.g. a specific quantile, but it also has properties that allow us to capture the effects of explanatory variables on the distributional statistic of interest.
Firpo et al. (2009) propose a simple modification in which the quantile is added back to the influence function, resulting in what the authors call the “re-centered influence function” (RIF):
(
i; , Y)
(
i; , Y)
,RIF y q Fτ =q IF y q Fτ + τ (2)
where qτ is the τ-th quantile of the distribution of household incomes Y , and IF ⋅
( )
is the influence function. The importance of this transformation lies in the fact that the expectation of the RIF is precisely the quantile. With this result, Firpo et al. (2009) show that we can model the conditional expectation of the RIF as a simple linear function of the explanatory variables. Moreover, if we apply the law of iterated expectations, the final result is an expression that directly relates the impact of changes in the expected values of the covariates on the quantile qτ. In practice, following the Firpo et al.’s (2009) procedure, one can first obtain an estimate of the RIF for each income i by using Equation (2) above; then, the following equation can be estimated using an ordinary least squares method (OLS):(
)
, , , , 1 ˆ ; , K , 1,2, , , i Y k i k i k RIF y q Fτ ατ βτ xτ ετ i N = = +∑
⋅ + = (3)where ατ is a constant, xτ, ,ik denotes a realization of the k-th explanatory variable, βτ,k is the
parameters βˆτ,k, termed “unconditional quantile partial effect”, can be interpreted as the effect of a small change in the distribution of X on the quintile qk τ – when the distribution of other covariates remains unchanged – or as linear approximation of the effect of large changes of X k
on qτ (e.g., Firpo et al., 2018). In the first set of regressions by country, therefore, we estimate the impact of FLFP on the income deciles. This is to verify whether the returns on female labor force participation differ across deciles and indeed contribute to explain the equality or pro-inequality impact of FLFP. In this study, particular focus is paid on the distribution of (log) household disposable income,11 which corresponds to the sample of household members (aged 14
and over) forming part of the economically active (employed or unemployed) population.
The RIF-OLS regression method, however, can easily be extended to draw conclusions on the impact of a set of covariates on a variety of distributional functionals – analytical expressions for (re-centered) influence functions have, in fact, been derived for many distributional statistics other than sample quantiles (see Essama-Nssah and Lambert (2012) and Rios-Avila (2019) for a comprehensive list of formulas). In addition to the sample deciles qτ, τ =0.1,0.2, ,0.9 , to assess the contribution of FLFP on the level of inequality among households we also use the percentile ratios P90/P10 and P80/P20.12 The RIF for ratios of quantiles is given by (Choe and Van Kerm,
2018; Rios-Avila, 2019):
(
)
(
; ˆ ˆ, ,)
ˆ 1(
; ,ˆ)
ˆ(
; ,ˆ)
, ˆh ˆh i h l Y i h Y i l Y l l l q q RIF y R q q F IF y q F IF y q F q q q = + ⋅ − ⋅ (4)11 For the countries and years selected, income is expressed in the units of national currencies that were in use at the
time of the data collection. To directly compare real amounts across countries and over time, we apply the 2017 PPP deflators available via the LIS remote execution system to convert LIS monetary values into 2017 US$ PPPs. Furthermore, to maintain consistency with the set of methodological practices adopted by the LIS staff to construct the “Inequality and Poverty Key Figures” (https://www.lisdatacenter.org/data-access/key-figures/), the focus is placed on what is called “equivalized income”, i.e. the household disposable income divided by the square root of household size to adjust for differences in household demographics. We also exclude all households where disposable income is missing or exactly equal to zero and use person-level adjusted weights (the product of household weights and the number of household members) when generating estimates for the total population. Finally, before proceeding to an estimation of RIF-regression models, data have been bottom-coded at 1 percent of equivalized mean income and top-coded at 10 times the median of non-equivalized income.
12 The most popular Gini coefficient to measure income inequality has not been used as the income micro-data are
where
(
ˆ ˆ,)
ˆˆh h l l q R q q q= denotes the estimated quantile ratio. Therefore, the model to be estimated through OLS becomes:
(
)
(
)
, 1 ˆ ˆ ; , , K , 1,2, , , i h l Y k i k i k RIF y R q q F α β x ε i N = = +∑
⋅ + = (5)with h and l equal to, respectively, 90 and 10 for the P90/P10 ratio, and to 80 and 20 for the
P80/P20 ratio.
When looking at the right-end side of equations 3 and 5, FLFP is modeled as a dummy variable that takes value of 1 if the respondent was engaging actively in the labor market – either by working or looking for work – at the date of the survey, or zero otherwise. Besides the dummy variable representing FLFP, we also use controls for several factors in order to account for the role of some potential determinants of household income and its inequality. For this purpose, we opt for a list of LIS variables that are fully comparable across time and countries. Specifically, in the RIF-regression of each pair country/year, we control for geography (regional and rural area dummies); household composition (number of household members, number of household members aged 65 or more, and number of household members aged 13 or younger); demographic characteristics (age of household head); educational attainment (a dummy representing three educational levels); and labor market information (an indicator variable for a three-category industry classification of the household head’s main job).
One of the key concerns with the estimation framework described above is the potential endogeneity of FLFP due to omitted variable bias. Household income may indeed lead women to seek employment, or unobserved factors such as ability could drive women’s decision in favor of work. To address these issues, the strong assumption of FLFP being exogenous is relaxed, and an instrumental variable (IV) strategy is used to recover a causal interpretation. This choice is motivated from the observation that standard OLS estimates could be biased and inconsistent to the extent that FLFP is endogenous.
As the proposed instrument, we chose women’s average wage by deciles from the past 10 to 30 years (depending on the country) for that income bracket. The idea to use this instrument follows the findings of Blau and Kahn (2007), who show how FLFP is conditioned by the wage women
can aspire to while entering the labor market. The proposed average salary by decile is a market reference point that can condition the decision to participate in the labor market; however, depending on women’s ability it can be outpaced or not. The woman, if she decides to work, can easily contribute to the household income more or less than this benchmark depending on her ability, therefore the proposed instrument is not correlated to her ability. Being correlated to FLFP but not to the unobservable characteristics – (we test for this correlation between participation and wage table A1 in the appendix)– it looks a valid candidate for instrumenting the FLFP variable. We also run the Wooldridge test for strict exogeneity to check for endogeneity of FLFP and the Hausmann test to verify if the unbiased IV estimator is significantly different from the biased OLS estimator. We finally conduct a robustness check by repeating the same IV regression about 5 years before but losing India because earlier surveys were not available.
In a second stage, we introduce an additional instrument to improve the asymptotic efficiency of our estimates. This, however, requires restricting the number of observations we have for each country. The proposed additional instrument is the so-called Perfect Assortative Mating index (Kollamparambil, 2019) and requires having in each household two adult family members (typically married or in partnership) from which a score can be calculated that captures the degree of assortative mating in the family. This index can be considered as an improved measure of assortative mating when education is considered in years and where the educational gap is normalized with the combined education of partners to make allowances for the increasing levels of education among younger age cohorts. Specifically, the Perfect Assortative Mating index is obtained as follows: 1 h , h h GAP PAM CE = − (6)
where CEh =E E1+ 2 is the combined (males plus females) education level of household h and
1 2
h
GAP = E E− is the educational gap. Perfect positive assortative mating is given by a value of 1, whereas complete absence of positive assortative mating is given by 0. PAM and FLFP are positively correlated (see appendix) but PAM and women’s unobserved characteristics such as ability are not necessarily correlated unless we consider marriages as strategic choices aimed at maximizing income – which sometimes might be the case but, we argue, looks like a very reductive view of
the issue. Even in societies where this is still the case, the mating process has more to do with the status of families of origin (captured in part by household members’ education levels) than the ability of women to make the strategic choices. Indeed, we can say that in societies where the mating choice is free from external conditionings, women’s (or men’s) ability plays a limited role; at the same time, more traditional societies where the mating process is still strongly conditioned by economic considerations are also societies where women are very constrained in their decisions, so their ability to choose, again, plays a limited role. Finally, we conduct a Sargan-Hansen to test for overidentifying restrictions in the proposed model; the results in table A2 of the appendix indicate that for 1313 of 16 countries the instruments are valid instruments, i.e., uncorrelated with
the error term, and that the excluded instruments are correctly excluded from the estimated equation.
As shown in the next section, the empirical results seem to support the validity of the instruments: the results of the tests suggest that the vast majority of the RIF-OLS estimates are inconsistent, and that the RIF-IV model estimates would thus be more appropriate to correct for endogeneity. For the sake of completeness, we present in table A3 also the other OLS results from where one can see that only in few cases the sign and significance changes from OLS to IV.
4.
Results
a. The U-shaped relation between FLFP and inequality
The macro-model section is illustrated in a visual presentation that is developed to show how the concave relationship between inequality and FLFP is upheld by using both the full data set and restricting the sample to only developing countries; after controlling for various socio-economic factors (Tables 1 and 2), the inverted U-shaped relationship is still significant. The figures also enable to identify clusters of countries that show a similar FLFP/inequality gradient; this lays the ground for the second part of the analysis, where micro-data confirm that the impact of FLFP on inequality is very similar within the same groups.
Figure 1 displays the relation between female (left panel) and male (right panel) labor force participation and inequality. The two do not show a common trend; while the female one is, as expected, concave, whereas the one for males is almost linear: thus, increasing levels of male labor force participation goes hand in hand with increasing levels of inequality.
Figure 2 plots only the FLFP’s results of Figure 1, evidencing the different clusters of countries characterized by a similar FLFP/inequality gradient. From left to right in the top row, the developing countries being focused on, notably those in the MENA, SA and LAC regions, are visible. MENA and SA countries are characterized by similar (and low) levels of FLFP but also by relatively low inequality levels; in the inverted U-shaped curve they are positioned in the bottom left-hand part. LAC countries show, on average, higher levels of FLFP; however, at the same time they also display higher inequality, and their position on the curve is just below the turning point. This preliminary evidence shows that these three groups of countries have a relatively lower FLFP, and that marginal increases in FLFP tend to increase inequality, and also that the increase is much stronger among MENA and SA countries but more attenuated for LAC countries.
The picture is more heterogenous for developed countries, as shown by the quadrants in the lower row of Figure 2 show. For two of three country groups the gradient is negative, and positive for the remaining group. These three groups are the Scandinavians, with very high FLFP levels (the highest in the developed world) and low inequality; these countries are known for their very efficient and egalitarian fiscal policies and strong state support for working mothers. With a much lower level of FLFP (10 percentage points below the Scandinavians), but higher levels of inequality, include the following countries; the UK, the Netherlands, and Ireland, followed by the Euro-Mediterranean group, where FLFP is closer to that of Latin American countries (and in some cases lower, as in the case of Italy and Greece), but the inequality levels are much lower because they enjoy much more developed redistributive fiscal systems.
In Figure 3 the same relation is displayed separately by income levels with female participation. Here the FLFP concave relation is more pronounced for the middle-income group, while for those in the lower income group the relation is almost linear and sloped upward, and for those in the high income set the relation is almost linear but sloped downward. Notably both Kosovo and Turkey, despite being categorized as middle-income countries, show strong similarities with countries in the MENA and SA regions in terms of FLFP and inequality.
Finally, the multivariate analysis ascertains the concave relationship, even after controlling for other variables. Irrespective of the model or the sample (including or excluding developed countries), the FLFP/inequality relation is concave. Introducing different controls, the concavity tends to accentuate and the turning point (when inequality starts to decrease) of the U-shaped curve to move leftward. For example, in the full model without the controls (column 2 of Table 1), the turning point is reached at 61 percent of FLFP, corresponding to the value of Azerbaijan in 2003. In the same model with controls and fixed effects, the turning point is reached at 57 percent, or the value of Bolivia’s FLFP in 2017. The restriction to developing countries further accentuates the concavity (Table 2) and, as a consequence, also reduces the value of the turning point: in the model with all variables (column 5 of Table 2), it falls to 41 percent, or the value of Mexico in 2018. When looking at the various controls, variables seem to have the expected signs. Countries with a higher share of FDI over GPD are, all other things being equal, more inegalitarian; also countries with higher shares of the population of working age tend to be more unequal. Finally, countries with higher percentage of services over value added tend to be more unequal than others. The effect is significant for both samples (Table 1 and Table 2), but it is particularly interesting to comment on the effect for developing countries, as it might capture the distributional effect of what Rodrik (2015) defines as “premature deindustrialization”. In traditional structural transformation, the growth of industry, especially manufacturing, plays a big role. Several developing countries did not follow the development pattern of already industrialized nations, and basically skipped the transition from agriculture to manufacturing, going straight to services’ sector development. The services’ sector, however, is highly polarized, with few very well-paid jobs and a vast majority of low-paid jobs in the retail and construction sectors (Molini and Paci, 2015; Bertoni et al., 2016; Lopez-Acevedo et al., 2021).
b. The RIF-regression results
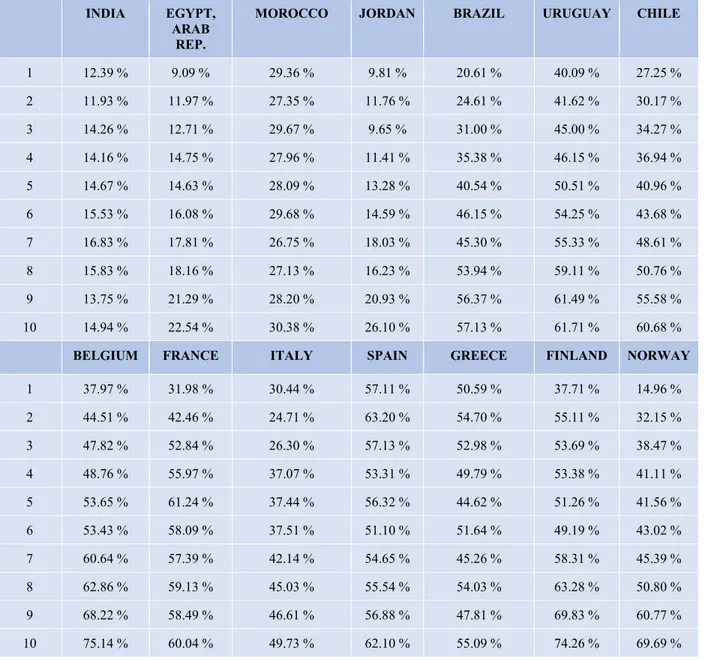
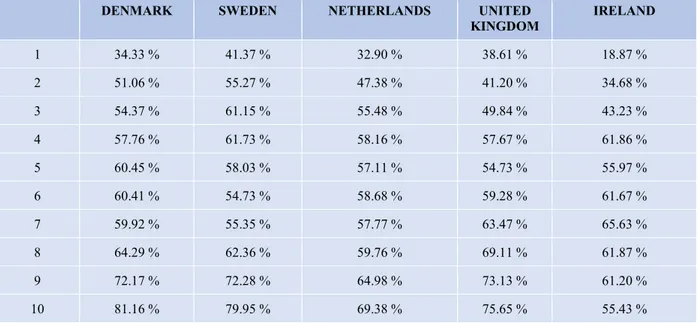
The results in Table 3 showing the FLFP rates by deciles are presented and followed by a commentary on the RIF results. As discernable in almost all countries, FLFP is lower in the bottom deciles than the top ones, participation levels, thus, tend to grow with income in all the countries considered. However, as shown by Table 4, returns on participation do not seem to be conditioned
by the different labor supplies at deciles level; otherwise we would always have had returns on participation higher in the bottom deciles than the top ones, and this is not the case.14
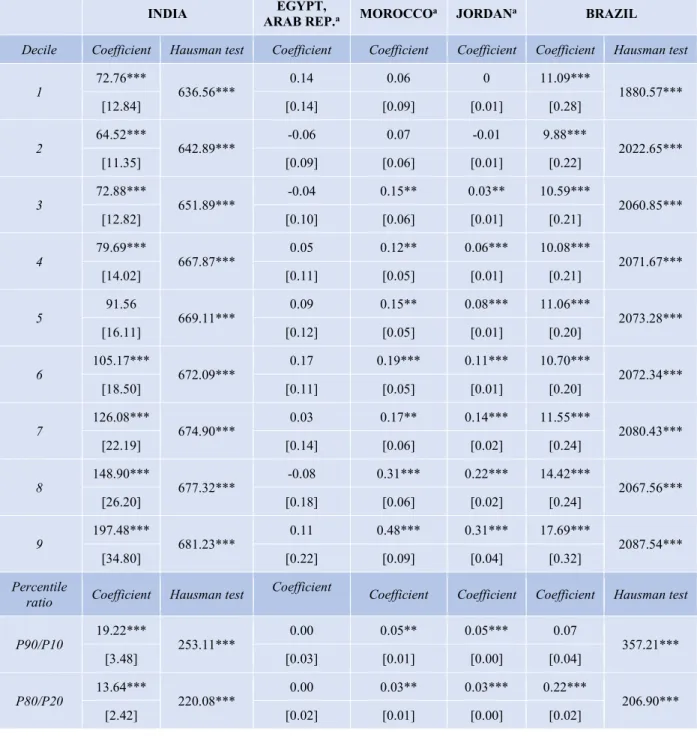
For the sake of brevity, only the results of the RIF-IV regression analysis will be presented. These results look at both the impact on the two selected measures of inequality (P80/P20 and P90/P10 ratios), and the impact on individual deciles.15 As mentioned, for MENA countries the selected
instrument was not available. These results are equally presented in Table 4, with the caveat that they are not fully comparable with the rest but as it appears, they show the expected signs and significance.
Looking at the RIF results in Table 4, and starting from the left to right, India, Morocco and Jordan all show a positive (inegalitarian) impact of FLFP on inequality. If we look at India, for example, the FLFP rate of return of the last two deciles is almost double that of the bottom two, indicating that if not compensated with measures that favor women in the bottom deciles, the FLFP increase would dramatically raise inequalities. At the same time, the magnitude of the decile regression coefficients indicates that the gains obtained from an increase in FLFP on households’ income are huge for all deciles as participation is low – a similar pattern is also valid for Morocco and Jordan. When LAC countries are compared to India, the magnitude of coefficients decreases both in the inequality and deciles of household income regressions. FLFP is higher than in the SA and MENA countries, and marginal increases would not have such a big impact on household incomes. At the same time, inequality is already high, and if countries want to further increase FLFP, they should consider the distributional impact; as in the previous case, targeted policies towards women in
14 Other factors beyond the scope of this paper may be at play in determining this difference in returns to participation
at decile level. First, discrimination against women, particularly in developing countries, is much stronger in the bottom deciles than in the top ones (World Bank, 2012); therefore, even if there is less competition, job opportunities and remuneration for women tend to be worse than those of women in the top deciles . Second, as shown in Appendix, education gaps, particularly in developing countries, are higher in the bottom than in the top deciles. Related to the previous point, even if we remove the hypothesis of discrimination in the jobs market, there has been ex ante discrimination in access to education, which has particularly affected poorer women. Hence while women in top deciles can at least aspire to jobs and remunerations like men, those in the bottom decile have few job opportunities because of their low level of education.
15 The corresponding OLS estimates are not reported here but are available on request. For an estimation of
RIF-regressions under both OLS and IV specifications, we first obtained the corresponding RIF for each observation in the samples of interest for the selected distributional statistics using the Stata command rifvar (Rios-Avila, 2019). We have then used the RIFs as the dependent variables and estimated the OLS and IV models using the Stata official commands given by, respectively, regress and ivregress (the latter using generalized method of moments estimation).
lower deciles seem to be the best available option to mitigate the trade-off between FLFP and the increase inequality.
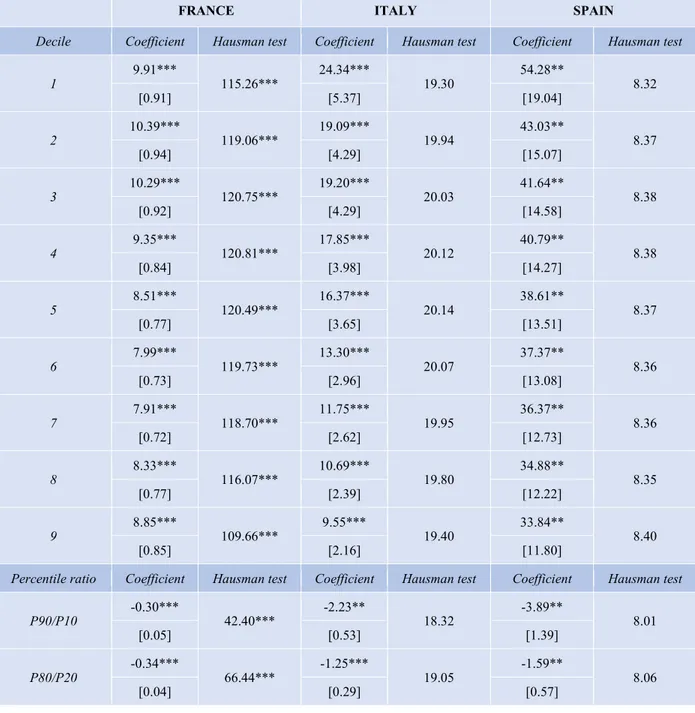
The FLFP impact becomes egalitarian when moving to the Euro-Mediterranean group, as reflected in the negative and significant coefficients of the inequality regressions. While the FLFP level of this group is, on average, not very far from that of LAC countries, what completely changes is the socio-economic context, the level of inequalities and, of course, the sets of very different policies. As it appears from the decile regressions, the returns on FLFP are stronger in the lower deciles than in the top ones, yet some clear differences are apparent between countries; the divide between the lowest and top decile is considerable for Spain, Italy and Greece, for France it is almost the same. While it is positive that returns on FLFP are higher in the bottom deciles – this might encourage the participation of poorer women in the labor market – it might, however, suggest the existence of a glass ceiling for women’s salaries. In these countries, the literature suggests that women find it particularly hard to access top positions, and if they do, they might earn less than men (Olivetti and Petrongolo, 2008; de la Rica et al., 2008).
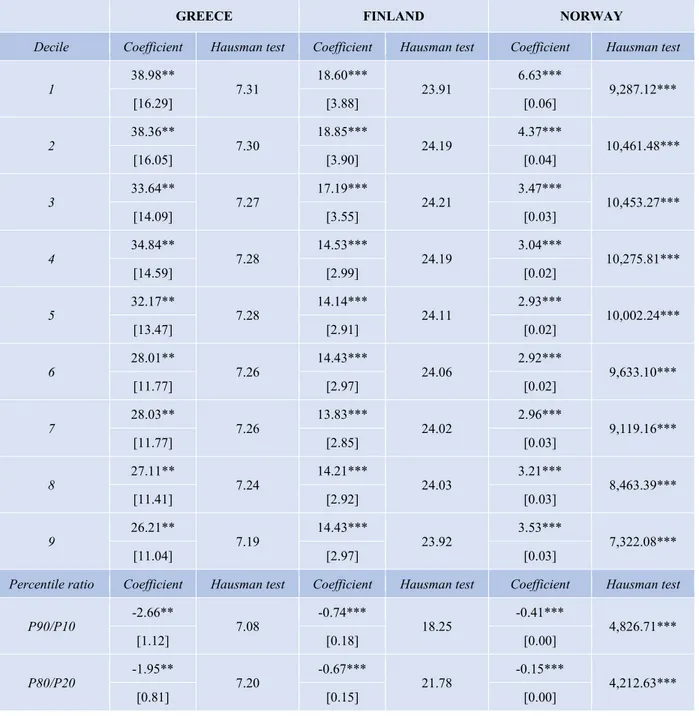
Finally, we conclude our description with the group of Northern European countries. As mentioned, the Scandinavians are known for their high participation rates and effective distributive policies, which make them the most egalitarian countries in the developed world. As in the previous case, the FLFP’s egalitarian impact is explained by the higher returns in the bottom, rather than top deciles and the existence of a glass ceiling also in these countries. The latter might be at odds with the positive reputation these countries have, yet, for example, Albrecht et al. (2003) document its presence in Sweden.
The important point to stress is that while the glass ceiling in Italy, Spain or Greece has more to do with gender discrimination, and that of Sweden has more to do with the (unintentional) consequences of the very generous pro-FLFP policies. These policies give Swedish women a strong incentive to participate in the labor force (Betcherman, 2012). According to Albrecht et al. (2003), however, the benefits may discourage strong career commitment on the part of the women who generally are more involved in child-rearing. In practice, this means that women may have strong incentives to participate in the labor force but do not do so very intensively. This policy
effect may be compounded by employers, who presumably expect less career commitment from their female employees.
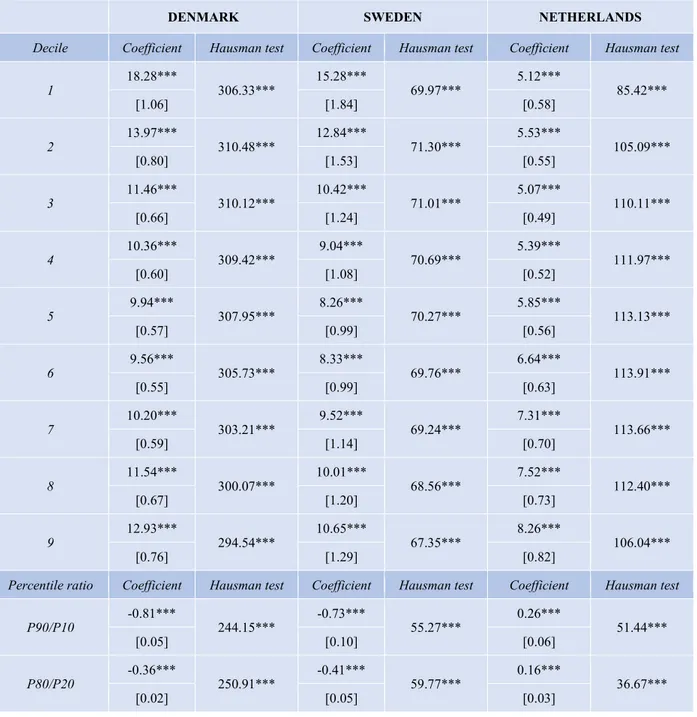
The other group of Northern European countries differ from the Scandinavians in that they have lower FLFP levels but also less generous policies to encourage participation. As for the other four country groups, there is a clear correspondence between their macro- and micro-levels results; this suggests the existence of a bifurcation at the level of developed countries; in this case increases in FLFP do not lead to declines in inequality. Existing labor market regulations and the fiscal policies play an important role in this respect. In the case of these countries, the higher returns of top deciles suggest that the glass ceiling is less present, and that women can reach top positions. Less generous pro-participation policies limit women’s access in the lower deciles and lead to a much lower participation level than the Scandinavians. Results hold even when considering surveys 5 years older (see table A4 in the Appendix).
When introducing the PAM index as an additional instrument (Table 5) and restricting the sample, the results do not vary substantially. Only in Ireland the impact of FLFP becomes insignificant while in all other countries the signs, significance and country ordering remain practically the same as in Table 4. Overall in developing countries the impact is pro-inequality while with the exception of the United Kingdom and the Netherlands, the FLFP impact is pro-equality in developed countries.
5.
Conclusions
Over the past few decades developing countries have seen a rapid increase in the number of women taking an active role in the labor market; however, this picture is highly heterogeneous. For many developing countries, increasing FLFP levels remains a priority (United Nations, 2000; World Bank, 2012), as well as a challenge because, as documented in this paper, increasing FLFP levels in many of these countries can produce undesired distributional effects if it is not adequately combined with measures targeted towards women in the lower deciles of the income distribution. As a matter of fact, our results confirm that the relationship between FLFP and inequality follows an inverted shaped. Therefore, if a country is located on the ascending part of the inverted U-shaped curve, increasing FLFP levels can lead to increasing inequality. This is the case in at least
three groups of developing countries in the MENA, SA and LAC regions. With minor exceptions, these groups are clearly identifiable on the estimated curve, and countries within these groups present common features and a similar FLFP to the inequality gradient. While there is an extensive literature on the dis-equalizing impact of FLFP in developed countries, little has been written about developing countries, and to our knowledge this is the first empirical estimation of an inverted U-shaped relationship between FLFP and inequality.
To strengthen our novel findings, we replicate these macro trends using household- and individual-level data. While micro-data are scarcer than macro-data, we were able to confirm the results from the macro analysis. Overall, the impact of FLFP is dis-equalizing in the developing countries under consideration, and the lower the FLFP the higher the impact. This is because the FLFP rate of return of the last two deciles is higher than that of the bottom two – although participation is higher among the top deciles. This shows that the increase in FLFP would have a strong pro-inequality impact, if not compensated with measures that favor women in the bottom deciles. Among developed countries, the Scandinavian and the Euro-Mediterranean show a pro-equality impact as FLFP returns in the lower deciles are higher than those in the higher ones, while in the remaining group of European countries the dis-equalizing effect is prevalent.
In conclusion, while there is almost unanimous consensus that increasing FLFP levels is an important developmental outcome, particularly in countries where FLFP levels are low and with high levels of gender discrimination – the translation of this general principle into effective policies becomes much more complicated. In certain contexts, fostering FLFP without considering its distributional impact can have potentially negative consequences in terms of inequality. There are two good reasons why policy makers should consider this an important piece of information when formulating policies to increase FLFP levels.
First, these policies often require the usage of public resources, e.g. tax breaks or subsidies for companies employing women, financing of nurseries and schooling for children, targeted training programs for women’s insertion in the labor market, as well as offering publicly financed parental leave schemes (World Bank, 2012; Martínez and Perticará, 2017; Lopez-Acevedo et al., 2020). If not targeted, these policies can benefit women working in the formal sector, in urban areas, or with higher levels of education, thus contributing to increasing inequality. The paradox, therefore, is
that public policies intended to reduce a certain type of inequality will increase another type of inequality.
Second and related to the previous point, the success of these policies is very much conditioned by their capacity to overcome deep-seated prejudices and social norms. One example of this is in the MENA region, where despite a rapid increase in women’s educational attainment, participation remains stubbornly low (Bandiera and Natraj, 2013). The difficulty of the task clearly requires broad coalitions, and the capacity to reach out to different social strata and constituencies.
References
Albrecht, James, Anders Björklund, and Susan Vroman. 2003. ÎIs There a Glass Ceiling in Sweden?”
Journal of Labor Economics 21 (1): 145-77.
Atkinson, Anthony B. 2015. Inequality What Can Be Done? Cambridge MA: Harvard University Press. Lopez-Acevedo, Gladys, Gordon Betcherman, Ayache Khellaf, and Vasco Molini. 2021. Morocco’s Jobs
Landscape: Identifying Constraints to an Inclusive Labor Market. International Development in Focus. Washington, DC: World Bank.
Bandiera, Oriana, and Ashwini Natraj. 2013. ÎDoes Gender Inequality Hinder Development and Economic Growth? Evidence and Policy Implications.” World Bank Research Observer 28 (1): 2-21.
Bertoni, Eleonora, Fabio Clementi, Vasco Molini, Francesco Schettino, and Hitomi Teraoka. 2016. Poverty
Work Program: Poverty Reduction in Nigeria in the Last Decade. Technical Report, World Bank,
Washington DC. http://documents.worldbank.org/curated/en/103491483646246005/Poverty-work-program-poverty-reduction-in-Nigeria-in-the-last-decade.
Betcherman, Gordon. 2012. Labor Market Institutions: A Review of the Literature. Policy Research
Working No. 6276, World Bank, Washington DC.
https://openknowledge.worldbank.org/handle/10986/12139.
Blau, Francine D., and Lawrence M. Kahn. 2007. “Changes in the Labor Supply Behavior of Married Women: 1980-2000.” Journal of Labor Economics 25 (3): 393-438.
Burtless, Gary. 1999. ÎEffects of Growing Wage Disparities and Changing Family Composition on the U.S. Income Distribution.” European Economic Review 43 (4-6): 853-65.
Canberra Group. 2011. Handbook on Household Income Statistics (2nd edn.). New York and Geneva: United Nations.
Choe, Chung, and Philippe Van Kerm. 2018. “Foreign Workers and the Wage Distribution: What Does the Influence Function Reveal?” Econometrics 6(3): 41.
Chopra, Deepta, and Meenakshi Krishnan. 2019. Linking Family-Friendly Policies to Women’s Economic
Empowerment: An Evidence Brief. UNICEF Early Childhood Development, New York NY.
www.unicef.org/sites/default/files/2019-07/UNICEF-Gender-Family-FriendlyPolicies-2019.pdf. Cowell, Frank A., and Maria-Pia Victoria-Feser. 1996. “Robustness Properties of Inequality Measures.”
Econometrica 64 (1): 77-101.
Dao, N.T., Dávila, J. & Greulich, A. 2021 “The education gender gap and the demographic transition in developing countries. Journal of Population Economics 34, 431–474.
Eika, Lasse, Magne Mogstad, and Basit Zafar. 2019. ÎEducational Assortative Mating and Household Income Inequality.” Journal of Political Economy 127 (6): 2795-2835.
Elveren, Adem Y. 2014. ÎWomenÑs Labour Force Participation and Pay Inequality: Evidence from Panel Cointegration.” Applied Economics Letters 21 (12): 862-65.
Behavioral Scientist 50 (5): 639-58.
Essama-Nssah, Boniface, and Peter J. Lambert. 2012. “Influence Functions for Policy Impact Analysis.” In John A. Bishop and Rafael Salas (eds.), Inequality, Mobility and Segregation: Essays in Honor of
Jacques Silber (Research on Economic Inequality, Vol. 20) (pp. 135-159). Bingley: Emerald Group
Publishing Limited.
Fernandéz, Raquel, and Richard Rogerson. 2001. “Sorting and Long-Run Inequality.” Quarterly Journal
of Economics 116 (4): 1305-41.
Firpo, Sergio P., Nicole M. Fortin, and Thomas Lemieux. 2009. ÎUnconditional Quantile Regressions.”
Econometrica 77 (3): 953-73.
Firpo, S. P., N. M. Fortin, and T. Lemieux. 2018. “Decomposing Wage Distributions Using Recentered Influence Function Regressions.” Econometrics 6 (2): 28.
Förster, Michael F., and István G. Tóth. 2015. ÎCross-Country Evidence of the Multiple Causes of Inequality Changes in the OECD Area.” In Anthony B. Atkinson and François Bourguignon (eds.),
Handbook of Income Distribution (Vol. 2) (pp. 1729-1843). Amsterdam: North-Holland.
Gaddis, Isis, and Stephan Klasen. 2014. ÎEconomic Development, Structural Change, and WomenÑs Labor Force Participation: A Reexamination of the Feminization U Hypothesis.” Journal of Population
Economics 27 (3): 639-81.
Gornick, Janet C., Berglind Hólm Ragnarsdóttir, and Leslie Mccall. 2019. The Interplay between Women’s
Earnings and the Income Distribution: A Cross-National Analysis of Latin American and Anglophone
Countries. Research Papers No. 105, Agence Française de Développement, Paris.
https://www.afd.fr/en/ressources/interplay-between-womens-earnings-and-income-distribution-cross-national-analysis-latin-american-and-anglophone-countries.
Grabowski, Richard, and Sharmistha Self. 2013. ÎMotherÑs Autonomy: Impact on the Quality of ChildrenÑs Healthcare in India.” Applied Economics 45 (14): 1903-13.
Greenwood, Jeremy, Nezih Guner, Georgi Kocharkov, and Cezar Santos. 2014. ÎMarry Your Like : Assortative Mating and Income Inequality.” American Economic Review 104 (5): 348-53.
Harkness, Susan. 2010. The Contribution of Women’s Employment and Earnings to Household Income
Inequality: A Cross-Country Analysis. Working Papers No. 531, LIS Cross-National Data Center,
Luxembourg. http://www.lisdatacenter.org/wps/liswps/531.pdf.
Idowu, Omowumi O. 2019. ÎDemand Drivers of Female Labor Force Participation: Evidence From Selected African Countries.” Economics 7 (1): 81-94.
International Monetary Fund. 2018. Pursuing Women’s Economic Empowerment. Paper prepared by Staff of the International Monetary Fund (IMF) for the Meeting of G7 Ministers and Central Bank Governors, June 1-2, 2018, in Whistler, Canada. https://www.imf.org/en/Publications/Policy-Papers/Issues/2018/05/31/pp053118pursuing-womens-economic-empowerment.
Juhn, Chinhui, and Dae Il Kim. 1999. ÎThe Effects of Rising Female Labor Supply on Male Wages.”
Journal of Labor Economics 17 (1): 23-48.
Klasen, Stephan, and Francesca Lamanna. 2009. ÎThe Impact of Gender Inequality in Education and Employment on Economic Growth: New Evidence for a Panel of Countries.” Feminist Economics 15 (3): 91-132.
Participation in Urban India?” World Bank Economic Review 29 (3): 449-78.
Kollamparambil Umakrishnan. 2019. “Assortative mating and income inequality in South Africa: An unconditional quantile regression analysis” unpublished manuscript
Lopez-Acevedo, Gladys, Samuel Freije-Rodriguez, Mexico Alberto Vergara Bahena, and Diego Cardozo Medeiros. 2020. Changes in Female Employment in Mexico: Demographics, Economics, and
Policies. Policy Research Working Paper No. 9292, World Bank, Washington DC.
https://openknowledge.worldbank.org/handle/10986/33987.
Lopez-Acevedo, Gladys, Gordon Betcherman, and Vasco Molini. 2021. Morocco’s Jobs Landscape:
Identifying Constraints to an Inclusive Labor Market. Washington DC: World Bank Publications.
Mandel, Hadas, and Moshe Semyonov. 2006. ÎA Welfare State Paradox: State Interventions and WomenÑs Employment Opportunities in 22 Countries.” American Journal of Sociology 111 (6): 1910-49. Martínez A., Claudia, and Marcela Perticará. 2017. ÎChildcare Effects on Maternal Employment: Evidence
from Chile.” Journal of Development Economics 126: 127-37.
Maxwell, Nan L. 2020. ÎChanging Female Labor Force Participation: Influences on Income Inequality and Distribution.” Social Forces 68 (4): 1251-66.
Molini, Vasco, and Pierella Paci (2015). Poverty Reduction in Ghana: Progress and Challenges. Technical report, World Bank, Washington DC. https://openknowledge.worldbank.org/handle/10986/22732. Olivetti, Claudia, and Barbara Petrongolo. 2008. ÎUnequal Pay or Unequal Employment? A Cross-Country
Analysis of Gender Gaps.” Journal of Labor Economics 26 (4): 621-54.
Pasqua, Silvia. 2008. ÎWives’ Work and Income Distribution in European Countries.” The European
Journal of Comparative Economics 5 (2): 157-86.
de la Rica, S., Dolado, J.J. & Llorens, 2008. V. Ceilings or floors? Gender wage gaps by education in Spain. Journal of Population Economics 21, 751–776 (2008).
Rodrik, Dani. (2015). Premature Deindustrialization. National Bureau of Economic Research, Working Paper No. 20935, Cambridge, MA.
Rios-Avila, Fernando. 2019. Recentered Influence Functions in Stata: Methods for Analyzing the
Determinants of Poverty and Inequality. Working Paper No. 927, Levy Economics Institute of Bard
College, Annandale-on-Hudson NY.
Shin, Kwang-Yeong. 2010. ÎThe Effect of Labor Force Participation by Women on Family Income Inequality in Korea, Japan, and Taiwan.” Korean Social Science Journal, 37 (1): 27-55.
http://www.kossrec.org/wp-content/uploads/2015/04/02_%EC%8B%A0%EA%B4%91%EC%98%81_pdf.pdf.
Schwartz, Christine R. 2010. “Earnings Inequality and the Changing Association between Spouses’ Earnings.” American Journal of Sociology 115 (5): 1524-57.
Sotomayor, Orlando J. 2009. ÎChanges in the Distribution of Household Income in Brazil: The Role of Male and Female Earnings.” World Development 37 (10): 1706-15.
Sudo, Naoki. 2017. ÎThe Effects of WomenÑs Labor Force Participation: An Explanation of Changes in Household Income Inequality.” Social Forces 95 (4): 1427-50.
Prospects for Assortative Mating.” Journal of Marriage and Family 66 (4): 1015-28.
United Nations. 2000. Further Actions and Initiatives to Implement the Beijing Declaration and the Platform for Action. Resolution S-23/3 adopted by the General Assembly on 10 June 2000.
https://www.un.org/womenwatch/daw/csw/outcome.htm.
UNHLP. 2016. Leave No One Behind: A Call to Action for Gender Equality and Women's Economic Empowerment. TechnicalReport, United Nations Secretary General’s High Level Panel on Women’s Economic Empowerment (UNHLP), New York NY. https://www2.unwomen.org/-
/media/hlp%20wee/attachments/reports-toolkits/hlp-wee-report-2016-09-call-to-action-en.pdf?la=en&vs=1028.
World Bank. 2012. World Development Report 2012: Gender Equality and Development. Technical Report, World Bank, Washington DC. https://openknowledge.worldbank.org/handle/10986/4391. World Development Indicators. 2020.
Tables
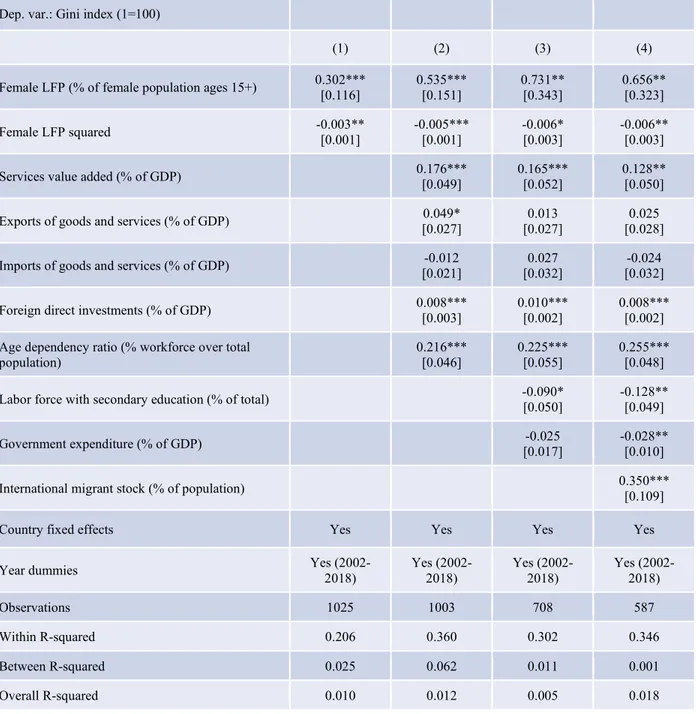
Table 1: Female labor force participation and Gini index (fixed effects panel analysis, all countries).
Dep. var.: Gini index (1=100)
(1) (2) (3) (4)
Female LFP (% of female population ages 15+) 0.302*** [0.116] 0.535*** [0.151] 0.731** [0.343] 0.656** [0.323] Female LFP squared -0.003** [0.001] -0.005*** [0.001] -0.006* [0.003] -0.006** [0.003] Services value added (% of GDP) 0.176*** [0.049] 0.165*** [0.052] 0.128** [0.050] Exports of goods and services (% of GDP) [0.027]0.049* [0.027]0.013 [0.028]0.025 Imports of goods and services (% of GDP) [0.021]-0.012 [0.032]0.027 [0.032]-0.024 Foreign direct investments (% of GDP) 0.008*** [0.003] 0.010*** [0.002] 0.008*** [0.002] Age dependency ratio (% workforce over total
population) 0.216*** [0.046] 0.225*** [0.055] 0.255*** [0.048]
Labor force with secondary education (% of total) -0.090* [0.050] -0.128** [0.049]
Government expenditure (% of GDP) [0.017]-0.025 -0.028** [0.010]
International migrant stock (% of population) 0.350*** [0.109]
Country fixed effects Yes Yes Yes Yes
Year dummies Yes (2002-2018) Yes (2002-2018) Yes (2002-2018) Yes (2002-2018)
Observations 1025 1003 708 587
Within R-squared 0.206 0.360 0.302 0.346
Between R-squared 0.025 0.062 0.011 0.001
Overall R-squared 0.010 0.012 0.005 0.018
Notes: Robust standard errors in brackets; * p < 0.10, ** p < 0.05, *** p < 0.01.
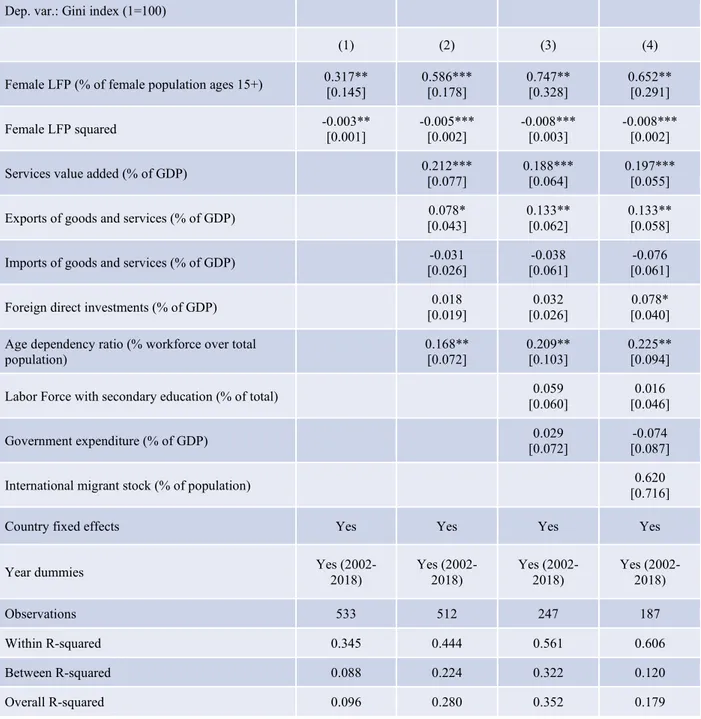
Table 2: Female labor force participation and Gini index (fixed effects panel analysis, w/o high income countries).
Dep. var.: Gini index (1=100)
(1) (2) (3) (4)
Female LFP (% of female population ages 15+) 0.317** [0.145] 0.586*** [0.178] 0.747** [0.328] 0.652** [0.291] Female LFP squared -0.003** [0.001] -0.005*** [0.002] -0.008*** [0.003] -0.008*** [0.002] Services value added (% of GDP) 0.212*** [0.077] 0.188*** [0.064] 0.197*** [0.055] Exports of goods and services (% of GDP) [0.043]0.078* 0.133** [0.062] 0.133** [0.058] Imports of goods and services (% of GDP) [0.026]-0.031 [0.061]-0.038 [0.061]-0.076 Foreign direct investments (% of GDP) [0.019]0.018 [0.026]0.032 [0.040]0.078* Age dependency ratio (% workforce over total
population) 0.168** [0.072] 0.209** [0.103] 0.225** [0.094]
Labor Force with secondary education (% of total) [0.060]0.059 [0.046]0.016
Government expenditure (% of GDP) [0.072]0.029 [0.087]-0.074
International migrant stock (% of population) [0.716]0.620
Country fixed effects Yes Yes Yes Yes
Year dummies Yes (2002-2018) Yes (2002-2018) Yes (2002-2018) Yes (2002-2018)
Observations 533 512 247 187
Within R-squared 0.345 0.444 0.561 0.606
Between R-squared 0.088 0.224 0.322 0.120
Overall R-squared 0.096 0.280 0.352 0.179
Notes: Robust standard errors in brackets; * p < 0.10, ** p < 0.05, *** p < 0.01.
Table 3: Female participation by decile and country
INDIA EGYPT, ARAB
REP.
MOROCCO JORDAN BRAZIL URUGUAY CHILE
1 12.39 % 9.09 % 29.36 % 9.81 % 20.61 % 40.09 % 27.25 % 2 11.93 % 11.97 % 27.35 % 11.76 % 24.61 % 41.62 % 30.17 % 3 14.26 % 12.71 % 29.67 % 9.65 % 31.00 % 45.00 % 34.27 % 4 14.16 % 14.75 % 27.96 % 11.41 % 35.38 % 46.15 % 36.94 % 5 14.67 % 14.63 % 28.09 % 13.28 % 40.54 % 50.51 % 40.96 % 6 15.53 % 16.08 % 29.68 % 14.59 % 46.15 % 54.25 % 43.68 % 7 16.83 % 17.81 % 26.75 % 18.03 % 45.30 % 55.33 % 48.61 % 8 15.83 % 18.16 % 27.13 % 16.23 % 53.94 % 59.11 % 50.76 % 9 13.75 % 21.29 % 28.20 % 20.93 % 56.37 % 61.49 % 55.58 % 10 14.94 % 22.54 % 30.38 % 26.10 % 57.13 % 61.71 % 60.68 %
BELGIUM FRANCE ITALY SPAIN GREECE FINLAND NORWAY
1 37.97 % 31.98 % 30.44 % 57.11 % 50.59 % 37.71 % 14.96 % 2 44.51 % 42.46 % 24.71 % 63.20 % 54.70 % 55.11 % 32.15 % 3 47.82 % 52.84 % 26.30 % 57.13 % 52.98 % 53.69 % 38.47 % 4 48.76 % 55.97 % 37.07 % 53.31 % 49.79 % 53.38 % 41.11 % 5 53.65 % 61.24 % 37.44 % 56.32 % 44.62 % 51.26 % 41.56 % 6 53.43 % 58.09 % 37.51 % 51.10 % 51.64 % 49.19 % 43.02 % 7 60.64 % 57.39 % 42.14 % 54.65 % 45.26 % 58.31 % 45.39 % 8 62.86 % 59.13 % 45.03 % 55.54 % 54.03 % 63.28 % 50.80 % 9 68.22 % 58.49 % 46.61 % 56.88 % 47.81 % 69.83 % 60.77 % 10 75.14 % 60.04 % 49.73 % 62.10 % 55.09 % 74.26 % 69.69 %
Table 3: Continued.
DENMARK SWEDEN NETHERLANDS UNITED
KINGDOM IRELAND 1 34.33 % 41.37 % 32.90 % 38.61 % 18.87 % 2 51.06 % 55.27 % 47.38 % 41.20 % 34.68 % 3 54.37 % 61.15 % 55.48 % 49.84 % 43.23 % 4 57.76 % 61.73 % 58.16 % 57.67 % 61.86 % 5 60.45 % 58.03 % 57.11 % 54.73 % 55.97 % 6 60.41 % 54.73 % 58.68 % 59.28 % 61.67 % 7 59.92 % 55.35 % 57.77 % 63.47 % 65.63 % 8 64.29 % 62.36 % 59.76 % 69.11 % 61.87 % 9 72.17 % 72.28 % 64.98 % 73.13 % 61.20 % 10 81.16 % 79.95 % 69.38 % 75.65 % 55.43 %
Table 4: RIF-IV regression coefficients for female labor force participation, by country.
INDIA ARAB REP.EGYPT, a MOROCCOa JORDANa BRAZIL
Decile Coefficient Hausman test Coefficient Coefficient Coefficient Coefficient Hausman test
1 72.76*** 636.56*** 0.14 0.06 0 11.09*** 1880.57*** [12.84] [0.14] [0.09] [0.01] [0.28] 2 64.52*** 642.89*** -0.06 0.07 -0.01 9.88*** 2022.65*** [11.35] [0.09] [0.06] [0.01] [0.22] 3 72.88*** 651.89*** -0.04 0.15** 0.03** 10.59*** 2060.85*** [12.82] [0.10] [0.06] [0.01] [0.21] 4 79.69*** 667.87*** 0.05 0.12** 0.06*** 10.08*** 2071.67*** [14.02] [0.11] [0.05] [0.01] [0.21] 5 91.56 669.11*** 0.09 0.15** 0.08*** 11.06*** 2073.28*** [16.11] [0.12] [0.05] [0.01] [0.20] 6 105.17*** 672.09*** 0.17 0.19*** 0.11*** 10.70*** 2072.34*** [18.50] [0.11] [0.05] [0.01] [0.20] 7 126.08*** 674.90*** 0.03 0.17** 0.14*** 11.55*** 2080.43*** [22.19] [0.14] [0.06] [0.02] [0.24] 8 148.90*** 677.32*** -0.08 0.31*** 0.22*** 14.42*** 2067.56*** [26.20] [0.18] [0.06] [0.02] [0.24] 9 197.48*** 681.23*** 0.11 0.48*** 0.31*** 17.69*** 2087.54*** [34.80] [0.22] [0.09] [0.04] [0.32] Percentile
ratio Coefficient Hausman test Coefficient Coefficient Coefficient Coefficient Hausman test P90/P10 19.22*** 253.11*** 0.00 0.05** 0.05*** 0.07 357.21***
[3.48] [0.03] [0.01] [0.00] [0.04]
P80/P20 13.64*** 220.08*** 0.00 0.03** 0.03*** 0.22*** 206.90***