UNIVERSITY
OF TRENTO
DEPARTMENT OF INFORMATION AND COMMUNICATION TECHNOLOGY
38050 Povo – Trento (Italy), Via Sommarive 14
http://www.dit.unitn.it
ASSESSMENT OF SVM RELIABILITY FOR MICROARRAY DATA
ANALYSIS
Andrea Malossini, Enrico Blanzieri and Raymond Ng
December 2004
Assessment of SVM Reliability for Microarrays
Data Analysis
Andrea Malossini
Department of Information and Communication Technology
University of Trento
[email protected]
Enrico Blanzieri
Department of Information and Communication Technology
University of Trento
[email protected]
Raymond T. Ng
Department of Computer Science
University of British Columbia
[email protected]
December 9, 2004
Abstract
The goal of our research is to provide techniques that can assess and vali-date the results of SVM-based analysis of microarray data. We present prelim-inary results of the effect of mislabeled training samples. We conducted several systematic experiments on artificial and real medical data using SVMs. We systematically flipped the labels of a fraction of the training data. We show that a relatively small number of mislabeled examples can dramatically de-creases the performance as visualized on the ROC graphs. This phenomenon persists even if the dimensionality of the input space is drastically decreased, by using for example feature selection. Moreover we show that for SVM re-cursive feature elimination, even a small fraction of mislabeled samples can completely change the resulting set of genes.
This work is an extended version of the previous paper [MBN04].
1
Introduction
Gene-expression microarrays make it possible to simultaneously measure the rate at which a cell or tissue is expressing (translating into a protein) each of its thousands of genes. One can use these comprehensive snapshot of biological activity to infer regulatory pathways in cells, identify novel targets for drug design, and improve the diagnosis, prognosis, and treatment planning for those suffering from disease. The amount of data this new technology produces is more than one can manually analyze. Thus, applying data mining techniques is necessary. However, while data mining techniques are proved successful for business applications, gene expression data sets have characteristics rather different from those of business data sets. We observe three key issues: high dimensionality, small sample size, and noise.
• The dimensionality of the data, p, can be very high. In the human genome,
there are at least 20,000 genes. And in the human body, there are more than a million proteins. Thus, for one patient, there can quite easily be over 50,000 pieces of data.
• The number of samples, n, can be small (relative to typical business
applica-tions). For many biomedical and pathology studies, 40-80 patients are con-sidered decent-sized. Sample sizes in the order of hundreds are less common. There are a number of reasons why this is the case. First, data acquisition itself may be very expensive. While microarray costs are decreasing, other costs (e.g., wet laboratory cost for micro-dissection of tissues) remain high. For instance, the cost associated with one patient can very easily exceed 10,000 Euros. Money aside, the second reason is that for many diseases, there are simply not enough patients available. One prime example is early stage lung cancer (e.g., carcinoma-in-situ). Because early stage lung cancer is very hard to detect by normal pathological means (e.g., x-rays), we do not know of any medical research center in the world which has a database of such patients exceeding 100. Finally, the third reason is that even if the patients are there, many of them or their families may not want to participate in research studies.
• Biomedical data can be very noisy. One reason is that data may be acquired
in laboratory environment, which sometimes can be hard to keep unchanged. Another reason is that making diagnostic decisions (e.g., grading a biopsy) is not completely objective or black-and-white. For the same medical condition, there may be different gold-standards, which could lead to different decisions. Thus, robust techniques are very important.
Recently a state-of-the-art classification method, Support Vector Machine [CV95] has been used successfully in microarray data analysis [Gea99, Fea00, Val02, LL03, Sea04]. Unfortunately microarray data sets are characterized by the huge dimen-sionality of the input space p (which comprises thousands of genes) versus the extremely low numbern of training samples (usually of the order of tens) as shown in Table 1. In such cases, a small error in the training set could result in a really poor-performance classifier.
The goal of our work is to assess the reliability of the results obtained by SVM techniques on microarray data. Here we present preliminary work that considers mislabeled training samples as a possible source of unreliability.
2
Is the SVM reliable for microarray data sets?
Initially, we started to investigate the problem of mislabeled samples on an artificial dataset and assess the performance of the classifier.
We generated a two-class classification problem with an input space ofp = 2000 features. The first class, labeled with “-1”, is sampled from a multivariate normal distribution withµ = 0 and Σ = 3 · I, where I id the identity matrix. The second class, labeled with “+1”, is distributed as the first class except for 20 features where the component of the mean is µi = 3 and Σ =I. This procedure has been adopted in order to simulate the differential expression of a limited number of genes. Sampling from the distributions described above, we generated a series of training sets with n = 10, 20, 30, 40, 50, 100, 200 elements and a test set of 100 elements. Each training set and test set has half of the elements labeled as “+1” and half labeled as “-1”, i.e. is balanced. For each training set we trained 5 different SVM classifiers. One on the unmodified training set, and the other 4 on the training set with different percentage of label flipping. We trained the SVM on the training set
Assessment of SVM Reliability for Microarray Data Analysis 3
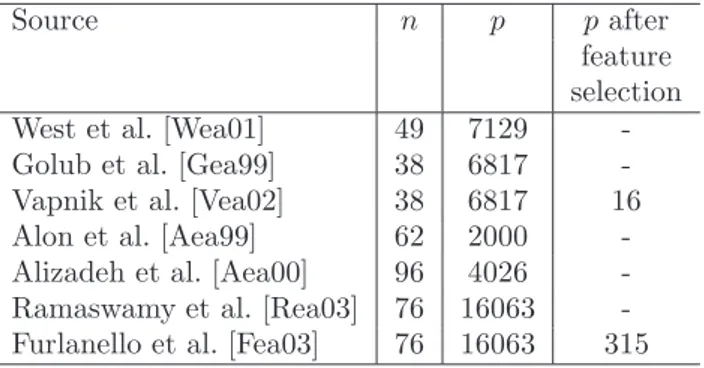
Source n p p after
feature selection West et al. [Wea01] 49 7129 -Golub et al. [Gea99] 38 6817 -Vapnik et al. [Vea02] 38 6817 16 Alon et al. [Aea99] 62 2000 -Alizadeh et al. [Aea00] 96 4026 -Ramaswamy et al. [Rea03] 76 16063 -Furlanello et al. [Fea03] 76 16063 315
Table 1: Number of features p and number of available samples n in microarray data analysis literature ( “-” means no feature selection is performed in the paper).
and then we randomly flipped the labels of a fraction of the training set and trained other SVMs. We used the standard value for the regularization parameter C = 1, which measures the trade-off between error and complexity. We performed the flipping on the original training set for percentages of{5, 10, 15, 20}% (the number of flipping has been truncated to an integer). For each classifier we calculated the accuracy on the test set. For each experiment identified by a value of n and a flipping percentage, the entire procedure has been repeated 20 times and mean and variance of each classifier’s accuracy has been calculated.
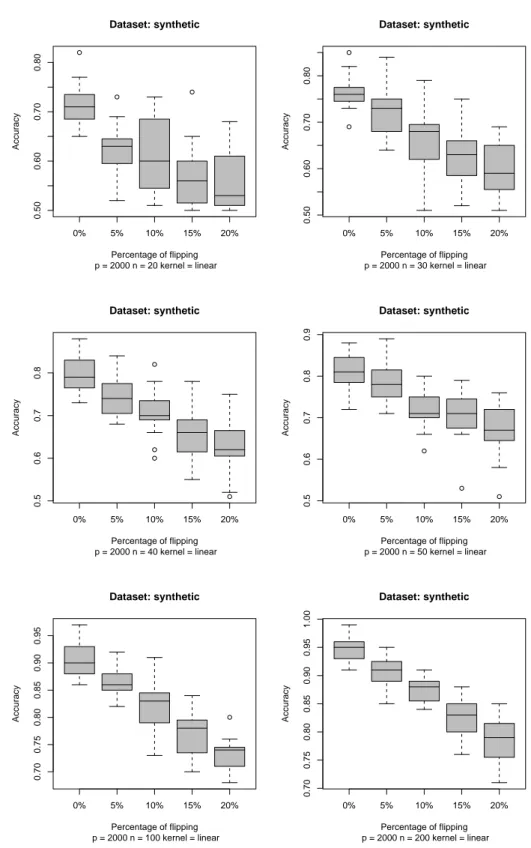
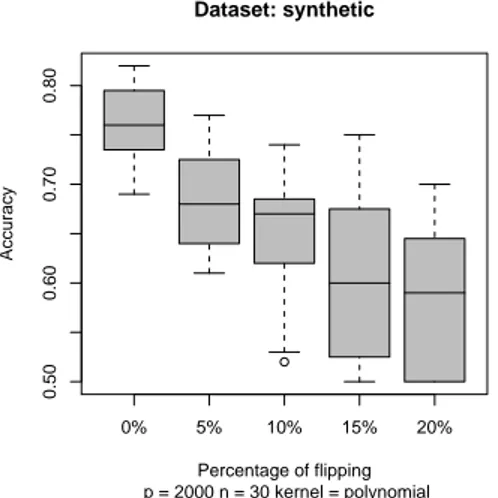
To visualize the performance of each classifier obtained we used a boxplot. In Fig. 1 we show the results of the simulation for different percentage of label flipping for a training set of 20,30,40,50,100,200 elements respectively. We can note that that with only 10% of flipping the difference between the unflipped and flipped accuracy’s classifiers is about 0.1 (i.e. 10% difference in accuracy). By incrementing the number of training samples, the variance decreases but there is still a difference in accuracy. In Fig.2 we show two examples of non-linear SVM classifiers, using a polynomial kernel of degree 2 and a radial basis kernel. The effect of the flipping is still there and in it is more accentuate.
The problem of overfitting which arises when the number of features is much greater than the number of training samples can be lowered by reducing the number of features. Some wrapper techniques for feature selection involving SVM have been developed (e.g. the Recursive Feature Elimination (RFE) [Vea02], E-RFE (entropy-based feature elimination) [Fea03]), which have been used to reduce the number of features as shown in Tab. 1.
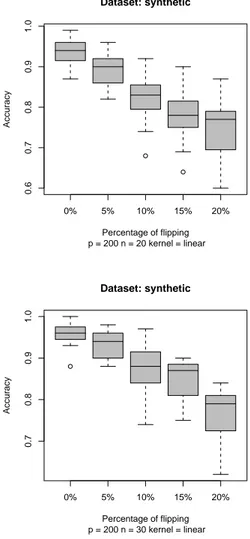
In Fig. 3 we show the effect of reducing the number of features from 2000 to 200, but including all the important features which permits to separate the two classes. Notice that even if the number of features is low, p = 200, given a low number of samples, the effect on the the accuracy of the mislabeled classifiers is still present despite the classifiers generated have good absolute accuracy.
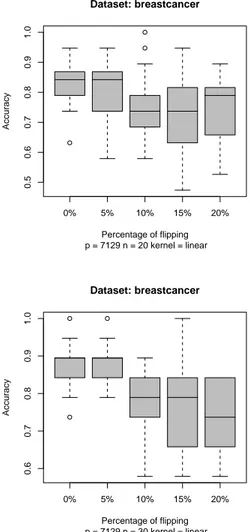
Since a real dataset is far more complex than the synthetic data we generated, we tested the procedure on a real biological dataset, a human breast cancer dataset from [Wea01], which included 49 samples, 24 marked as ER+ and 25 marked as ER-. We built randomly two training sets of 20 and 30 elements and test the SVM classifier on a disjoint random test set of 19 samples. In Fig. 4 we show the results on the Breast Cancer dataset using the SVM and randomly flipping a percentage of the original labels. Again with 10 % of flipping the resulting classifier has an lower accuracy (about 0.1) than the unflipped classifier. This means that only 2 or 3 wrong labels suffice to have a sensible degradation of the accuracy. Class prediction is not the only purpose of SVM application in microarray data analysis. In fact SVM is used for discovering of important genes by using feature
0% 5% 10% 15% 20% 0.50 0.60 0.70 0.80 Dataset: synthetic p = 2000 n = 20 kernel = linear Percentage of flipping Accuracy 0% 5% 10% 15% 20% 0.50 0.60 0.70 0.80 Dataset: synthetic p = 2000 n = 30 kernel = linear Percentage of flipping Accuracy 0% 5% 10% 15% 20% 0.5 0.6 0.7 0.8 Dataset: synthetic p = 2000 n = 40 kernel = linear Percentage of flipping Accuracy 0% 5% 10% 15% 20% 0.5 0.6 0.7 0.8 0.9 Dataset: synthetic p = 2000 n = 50 kernel = linear Percentage of flipping Accuracy 0% 5% 10% 15% 20% 0.70 0.75 0.80 0.85 0.90 0.95 Dataset: synthetic p = 2000 n = 100 kernel = linear Percentage of flipping Accuracy 0% 5% 10% 15% 20% 0.70 0.75 0.80 0.85 0.90 0.95 1.00 Dataset: synthetic p = 2000 n = 200 kernel = linear Percentage of flipping Accuracy
Figure 1: Boxplots of the accuracy of the SVM classifiers. An incremental per-centage of random flipping of the labels is performed and the SVM tested on a 100-samples unflipped test set.
Assessment of SVM Reliability for Microarray Data Analysis 5 0% 5% 10% 15% 20% 0.50 0.60 0.70 0.80 Dataset: synthetic p = 2000 n = 30 kernel = polynomial Percentage of flipping Accuracy
(a) A polynomial kernel of degree 2 is used in the SVM classification. 0% 5% 10% 15% 20% 0.5 0.6 0.7 0.8 Dataset: synthetic p = 2000 n = 30 kernel = radial Percentage of flipping Accuracy
(b) . A radial basis kernel is used in the SVM classification
Figure 2: Boxplots of SVM classifiers for some non-linear kernels. Artificial dataset of 2000 features and 20 training samples.
0% 5% 10% 15% 20% 0.6 0.7 0.8 0.9 1.0 Dataset: synthetic p = 200 n = 20 kernel = linear Percentage of flipping Accuracy 0% 5% 10% 15% 20% 0.7 0.8 0.9 1.0 Dataset: synthetic p = 200 n = 30 kernel = linear Percentage of flipping Accuracy
Figure 3: Boxplot of SVM classifiers. An incremental percentage of random flipping of the labels is performed and the SVM tested on a 100-samples unflipped test set. Each experiment is repeated 20 times.
Assessment of SVM Reliability for Microarray Data Analysis 7 0% 5% 10% 15% 20% 0.5 0.6 0.7 0.8 0.9 1.0 Dataset: breastcancer p = 7129 n = 20 kernel = linear Percentage of flipping Accuracy 0% 5% 10% 15% 20% 0.6 0.7 0.8 0.9 1.0 Dataset: breastcancer p = 7129 n = 30 kernel = linear Percentage of flipping Accuracy
Figure 4: Boxplot of SVM classifiers for the breast cancer dataset. An incremental percentage of random flipping of the labels is performed and the SVM obtained tested on a 19-samples unflipped test set. Each experiment is repeated 20 times.
selection [Gea99, Vea02, Fea03]. In Fig. 3 we reduced the number of features from 2000 to 200 but including all the relevant features. In real data sets we do not know which are the important features, hence mislabeling could also affect the outcomes of a feature selection procedure. If in the training set there are some mislabeled patterns, these misleading information will propagate through the feature selection procedure so we expect, finally, to get a different set of important features (genes). For investigating this effect we tested the recursive feature elimination [Vea02] on the Breast Cancer dataset with percentage of flipping of 5 % and 10 %. As shown in Table 2, only 5 genes over 32 are common to the final pool of genes in the unflipped and 10 % flipped cases. Moreover the ranking is completely different. For a 5 % of
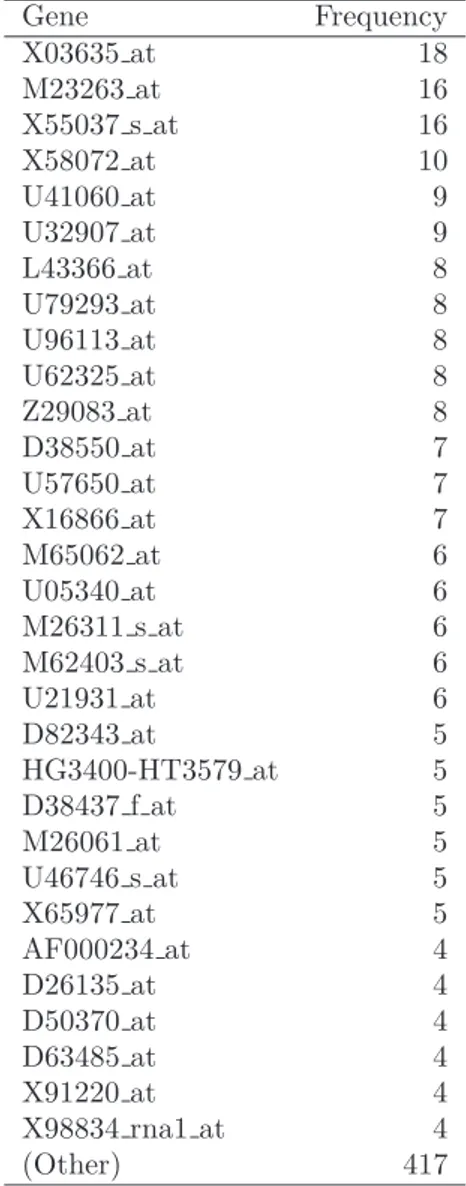
Rank 0 % of flipping 5 % of flipping 10 % of flipping 1 X03635 at U81984 at L38608 at 2 X55037 s at • M23263 at U39840 at 3 U57650 at U77665 at X59131 at 4 M23263 at X65977 at M33493 s at 5 M26311 s at M61853 at U09196 at 6 L43366 at U67963 at M13699 at 7 X91220 at • M62403 s at U68019 at 8 U39817 at X03656 rna1 at • M23263 at 9 U96113 at HG742-HT742 at • D38550 at 10 M62403 s at U41060 at X65977 at 11 U05340 at • D63485 at • Z29083 at 12 X58072 at Z49878 at X86681 at 13 L20860 at D26599 at L77864 at 14 X57351 at X69636 at M60614 at 15 D63485 at • X03635 at • X58072 at 16 D45906 at HG3105-HT3281 s at L23333 s at 17 U32907 at U78180 at S38953 s at 18 U46746 s at J04056 at X98260 at 19 D38550 at X95677 at M35851 s at 20 U61232 at • U62325 at D38500 at 21 U63455 at • U57650 at D79988 at 22 U21931 at • U05340 at U57093 at 23 M83652 s at D16105 at X95826 at 24 U27193 at M29877 at M64347 at 25 U62325 at HG3543-HT3739 at U81984 at 26 U34044 at U60319 at D28124 at 27 J03910 rna1 at D78586 at X74262 at 28 Z29083 at L20591 at • L43366 at 29 X16866 at X90840 at X06323 at 30 L38932 at J03827 at U03886 at 31 U68385 at J03242 s at D79994 at 32 X63578 rna1 at • U61232 at HG3123-HT3299 at Table 2: Lists of genes selected by SVM-RFE from the Breast Cancer data set with growing percentage of flipping, respectively 0 %, 5 % and 10 %. The genes indicated with a• are present also in the list of genes selected from the unflipped data set. flipping (in our case about 3 mislabeled samples over 49) there are only 8 common genes. We repeated 20 times the recursive feature elimination on Breast Cancer data by flipping randomly a 10 % of the labels. In Table 3 is shown the genes with higher frequency of presence in the final lists of 32 genes each one. Only 4 genes are present in at least 10 of the selected pools. The others are not in the selected
Assessment of SVM Reliability for Microarray Data Analysis 9 Gene Frequency X03635 at 18 M23263 at 16 X55037 s at 16 X58072 at 10 U41060 at 9 U32907 at 9 L43366 at 8 U79293 at 8 U96113 at 8 U62325 at 8 Z29083 at 8 D38550 at 7 U57650 at 7 X16866 at 7 M65062 at 6 U05340 at 6 M26311 s at 6 M62403 s at 6 U21931 at 6 D82343 at 5 HG3400-HT3579 at 5 D38437 f at 5 M26061 at 5 U46746 s at 5 X65977 at 5 AF000234 at 4 D26135 at 4 D50370 at 4 D63485 at 4 X91220 at 4 X98834 rna1 at 4 (Other) 417
Table 3: Genes that appear with higher frequency in the list of selected genes in 20 repetitions of SVM-RFE from Breast Cancer data set with 10 % of flipping.
list in the majority of the repetitions. Hence the effect of a 10 % of label flipping on the RFE procedure is to produce a very variable set of selected genes.
In real data set however, the situation is much more complicated than the relative simple situation described in the synthetic data set. Correlation between genes and the much higher variability of the expression values, surely play a crucial role for the sensitivity of SVM to mislabeled samples.
3
Conclusion and future work
We presented the results of experiments on artificial and medical data aimed to assess the sensitivity of SVM classification and feature selection with respect to mislabeled training samples. This is a preliminary step toward the definition of new techniques devoted to evaluate the reliability of the use of SVM for analysis of microarray data. Obviously, scientists should guarantee the quality of the data they use for their research, however, our results show that the robustness of this approaches can be a critical issue. It seems crucial now to take care of this source of
error because neither by increasing the number of training samples or decreasing the number of features is a good recipe to increase the performance of a SVM classifier. A statistical/computational method for detecting and solving such problem should be developed because the microarray analysis based on SVMs is wide-spreading in the scientific community.
References
[Aea99] U. Alon and et al. Broad patterns of gene expression revealed by clustering analysis of tumor and normal colon tissues probed by oligonucleotides array. PNAS, 96:6745–6750, 1999.
[Aea00] A. Alizadeh and et al. Distinct types of diffuse large b-cell lymphoma identified by gene expression profiling. Nature, 403:503–511, 2000. [CV95] C. Cortes and V. Vapnik. Support vector networks. Machine Learning,
20:273 – 297, 1995.
[Fea00] T. S. Furey and et al. Support vector machine classification and valida-tionof cancer tissue samples using microarray expression data.
Bioinfor-matics, 16(10):906–914, 2000.
[Fea03] C. Furlanello and et al. Entropy-based gene ranking without selection bias for the predictive classification of microarray data. BMC Bioinformatics, (4):54–64, 2003.
[Gea99] T. R. Golub and et al. Molecular classification of cancer: class discovery and class prediction bye gene expression monitoring. Science, (286):531– 537, 1999.
[LL03] Y. Lee and C-K. Lee. Classification of multiple cancer types by nulticate-gory support vector machines using gene expression data. Bioinformatics, 19(9):1132–1139, 2003.
[MBN04] A. Malossini, E. Blanzieri, and R. Ng. Assessment of SVM reliability for microarray data analysis. In Proceedings of the Second European
Work-shop on Data Mining and Text Mining for Bioinformatics, pages 38–42,
2004.
[Rea03] S. Ramaswamy and et al. A molecular signature of metastasis in primary solid tumors. Nature Genetics, 33:1–6, 2003.
[Sea04] K. Simek and et al. Using SVD and SVM methods for selection, classi-fication, clustering and modeling of DNA miscoarray data. Engineering
application of Artificial Intelligence, 17(4):417–427, 2004.
[Val02] G. Valentini. Gene expression data analysis of human lymphoma using support vector machine and output coding ensembles. Artifical
intelli-gence in medicine, 26(3):281–304, 2002.
[Vea02] V. Vapnik and et al. Gene selection for cancer classification using support vector machine. Machine Learning, 46:389–422, 2002.
[Wea01] M. West and et al. Predicting the clinical status of human breast cancer by using gene expression profiles. PNAS, 98(20):11462–11467, 2001.