AN ADAPTATION OF COBWEB FOR SYMBOLIC DATA CASE
Marcin Pe lka1
Department of Econometrics and Computer Science, Wroc law University of Economics, Poland
1. Introduction
Generally speaking clustering methods seek to organize some set of objects (items) into clusters in such way, that objects from the same cluster are more similar to each other than to objects from other clusters. Usually this similarity between the objects is measured by some distance measure (like Euclidean, Manhattan, etc.). These methods have been applied with success in many different areas such as taxonomy, image processing, data mining, etc. In general, clustering techniques can be divided into two groups of methods – hierarchical (agglomerative or divisive) and partitioning [see, for example, Gordon (1999); Jain et al. (1999)]. In cluster analysis, objects (patterns) are usually described by single-valued variables. This allows to represent each object as a vector of qualitative or quanti-tative measurements, where each column represents a variable. However, this kind of data representation is too restrictive to represent more complex data. To take into account the uncertainty and/or variability to the data, variables must assume sets of categories or intervals, including in some cases frequencies or weights.
Such kind of data have been mainly studied in Symbolic Data Analysis (SDA). The main aim of Symbolic Data Analysis is to provide suitable methods for man-aging aggregated or complex data described by multi-valued variables, where cells of the data table contain sets of categories, intervals, or weight (probability) dis-tributions [see for example Billard and Diday (2006); Bock and Diday (2000); Diday and Noirhomme-Fraiture (2008)].
There are many clustering algorithms that can be used in case of symbolic data – hierarchical, iterative Bock and Diday (2000); Diday and Noirhomme-Fraiture (2008); Billard and Diday (2006) and conceptual (pyramidal/ hierarchical clus-tering) Bock and Diday (2000). Pyramidal / hierarchical conceptual clustering method is, until now, the only one method that is capable to deal with different symbolic variable types. Conceptual clustering produces a classification scheme over the objects, and it goes one step further than conventional clustering methods by finding characteristic descriptions of each group. Each group represents a con-cept or a class. A concon-ceptual clustering system accon-cepts a set of object descriptions
(events, facts, observations) and produces a classification scheme over them. More generally we can say that in conceptual clustering a cluster is a set of objects that share some general property that derives from the entire set of objects.
COBWEB is a hierarchical conceptual clustering method that was proposed by Fisher in 1987 [see Fisher (1987)]. This algorithm was designed to deal with classical categorical data. In 1987 Fisher has introduced new clustering algorithm – COBWEB/2 Fisher (1987). In 1990 McKusick and Thompson McKusick and Thompson (1990) have proposed COBWEB/3 algorithm that could deal with numerical variables. In 2007 Xia and Xi [see Xia and Xi (2007)] have proposed an adaptation of COBWEB for clustering categorical data with uncertainty. Be-sides that COBWEB was an inspiration for many other conceptual clustering algorithms: LABYRINTH, OXBOW, ITERATE and finally CLASSIT, that was proposed in 1989 by Gennari et. al. Gennari et al. (1989), that is another modification of COBWEB. It allows to use quantitative variables.
While conventional clustering algorithms (like k-means) go over whole dataset until convergence is reached, COBWEB works incrementally and updates the clus-ter object by object. COBWEB forms clusclus-ters into a tree. The leaves represent every individual concept, and the root represents the whole dataset. COBWEB starts with a tree which contains only root node. Objects are added one by one and the tree is being updated, where four actions are possible. COBWEB will choose the action with the biggest category utility.
This paper contains six sections. The first one is the introduction. Second section of the paper describes briefly the nature of symbolic data and presents examples of symbolic variable types. The third section presents the adaptation of COBWEB for different symbolic variable types with some basic examples. Fourth part of the paper presents total utility-based (TU-based) COBWEB algorithm. The fifth section presents empirical example and is followed by a short summary.
2. Symbolic data analysis – objects and variables
There are six main symbolic variable types [Bock and Diday (2000), p. 2 and Billard and Diday (2006), see also Table 1]:
• Quantitative (numerical) variables:
– numerical single-valued variables, – numerical multi-valued variables, – interval variables,
– histogram variables.
• Qualitative (categorical) variables:
– categorical single-valued variables, – categorical multi-valued variables, – categorical modal variables.
TABLE 1
Example of symbolic variables and their realizations
Symbolic variable Realizations Variable type Price of a car [27000, 42000]; [35000, 50000] interval-valued
[in PLN] [20000, 30000]; [25000, 37000] (non-disjoint) Engine’s capacity [1000, 1200]; [1300, 1400] interval-valued
[in ccm] [1500, 1800]; [1900, 2200] (disjoint) Chosen color {red, black, blue, green} categorical
{orange, white, grey, magenta} multi-valued Preferred car {Toyota (0.3); Volvo (0.7)} categorical
{Audi (0.6), Skoda(0.35), VW (0.05)} modal
{BMW (1.0)}
Time spent {[0, 10] (0.6); [10; 20] (0.2); [20; 30] (0.2)} histogram traveling {[0, 10] (0.1); [10; 20] (0.2); [20; 30] (0.7)}
Regardless of their type symbolic variables also can be [Bock and Diday (2000), p. 2]:
• taxonomic – which presents prior known structure,
• hierarchically dependent – rules which decide if a variable is applicable or not have been defined,
• logically dependent – logical rules that affect variable’s values have been defined.
Generally speaking there are two main types of symbolic objects [Pe lka (2010), p. 342–343]:
1. First order objects – single product, respondent, company, etc. (single indi-viduals) described by symbolic variables. These objects are symbolic due to their nature.
2. Second order objects (aggregate objects, super individuals) – more or less homogeneous classes, groups of individuals described by symbolic variables. For more details on symbolic data, symbolic variables, and how symbolic data is obtained from classical data tables see Bock and Diday (2000); Billard and Diday (2006); Diday and Noirhomme-Fraiture (2008); Noirhomme-Fraiture and Brito (2011).
3. Adaptation of COBWEB for symbolic data 3.1. Classical categorical data case
As mentioned in the Section 1, COBWEB starts with a tree consisting only the root node. From there, objects are added one by one, with the tree being updated at each stage. And when new object is added, there are four possible actions.
The action with the biggest category utility will be chosen. The category utility (non-metrical variables – nominal or ordinal) is defined as follows:
∑n k=1P (Ck) [∑ i ∑ jP (Ai= Vij|Ck)2− ∑ i ∑ jP (Ai= Vij)2 ] n (1)
where: Vij – is the potential value of attribute Ai, q is the number of the nodes,
concepts that are forming the partition{C1, C2, . . . , Cq} at given level of the tree.
Category utility is the increased amount of the expected number of attribute values that can be correctly estimated from a partition
P (Ck) ∑ i ∑ j P (Ai= Vij|Ck)2 .
And the number of correct estimates without such knowledge is equal to ∑ i ∑ j P (Ai= Vij)2 .
Category utility rewards intra-class similarity which is equal to the probability P (Ai= Vij|Ck). Larger values mean that grater proportion of class members that
share attribute-value pair will be. COBWEB also rewards inter-class dissimilarity which is equal to P (Ck|Ai = Vij). Greater values mean fewer objects from different
classes will share this attribute-value pair.
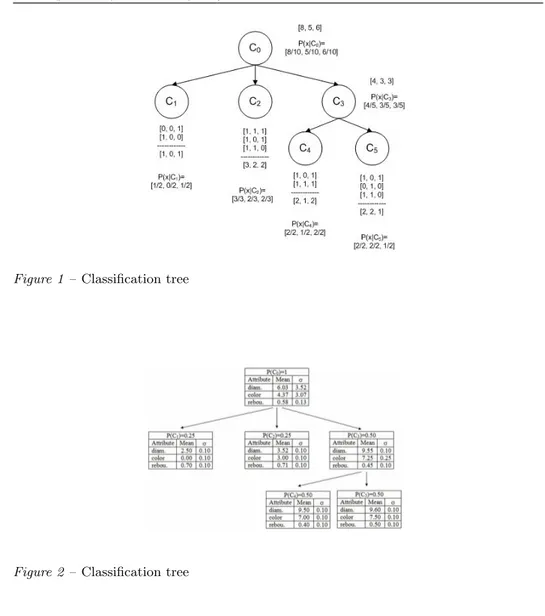
Please refer to Figure 1 as an example. Let concept C2 contain three objects: A1[1, 1, 1], A2[1, 0, 1], A3[1, 1, 0]. The three properties are: is under 25, is female, is unemployed. The count [3, 2, 2] that is stored at the concept node indicates that 3 of the objects are under 25, 2 of them are female and 2 are unemployed. The concept descriptor is the concept-conditional probabilities at the node. Probability that object at C2is female is 2/3, and the probability that object is under 25 is 3/3. Concept descriptor can be written as follows: [3/3, 2/3, 2/3]. This corresponds to the C2-conditional probabilities [3/3, 2/3, 2/3].
3.2. Classical numerical data case
In COBWEB/3 [proposed by McKusick and Thompson in 1990 McKusick and Thompson (1990)] a solution for classical metric variables was proposed, where mean and standard deviation are used. The transformed evaluation function is expressed by following equation:
∑ k = 1nP (Ck) ∑ i1/σik− ∑ i1/σip 4K√π , (2)
where: K is the number of cases, i = 1, . . . , I is the attribute number, σikis the
standard deviation for i-th attribute in k-th class, σipis the standard deviation of
Figure 1 – Classification tree
Figure 2 – Classification tree
As one problem with this transformed equation is that σ = 0 when a concept node describes a single instance, so the 1/σ is ∞. In such situation McKusick and Thompson propose to use user-specified parameter called acuity, to serve the minimum value for σ. Acuity presents the minimum detectable difference between instances.
Please refer to Figure 2 [see McKusick and Thompson (1990) for more details about this example] as the example for classical numerical data case, where acuity value is set to 0.1. The Figure 2 contains information about different balls, that are described by color, size and rebound. The node headers show conditional probabilities of the concept’s occurrence, just like in the case of Figure 1.
3.3. Symbolic interval-valued variables
When dealing with symbolic interval-valued data case, where variables have form [a, b], the Equation 2 is extended by a standard deviation for such kind of data:
S2= 1 3m ∑ u∈E ( b2u+ buau+ a2u ) − 1 4m [ ∑ u∈E (bu+ au) ]2 . (3)
Also a mean for symbolic data is applied in the classification tree: v = 1
2m ∑
u∈E
(bu+ au) . (4)
3.4. Symbolic categorical multivalued, categorical modal, and histogram variables Xia and Xi in 2007 [Xia and Xi (2007)] have proposed an extension for COBWEB algorithm when dealing categorical data with uncertainty. By the categorical data with uncertainty they mean same type of data like symbolic categorical modal variables, where each category is associated with a weight (or probability), for example: preferred car {BMW (0.6), VW (0.4)} – what means that someone is ready to spend 60% of his or her time, effort, money to buy BMW, and he or she is ready to spend 40% of his or her efforts to buy VW.
To deal with such data they have proposed another heuristic measure, called by them, probability utility (PU) which is defined as follows:
−∑n k=1P (Ck) [∑ i ∑ jσ 2 P (Ai=Vij|Ck)2− ∑ i ∑ jσ 2 P (Ai=Vij)2 ] n . (5)
Probability utility, is a function that rewards the similarity of the probability distributions of objects within the same cluster and the dissimilarity of the prob-ability distributions of objects between different clusters. Intra-class similarity is reflected by the term: −σP (Ai=Vij|Ck)2. Larger values mean that a big proportion
of the class member will share identical or similar probability distributions. Inter-class dissimilarity is represented by the term: σP (Ai=Vij)2. Bigger values of this
term mean that fewer objects in contrasting clusters will share identical or similar probability distributions.
Probability utility, expressed by Equation 5, can be applied by symbolic modal and histogram variables without any further assumptions or changes. One problem is when dealing symbolic categorical variables (e.g. preferred car color{white, red, black}; preferred town {London, Warsaw, Berlin, Madrid}), where no weights or probabilities are present. In such situation one can:
• obtain weights or probabilities from initial data (e.g. classical data) that was used to get symbolic objects,
• obtain weights or probabilities from other from other sources (e.g. conjoint analysis),
• assume, that all weights or probabilities for all categories in a particular variable are equal – {white, red, black} will be {white (0.33), red (0.33), black (0.33)} and {London, Warsaw, Berlin, Madrid} will be {London (0.25), Warsaw (0.25), Berlin (0.25), Madrid (0.25)}),
• weights or probabilities can be prior set by a researcher.
Further article will define total utility (TU) index for guiding the clustering. TU is a balance between category utility (CU) and probability utility (PU):
T U = αCU + (1− α)P U, (6)
where: 0≤ α ≤ 1.
When α = 0, this is the same as the regular COBWEB. When α is smaller, bigger weight is assigned to the similarity of probability distributions within the same cluster.
4. Total utility based COBWEB algorithm
Proposed extended COBWEB has to store in each node not only probabilities of observing particular category (in case of nominal or ordinal variables), but also probabilities (in case of symbolic multivalued variables, histograms and multival-ued variables with weights) and also means and standard devations (in case of ratio, interval and symbolic interval-valued variables).
Same as for traditional COBWEB, in extended version of this algorithm at each node four possible operations – insert, create, merge and split – will be considered and the one that yields the highest total utility will be selected.
When new object appears extended version of COBWEB descends the tree along an appropriate path, updates counts along the way, and searches for the best node to place the object. The decision of placing the object in a node is compared with creation of a completely new node for this object. Results of two operations – insert and create – are highly sensitive to the input order, like in conventional COBWEB. Adding two other operators – merge and split – makes this algorithm less sensitive to object input order.
All operators – insert, create, merge and split – take into account all kind of symbolic variables and for each of them total utility is calculated. It is suggested to choose α value according to the number of variables (for example if 4 out of 15 variables are multivalued, multivalued with weights or histogram variables, the α should be α = 154 = 0.27). All the operators must take into account information about weights (probabilities) for multivalued variables, multivalued variables with weights or histogram variables. Xia and Xi [see Xia and Xi (2007)] propose that the probabilities of the new node should be the weighted average of the probabilities. However in the case of symbolic data in pyramidal/hierarchical algorithm maximum rule was proposed – probabilities in the new node should be maximum.
5. Empirical example
In this section results of empirical example for clustering different symbolic vari-able types are presented. Rand measure [see: Rand (1971) for details] was used to measure quality of the clustering. UCI machine-learning repository – wine data set as applied in the experimental example. This data is available in SODAS software. This data contains 2 quantitative single variables, 21 interval-valued variables, 2 categorical single variables, 2 multivalued variables and one multi-valued variable with weight (modal variable). PAM clustering based on distance tables (where L1 distance for symbolic data was used), available in R software, was applied.
Two cluster structure was obtained:
Cluster 1: Contains following objects: Ausone, Lafleur, L’Evangile,
Lynch-Bages, Margaux, Petit Village, Petrus, Sassaicaia, Sociando Mallet, Trotanoy, Vieux Chateau Certan. 11 objects (wines) – that are not from the Grand Cru or the 1er Grand Cru wine classes.
Cluster 2: Contains following objects: Cheval Blanc, Cos d’Estournel,
Ducru-Beaucaillou, Haut-Brion, Lafite-Rothschild, Leoville Las Cases, tour, Mission Haut-Brion, Montrose, Mouton-Rothschild, Pichon C.de La-lande, Pichon Longueville. 12 objects (wines) – that are from the Grand Cru or the 1er Grand Cru wine classes.
Rand index was equal to 0.75 – it means we deal with a quite stable classi-fication of wines. Besides that the modified COBWEB allowed to discover two cluster structure: non-Cru wines (that do not belong to Grand Cru or 1er Grand Cru classes) and cru wines (that belong to Grand Cru or 1er Grand Cru classes).
6. Final remarks
In this paper modified COBWEB algorithm, which aims to improve accuracy and stability of clustering. This is obtained by allowing to use different, mixed, types of symbolic variables. The article presents how to deal with different types of symbolic variables and how to use them in modified COBWEB algorithm. As the future work author would like to check the stability and reliability of the proposed method when dealing noisy variables and/or outliers.
References
H. H. Bock, E. Diday (Eds) (2000). Analysis of symbolic data, explanatory methods for extracting statistical information from complex data. Springer-Verlag, Berlin-Heidelberg.
L. Billard, E. Diday (2006). Symbolic data analysis: Conceptual statistics and data mining. Wiley, Chichester.
E. Diday (1988). The symbolic approach in clustering and related methods of data analysis. In H. H. Bock (ed.), Classification and Related Methods of Data Analysis. North Holland, Amsterdam, pp. 673–684.
E. Diday (1989). Introduction ´a l’approche symbolique en analyse des donn´es. RAIRO, Recherche Op´erationnelle, 23(2), pp. 193–236.
E. Diday, M. Noirhomme-Fraiture (Eds.) (2008). Symbolic data analysis and the SODAS software. Wiley, Chichester.
D. Fisher (1987). Knowledge acquisition via incremental conceptual clustering. Machine Learning, vol. 2, pp. 139–172.
D. Fisher (1987). Knowledge acquisition via incremental conceptual clustering. Technical Report no. 87-22, University of California, Irvine.
J. H. Gennari, P. Langley, D. Fisher (1989). Models of incremental concept formation. Artificial Intelligence, vol. 40, issue 1-3, pp. 11–61.
A. D. Gordon (1999). Classification. Chapman and Hall/CRC, Boca Raton. A. K. Jain, M. N. Murty, P. J. Flynn (1999). Data clustering: A review.
ACM Computational Surveys 31 (3), pp. 264–323.
K. McKusick, K. Thompson (1990). COBWEB/3: a portable implementation. Technical Report FIA–90–6–18–2, NASA Ames Research Center, Moffett Field. M. Noirhomme-Fraiture, P. Brito (2011). Far beyond the classical data models: symbolic data analysis. Statistical Analysis and Data Mining, vol. 4, issue 2, pp. 157–170.
M. Pe lka (2010). Symbolic multidimensional scaling versus noisy variables and outliers. In H. Locarek-Junge, C. Weihs (Eds.) Classification as a tool for research. Springer-Verlag, Berlin-Heidelberg, 341–350.
W. M. Rand (1971). Objective criteria for the evaluation of clustering methods. Journal of American Statistical Associations, vol. 66, no. 336, pp. 846–850. Y. Xia, B. Xi (2007). Conceptual clustering categorical data with uncertainty.
Proceedings of the 19-th IEEE International Conference on Tools with Artificial Intelligence, vol. 1, Los Alamitos, California, pp. 329–336.
Summary
The paper proposes an extension for well-known COBWEB algorithm for different sym-bolic variable types. This extension allows to apply symsym-bolic variables for category utility evaluation. Main body of the paper presents how to adapt category utility for different symbolic variable types. Example shows an illustrative example of the proposed method.