UNIVERSITY
OF TRENTO
DIPARTIMENTO DI INGEGNERIA E SCIENZA DELL’INFORMAZIONE 38123 Povo – Trento (Italy), Via Sommarive 14
http://www.disi.unitn.it
EXPERIMENTAL VALIDATION OF PERCOLATION-BASED MODELS FOR PROPAGATION PREDICTION
R. Azaro, A. Martini, and A. Massa
December 2008
Experimental validation of percolation-based
models for propagation prediction
R. Azaro, A. Martini, and A. Massa
ELEDIA Research Group
Department of Information and Communication Technology University of Trento, Via Sommarive 14, I-38050 Trento, ITALY
E-mail: [email protected]
In this letter, an experimental validation of percolation-based approaches for the prediction of wave propagation in random media is presented. Measurements are collected in a real controlled environment, where the obstacles are stochastically placed in a two-dimensional grid according to a known non-uniform density distribution. The obtained results show that, in spite of their simplicity, percolation-based approaches can be applied in real propagation problems.
Introduction: The prediction of e.m. propagation in disordered distributions of
obstacles is a challenging research topic [1]. A possible approach to such a topic consists in modelling the propagation environment by means of a percolation lattice [2] and describing the propagation through a stochastic process. This allows one to obtain analytical closed-form solutions that describe the average properties of the e.m. propagation [3][4]. With reference to the far-external source scenario and under the assumption that the obstacles are non-uniformly distributed, this letter is aimed at presenting the results of an experimental validation performed in a real controlled environment to validate the percolation-based solutions [5][6].
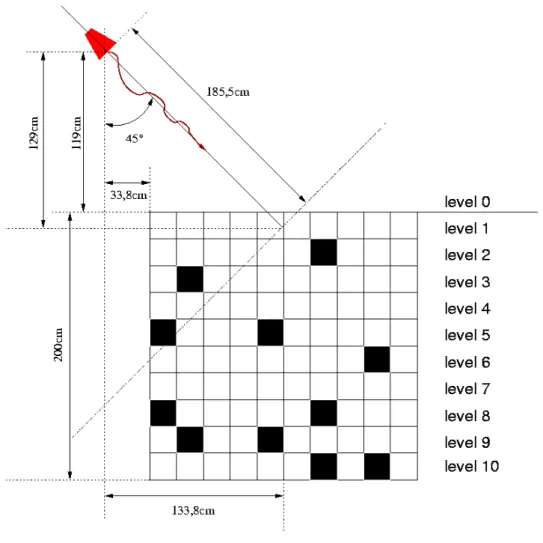
Setup: The experiments have been carried out in an anechoic chamber, 6 m
long, 3 m wide, and 4 m high, available at the ELEDIA laboratory. Sketch and wide-angle shot of the experimental setup are given in Fig. 1 and Fig. 2, respectively. A 2m-sided square area has been partitioned in K=10 rows, each one containing I=10 cells. Obstacle were polystyrene cylinders with square section (0.2m×0.2m), 2m high, lined with a metallic film. The transmitting device, aimed at modeling the e.m. source, was an Oritel ANC
100/15dB pyramidal horn antenna whose dimensions have been increased by
means of metallic plates to 190mm, 130mm, and 120mm, respectively. The transmitting antenna has been placed in the cross sectional plane of the targets and it has been oriented so that its symmetry axis crosses the middle of the first row and forms an angle of 45o with the upper side of the grid (see Fig. 1). The working frequency has been set to 9.6 GHz. Since both the transmitting antenna and the receiving one (i.e., a vertical half-wavelength monopole connected to an Agilent E4407B network analyzer) are fixed at a height equal to the half of the scatterers height, the behavior in the horizontal plane quite carefully approximate a two-dimensional scenario. The experiments are concerned with two linear obstacles density distributions (namely, profile L1 and profile L2 in Fig. 3) where the occupancy probability takes the form qj =q1+αj, j being the row index. For each obstacles density profile, S=20 different grid realizations (referred in the following as maps and randomly-generated according to the chosen profile distribution) have been considered. For each map, experimental data have been collected by locating the scatterers one row after the other. The measurements have been
collected in the successive and adjacent row by moving the dipole in correspondence with each one of the I=10 columns.
Definitions: The measured average path loss at a given row k is equal to:
( )
[
, ;]
[ ] 1 1 log 10 ) ( 1 1 10 P k i s dB IS P k PL I i S s m R T meas ⎥ ⎦ ⎤ ⎢ ⎣ ⎡ ⎟⎟ ⎠ ⎞ ⎜⎜ ⎝ ⎛ − =∑∑
= = (1)where PT is the transmitted power and PRm
[
( )
k,i ;s]
is the power measured at the (k+1,i)-th site in correspondence with the s-th realization when the grid is filled with obstacles till level k. On the other hand, the same quantity is numerically-estimated according to the following relationship:{
}
] [ 0 Pr ) ( log 10 ) ( 10 dB P k k P k PL T fs R ⎥ ⎥ ⎦ ⎤ ⎢ ⎢ ⎣ ⎡ → − = (2)where PRfs
( )
k is the average power received at level k in free space and{
0→k}
Pr is the probability that a single ray impinging on the two-dimensional percolation lattice reaches level k before being reflected back into the above empty half-plane. Such quantity is analytically computed by following either the Markov approach [5] or the Martingale approach [6].
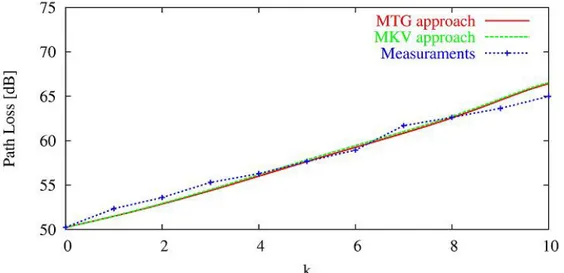
Results: Figures 4 and 5 show the results obtained for the obstacles density profiles in Fig. 3 by means of (2) by applying the Martingale as well as the Markov approach. The estimated values are compared with those measured and using (1). Although several sources of error as well as approximations (e.g., measurement inaccuracies, not infinite grid in the horizontal direction, not perfect two-dimensional structure, limited data sample) are present, a
good matching between theoretical and reference data can be noticed whatever the obstacles distribution and the prediction approach.
Conclusions: In this letter, some representative results from an experimental validation of percolation-based approaches for the prediction of wave propagation in random media have been presented. The matching between measured and computed data values has assessed the reliability of statistic strategies.
References
1. A. Ishimaru, Wave propagation and scattering in random media, IEEE Press, 1997.
2. G. Grimmet, Percolation, Springer-Verlag, 1989.
3. G. Franceschetti, S. Marano, and F. Palmieri, Wave propagation without wave equation towards an urban area model, IEEE Trans. Antennas Propagat. (47) 1999, 1393-1404.
4. S. Marano and M. Franceschetti, Ray propagation in a random lattice, a maximum entropy anomalous diffusion process, IEEE Trans. Antennas Propagat. (53) 2005, 1888-1896.
5. A. Martini, M. Franceschetti, and A. Massa, Ray propagation in nonuniform random lattices, J. Opt. Soc. Am. A (23) 2006, 2251-2261. 6. A. Martini, R. Azaro, M. Franceschetti, and A. Massa, Ray propagation
in nonuniform random lattices – Part II, J. Opt. Soc. Am. A (24) 2007, 2363-2371.
Figure captions:
Fig. 1 Sketch of the experimental setup
Fig. 2 Wide-angle shot of the experimental setup Fig. 3 Obstacles density profiles
Fig. 4 Estimated and reference values of PL(k) vs. k for the profile L1. Fig. 5 Estimated and reference values of PL(k) vs. k for the profile L2.